. 2021 Feb 25:8:627146.
doi: 10.3389/fcell.2020.627146. eCollection 2020.

Deletion of Mea6 in Cerebellar Granule Cells Impairs Synaptic Development and Motor Performance

Affiliations

Deletion of Mea6 in Cerebellar Granule Cells Impairs Synaptic Development and Motor Performance

Xin-Tai Wang et al. Front Cell Dev Biol. .

Abstract

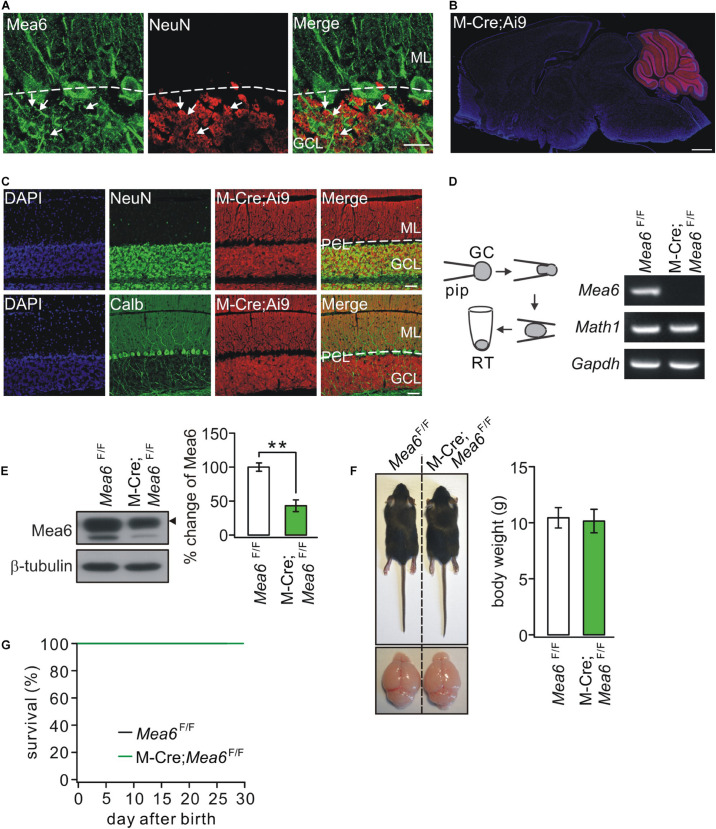
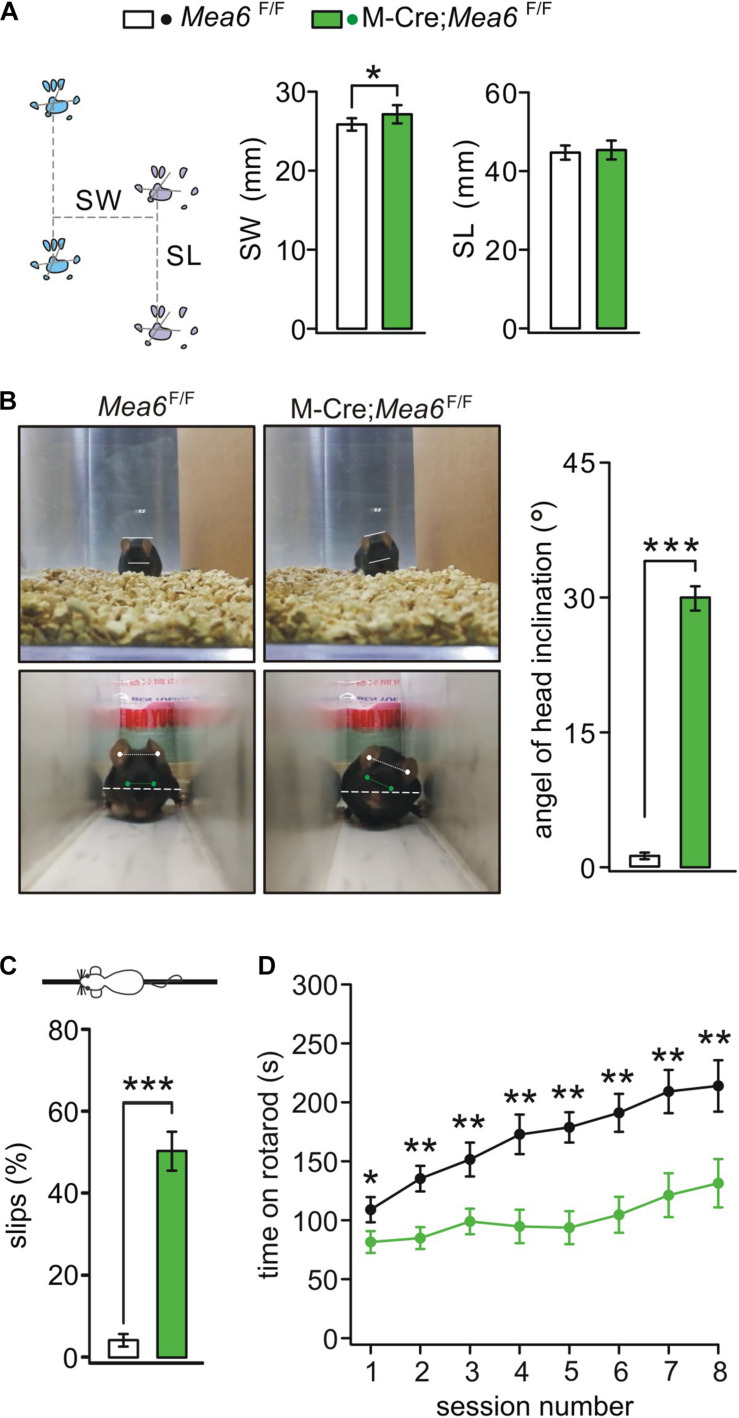
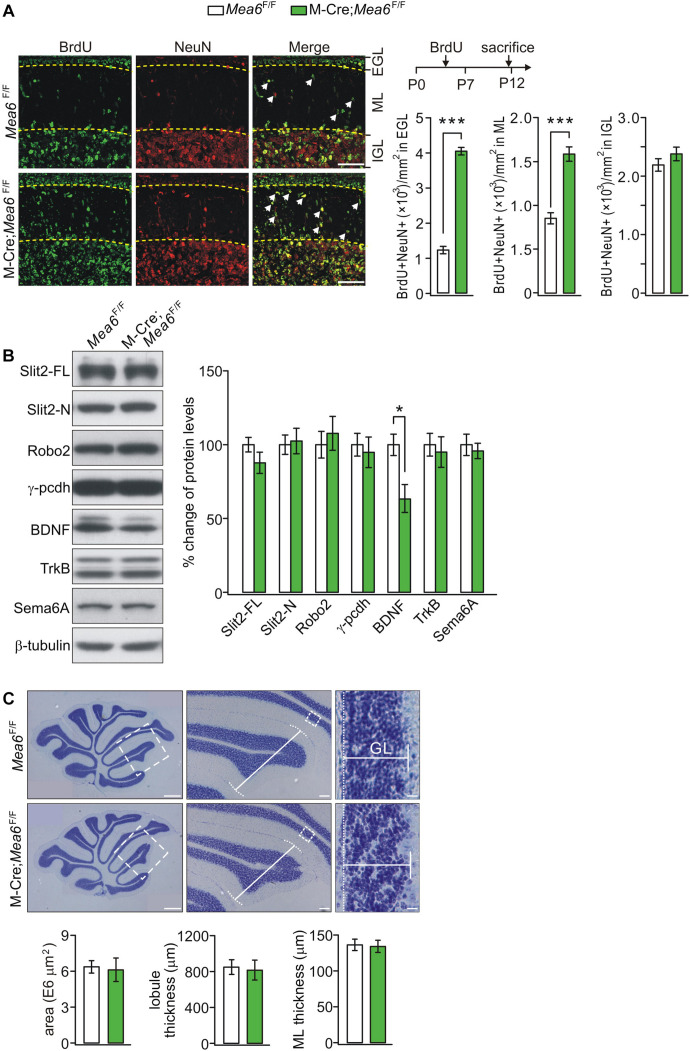
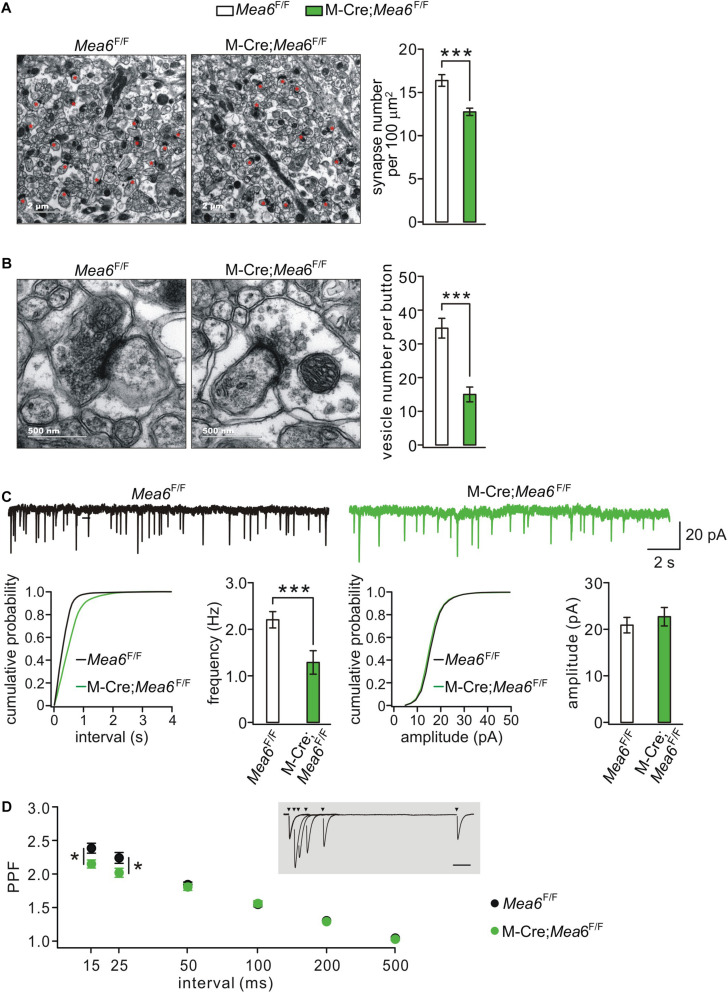
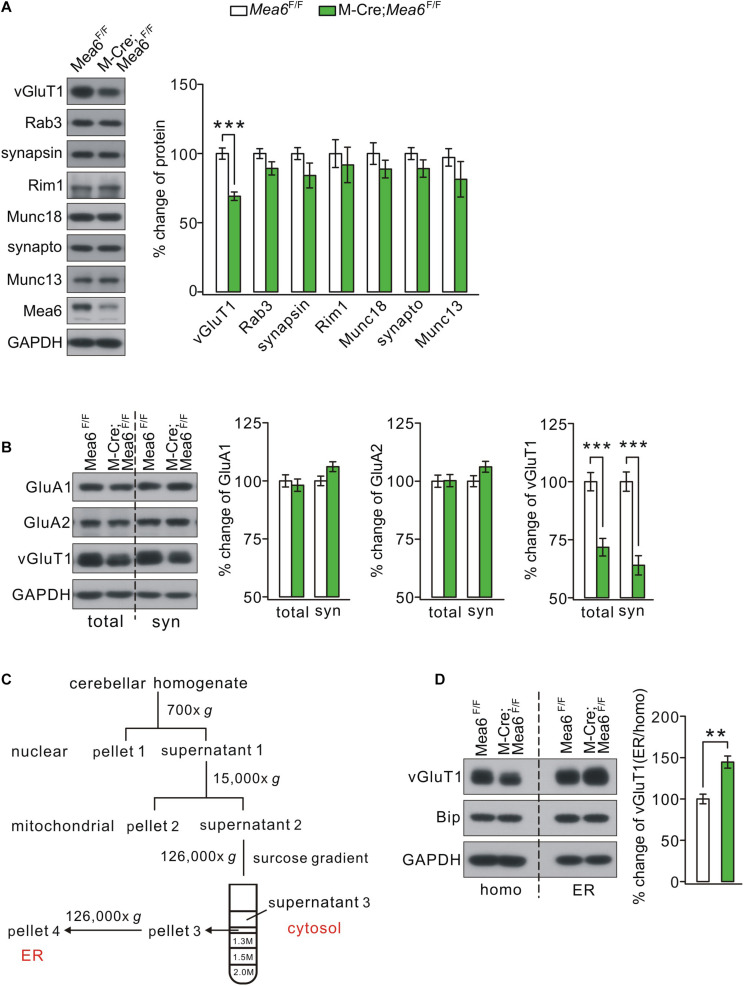
The cerebellum is conceptualized as a processor of complex movements. Many diseases with gene-targeted mutations, including Fahr's disease associated with the loss-of-function mutation of meningioma expressed antigen 6 (Mea6), exhibit cerebellar malformations, and abnormal motor behaviors. We previously reported that the defects in cerebellar development and motor performance of Nestin-Cre;Mea6 F/F mice are severer than those of Purkinje cell-targeted pCP2-Cre;Mea6 F/F mice, suggesting that Mea6 acts on other types of cerebellar cells. Hence, we investigated the function of Mea6 in cerebellar granule cells. We found that mutant mice with the specific deletion of Mea6 in granule cells displayed abnormal posture, balance, and motor learning, as indicated in footprint, head inclination, balanced beam, and rotarod tests. We further showed that Math1-Cre;Mea6 F/F mice exhibited disrupted migration of granule cell progenitors and damaged parallel fiber-Purkinje cell synapses, which may be related to impaired intracellular transport of vesicular glutamate transporter 1 and brain-derived neurotrophic factor. The present findings extend our previous work and may help to better understand the pathogenesis of Fahr's disease.

Keywords: Fahr’s syndrome; Mea6; granule cell; malformation; motor performance; vGluT1.


Conflict of interest statement

The authors declare that the research was conducted in the absence of any commercial or financial relationships that could be construed as a potential conflict of interest.

Figures

FIGURE 1
FIGURE 1
The ablation of Mea6 in Math1(M)-Cre;Mea6F/F mice. (A) The immunostaining of Mea6 (green) and NeuN (red) in mouse cerebellum. Arrows show Mea6-expressing granule cells. Scale bars: 20 μm. ML, molecular layer; GCL, granule cell layer. (B) Native tdTomato fluorescence in the whole brain from a Math1(M)-Cre;Ai9 mouse, indicating that Cre-recombinase is selectively expressed in the cerebellum. Scale bars: 1 mm. (C) Staining of NeuN or calbindin (Calb) with DAPI in the cerebellum of M-Cre;Ai9 mouse. Scale bars: 50 μm. (D) Granule cell contents of Mea6F/F and Math1-Cre;Mea6F/F mice (P21) were harvested using glass micropipettes (pip, OD 2 mm) and placed in a centrifuge tube. The contents collected from 10 cells were subjected to RT-PCR. A typical electrophoresis of Mea6 (157 bp), Math1 (151 bp), and Gapdh (233 bp) is show in the right (n = 5 trials). (E) Western blots of Mea6 in the cerebellum of Mea6F/F and Math1-Cre;Mea6F/F mice (P21), as indicated by the black triangle. The percentage changes of Mea6 were 100 ± 6% (Mea6F/F; n = 10) and 44 ± 9% (Math1-Cre;Mea6F/F; n = 10), p = 0.001 (unpaired t test). (F) The pictures of bodies and brains of Mea6F/F and Math1-Cre;Mea6F/F at P21. Average body weights were 10.4 ± 0.8 g (Mea6F/F; n = 10) and 10.2 ± 1.0 g (Math1-Cre;Mea6F/F; n = 10), p = 0.78 (unpaired t test). (G) Kaplan-Meier survival curves of Mea6F/F (n = 59 mice) and Math1-Cre;Mea6F/F mice (n = 59 mice). **p < 0.01.
FIGURE 2
FIGURE 2
Abnormal gait and motor learning in Math1(M)-Cre;Mea6F/F mice. (A) Footprints of Mea6F/F and Math1-Cre;Mea6F/F mice. Stride width (SW): 25.8 ± 0.8 mm (Mea6F/F; n = 16) and 27.1 ± 1.1 mm (Math1-Cre;Mea6F/F; n = 17), p = 0.02 (unpaired t test). Stance length (SL): 44.7 ± 1.8 mm (Mea6F/F; n = 16) and 45.3 ± 2.4 mm (Math1-Cre;Mea6F/F; n = 17), p = 0.52 (unpaired t test). (B) The upper panel shows a head inclination phenotype in a M-Cre;Mea6F/F mouse during the free moving in the cage. The lower panel shows the measurement of head inclination when Mea6F/F and M-Cre;Mea6F/F mice traversed a white plexiglass tunnel (100 cm × 10 cm × 10 cm). The white lines show the alignments of ears and eyes. The average angels of head inclination: 1.2 ± 0.4° (Mea6F/F) and 30.0 ± 1.3° (Math1-Cre;Mea6F/F), p < 0.001 (unpaired t test). (C) The percentages of hindpaw slips during runs on an elevated horizontal beam. Mea6F/F: 4.1 ± 1.0% (n = 24). Math1-Cre;Mea6F/F: 48.4 ± 4.5% (n = 29), p < 0.001 (unpaired t test). (D) Time spent on the accelerating rotarod for Mea6F/F (n = 13) and Math1-Cre;Mea6F/F mice (n = 16) at P90. Session 1: 108.9 ± 10.6 s (Mea6F/F) and 81.5 ± 9.2 s (Math1-Cre;Mea6F/F), p = 0.04 (unpaired t test); Session 2: 135.3 ± 10.9 s (Mea6F/F) and 84.8 ± 9.3 s (Math1-Cre;Mea6F/F), p = 0.001 (unpaired t test); Session 3: 151.5 ± 14.3 s (Mea6F/F) and 98.9 ± 10.8 s (Math1-Cre;Mea6F/F), p = 0.004 (unpaired t test); Session 4: 187.5 ± 16.8 s (Mea6F/F) and 94.8 ± 14.2 s (Math1-Cre;Mea6F/F), p = 0.001 (unpaired t test); Session 5: 178.8 ± 12.8 s (Mea6F/F) and 93.7 ± 14.0 s (Math1-Cre;Mea6F/F), p = 0.001 (unpaired t test); Session 6: 191.1 ± 16.1 s (Mea6F/F) and 104.6 ± 15.2 s (Math1-Cre;Mea6F/F), p = 0.004 (unpaired t test); Session 7: 209.2 ± 18.3 s (Mea6F/F) and 121.25 ± 18.6 s (Math1-Cre;Mea6F/F), p = 0.002 (unpaired t test); Session 8: 213.9 ± 21.8 s (Mea6F/F) and 131.4 ± 20.5 s (Math1-Cre;Mea6F/F), p = 0.008 (unpaired t test). *p < 0.05, **p < 0.01, ***p < 0.001.
FIGURE 3
FIGURE 3
Deficiency in GCP migration in Math1(M)-Cre;Mea6F/F mice. (A) Migrating GCPs in Mea6F/F and Math1-Cre;Mea6F/F cerebellum were treated with BrdU at P7 and labeled with anti-BrdU antibody after 5 days. White arrows show migrating GCPs in molecular layer (ML). Scale bars: 50 μm. The quantification of the numbers of NeuN+ and BrdU+ cells per 1 mm2 is shown in bar graphs. BrdU+/NeuN+ cells in EGL: 1220.4 ± 106.5 (Mea6F/F; n = 13) and 4061.7 ± 106.7 (Math1-Cre;Mea6F/F; n = 12), p < 0.001 (unpaired t test). BrdU+/NeuN+ cells in ML: 854.3 ± 64.5 (Mea6F/F; n = 13) and 1591.6 ± 81.8 (Math1-Cre;Mea6F/F; n = 12), p < 0.001 (unpaired t test). BrdU+/NeuN+ cells in IGL: 2199.4 ± 106.3 (Mea6F/F; n = 13) and 2388.8 ± 117.7 (Math1-Cre;Mea6F/F; n = 12), p = 0.24 (unpaired t test). (B) Protein levels of Slit2, Robo2, γ-pcdh, BDNF, TrkB, and Sema6A in the cerebellum of Mea6F/F and Math1-Cre;Mea6F/F mice at P20 (n = 6 pairs). β-tubulin was used as the control. BDNF: 100 ± 7% (Mea6F/F) and 63 ± 9% (Math1-Cre;Mea6F/F), p = 0.04 (unpaired t test). (C) Nissl staining of sagittal cerebellar sections from Mea6F/F and Math1-Cre;Mea6F/F mice at P25. The middle panel (Scale bars: 100 μm) is the higher magnification of left panel (Scale bars: 200 μm) and the right panel (Scale bars: 10 μm) is the higher magnification of middle panel, as indicated by white dashed boxes. Cerebellar area: 6.4 ± 0.5 E6 μm2 (Mea6F/F; n = 7) and 6.1 ± 1.0 E6 μm2 (Math1-Cre;Mea6F/F; n = 6), p = 0.13 (unpaired t test). Lobule III thickness: 849 ± 81 μm (Mea6F/F; n = 7) and 815 ± 109 μm (Math1-Cre;Mea6F/F; n = 7), p = 0.51 (unpaired t test). Thickness of granule cell layer (GCL; lobule III): 136 ± 8 μm (Mea6F/F; n = 7) and 134 ± 8 μm (Math1-Cre;Mea6F/F; n = 7), p = 0.43 (unpaired t test). *p < 0.05, ***p < 0.001.
FIGURE 4
FIGURE 4
Granule cell-specific deletion of Mea6 impairs synaptic formation and function. (A) Representative EM (11,000×) of parallel fiber-Purkinje cell synapses from Mea6F/F and Math1(M)-Cre;Mea6F/F mice (P30). Synapses comprising of parallel fiber boutons opposed to Purkinje cell spines are marked with red asterisks. Scale bars: 2 μm. Bar graphs show average numbers of synapses per 100 μm2 in Mea6F/F (16.4 ± 0.7; n = 26) and Math1-Cre;Mea6F/F mice (12.7 ± 0.4; n = 49), p < 0.001 (unpaired t test). (B) Representative EM (68,000×) of parallel fiber-Purkinje cell synapses from Mea6F/F and Math1-Cre;Mea6F/F mice (P30). Scale bars: 500 nm. Bar graphs show average numbers of total pre-synaptic vesicles per synapse in Mea6F/F (34.7 ± 2.9; n = 26) and Math1-Cre;Mea6F/F mice (15.0 ± 2.2; n = 27), p < 0.001 (unpaired t test). (C) Example Purkinje cell mEPSCs from Mea6F/F and Math1-Cre;Mea6F/F mice (P21–25). The lower panels show cumulative probabilities and statistics of frequency and amplitude of mEPSCs. Frequency: 2.3 ± 0.2 Hz (Mea6F/F; n = 15) and 1.6 ± 0.1 Hz (Math1-Cre;Mea6F/F; n = 19; p = 0.006), p = 0.006 (unpaired t test). Amplitude: 20.8 ± 0.9 pA (Mea6F/F; n = 15) and 23.7 ± 2.0 pA (Math1-Cre;Mea6F/F; n = 19), p = 0.34 (unpaired t test). (D) PPF as a function of interstimulus intervals in Mea6F/F and Math1-Cre;Mea6F/F mice (P21–23). The inset shows the superposition of PF-EPSCs evoked at different intervals in a WT cell. PPF ratios: 2.4 ± 0.1 (Mea6F/F; n = 12) and 2.1 ± 0.1 (Math1-Cre;Mea6F/F; n = 16) at 15 ms, p = 0.03 (unpaired t test); 2.2 ± 0.1 (Mea6F/F; n = 12) and 2.0 ± 0.1 (Math1-Cre;Mea6F/F; n = 16) at 25 ms, p = 0.03 (unpaired t test). *p < 0.05, ***p < 0.001.
FIGURE 5
FIGURE 5
Mea6 deficiency affects the transport of vGluT1 from ER to Golgi apparatus. (A) Protein levels of vGluT1, Rab3A (Rab3), synapsin-1 (synapsin), Rim1, Munc18-1 (Munc18), synaptophysin (synapto), Munc13-1 (Munc13), and Mea6 in Mea6F/F and Math1-Cre;Mea6F/F cerebellum at P21. The results were obtained from eight pairs of mice. GAPDH was used as the loading control. (B) Protein levels of GluA1, GluA2, and vGluT1 in the cerebellum from Mea6F/F and Math1-Cre;Mea6F/F mice at P21. Six independent replicates were performed. GAPDH was used as the loading control. vGluT1 in total cerebellum: 100 ± 4% (Mea6F/F) and 72 ± 4% (Math1-Cre;Mea6F/F), p < 0.001 (unpaired t test). vGluT1 in cerebellar synaptosome: 100 ± 4% (Mea6F/F) and 64 ± 4% (Math1-Cre;Mea6F/F), p < 0.001 (unpaired t test). (C) A cartoon illustrating the procedures for the purification of subcellular organelles. More details are given in Experimental Procedures. The purification of ER was confirmed by the Western blotting assay of marker proteins. (D) Western blotting assay of vGluT1 in ER purified from Mea6F/F and M-Cre;Mea6F/F mouse cerebella. Bip was used as the internal control. vGluT1: 100 ± 6% (Mea6F/F) and 146 ± 7% (Math1-Cre;Mea6F/F). The experiment was performed eight times. p = 0.001 (unpaired t test). **p < 0.01, ***p < 0.001.

Similar articles

Cited by

References

    1. Alder J., Cho N. K., Hatten M. E. (1996). Embryonic precursor cells from the rhombic lip are specified to a cerebellar granule neuron identity. Neuron 17 389–399. 10.1016/s0896-6273(00)80172-5 - DOI - PubMed
    1. Borghesani P. R., Peyrin J. M., Klein R., Rubin J., Carter A. R., Schwartz P. M., et al. (2002). BDNF stimulates migration of cerebellar granule cells. Development 129 1435–1442. - PubMed
    1. Comtesse N., Niedermayer I., Glass B., Heckel D., Maldener E., Nastainczyk W., et al. (2002). MGEA6 is tumor-specific overexpressed and frequently recognized by patient-serum antibodies. Oncogene 21 239–247. 10.1038/sj.onc.1205005 - DOI - PubMed
    1. Englund C., Kowalczyk T., Daza R. A., Dagan A., Lau C., Rose M. F., et al. (2006). Unipolar brush cells of the cerebellum are produced in the rhombic lip and migrate through developing white matter. J. Neurosci. 26 9184–9195. 10.1523/JNEUROSCI.1610-06.2006 - DOI - PMC - PubMed
    1. Fan J., Wang Y., Liu L., Zhang H., Zhang F., Shi L., et al. (2017). cTAGE5 deletion in pancreatic β cells impairs proinsulin trafficking and insulin biogenesis in mice. J. Cell Biol. 216 4153–4164. 10.1083/jcb.201705027 - DOI - PMC - PubMed

LinkOut - more resources