. 2021 Feb 25:9:615098.
doi: 10.3389/fcell.2021.615098. eCollection 2021.

Transcriptome Analysis of Dnmt3l Knock-Out Mice Derived Multipotent Mesenchymal Stem/Stromal Cells During Osteogenic Differentiation

Affiliations

Transcriptome Analysis of Dnmt3l Knock-Out Mice Derived Multipotent Mesenchymal Stem/Stromal Cells During Osteogenic Differentiation

Chih-Yi Yang et al. Front Cell Dev Biol. .

Abstract

Multipotent mesenchymal stem/stromal cells (MSCs) exhibit great potential for cell-based therapy. Proper epigenomic signatures in MSCs are important for the maintenance and the subsequent differentiation potential. The DNA methyltransferase 3-like (DNMT3L) that was mainly expressed in the embryonic stem (ES) cells and the developing germ cells plays an important role in shaping the epigenetic landscape. Here, we report the reduced colony forming ability and impaired in vitro osteogenesis in Dnmt3l-knockout-mice-derived MSCs (Dnmt3l KO MSCs). By comparing the transcriptome between undifferentiated Dnmt3l KO MSCs and the MSCs from the wild-type littermates, some of the differentially regulated genes (DEGs) were found to be associated with bone-morphology-related phenotypes. On the third day of osteogenic induction, differentiating Dnmt3l KO MSCs were enriched for genes associated with nucleosome structure, peptide binding and extracellular matrix modulation. Differentially expressed transposable elements in many subfamilies reflected the change of corresponding regional epigenomic signatures. Interestingly, DNMT3L protein is not expressed in cultured MSCs. Therefore, the observed defects in Dnmt3l KO MSCs are unlikely a direct effect from missing DNMT3L in this cell type; instead, we hypothesized them as an outcome of the pre-deposited epigenetic signatures from the DNMT3L-expressing progenitors. We observed that 24 out of the 107 upregulated DEGs in Dnmt3l KO MSCs were hypermethylated in their gene bodies of DNMT3L knock-down ES cells. Among these 24 genes, some were associated with skeletal development or homeostasis. However, we did not observe reduced bone development, or reduced bone density through aging in vivo. The stronger phenotype in vitro suggested the involvement of potential spreading and amplification of the pre-deposited epigenetic defects over passages, and the contribution of oxidative stress during in vitro culture. We demonstrated that transient deficiency of epigenetic co-factor in ES cells or progenitor cells caused compromised property in differentiating cells much later. In order to facilitate safer practice in cell-based therapy, we suggest more in-depth examination shall be implemented for cells before transplantation, even on the epigenetic level, to avoid long-term risk afterward.

Keywords: DNA methylation; DNMT3L; bone-marrow MSCs; epigenetics; osteogenesis.


Conflict of interest statement

The authors declare that the research was conducted in the absence of any commercial or financial relationships that could be construed as a potential conflict of interest.

Figures

FIGURE 1
FIGURE 1
Dnmt3l KO BM-MSCs have significantly reduced CFU-F forming rate and impaired osteogenic potential. (A) Dnmt3l KO and wild type MSCs at passage 4 were seeded at 1000 cells per well or 2000 cells per well density on 6-well plate, and calculate the colony forming unit-fibroblasts (CFU-F) number after 9 days of culture. Two batches of independent studies with mixed BM-MSCs from three mice of each genotype were shown. (B) The bar chart shows CFU-F from WT and Dnmt3l KO mice. The CFU-F with diameter greater than 2 mm were considered valid. (C) MSCs expanded from passage 3 to 4 were seeded at a density of 2 × 10⁴ cells per well in 12 well plates. Cells from three wells of each genotype were isolated each day for 11 days and were calculated for live cell numbers based on trypan blue dye exclusion. (D) MSCs expanded from passage 3 to 4 were seeded at 5 × 10⁴ cells per cm2 for each well in 6-well plates. Cells were cultured in osteogenic induction medium once confluence was reached. After 14 days of osteogenic induction, calcium precipitation was quantified by alizarin red S staining. The osteogenic ability was dramatically decreased in MSCs derived from Dnmt3l KO mice compared to that in MSCs obtained from their wild-type littermates. The data are presented as the means ± SEM. *p < 0.05, **p < 0.01.
FIGURE 2
FIGURE 2
The ∼50 kDa canonical stem cell form of DNMT3L protein is not detectable in MSCs. (A) No sequencing reads were mapped to exons 1–8 of Dnmt3l suggesting no canonical ∼50 kDa DNMT3L expression in MSCs. However, a potential novel isoform of Dnmt3l transcript starting from exon 9a can be observed to be expressed in low level in wild type but not Dnmt3l KO mice derived BM-MSCs. In contrast, 3 Dnmt3l isoforms that were described in adult testes previously all starting from exon 9b. (B) The canonical stem cell form of ∼50 kDa DNMT3L expression is highly expressed in ES cells detected by Western blotting. However, even under overexposure, there were no detectable DNMT3L signals at early passage (P2, P3, and P4) of MSCs. (C) Possibility of small DNMT3L (estimated to be 126 AA of around 20 kDa) expression has not been excluded but no distinct bands may be observed from our Western analysis of the MSC samples.
FIGURE 3
FIGURE 3
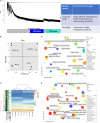
Analyses of Dnmt3l genotype-specific differentially expressed genes (DEGs) in undifferentiated and differentiating MSCs on day 3 of osteogenic induction. (A) Weighted correlation network analysis was performed, with the two major gene modules marked in turquoise and blue. The first (turquoise block) module contains 928 genes enriched in cell, morphogenesis and stem cell differentiation. The other module has 898 genes that are categorized as maintenance of DNA methylation. (B) Principal component analysis (PCA) of gene expression. (C) Each row represents a DEG. Four groups of DEGs are shown on the left and marked in green. Most DEGs highlight the transition during differentiation. There are also differences between the WT and Dnmt3l KO MSCs, indicating the contribution of DNMT3L to these differences. The heatmaps illustrate the expression patterns of genes that are modulated by either differentiation or the DNMT3L effect. DEG_wt_d3l_un: DEGs between WT and Dnmt3l KO in undifferentiated MSCs; DEG_wt_d3lKO_D: DEGs between WT and Dnmt3l KO in differentiating MSCs; DEG_D_un_wt: DEGs between undifferentiated and differentiating MSCs derived from WT mice; and DEG_D_un_d3lKO: DEGs between undifferentiated and differentiating MSCs in Dnmt3l KO mice-derived MSCs. (D) Gene ontology analysis of DEGs between WT and Dnmt3l KO undifferentiated MSCs. (E) Gene ontology analysis of osteogenic differentiating (day 3 of osteogenic induction) DEGs between WT and Dnmt3l KO MSCs. All GO terms presented on the bubble plots have an adjusted p-value of <0.05.
FIGURE 4
FIGURE 4
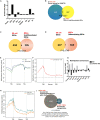
Possibility of DNMT3L-mediated legacy and the DNA methylation level contributing to the compromised self-renewal and differentiation potential of Dnmt3l KO MSCs. (A) Enriched DNMT3L binding in ES cells is observed in the 5′UTR and coding region of coding genes. (B) Only 11 out of 308 DEGs between undifferentiated MSCs derived from WT and Dnmt3l KO mice are direct DNMT3L binding targets in ES cells. (C) Only four genes are differentially expressed in both ES cells and undifferentiated MSCs between the WT and Dnmt3l mutant cells (Dnmt3l KO MSCs and Dnmt3l KD ESCs); (D) Only seven genes are differentially expressed in both ES cells and differentiating MSCs between WT and Dnmt3l mutants. (E) DNA methylation level in WT and Dnmt3l KD ES cells are profiled for all genes as well as their immediate upstream and downstream regions. (F) The methylation regions in Dnmt3l KD ES cells are enriched in the 5′UTR and coding sequence. (G) Differential gene methylation between WT and Dnmt3l KD ES cells. Greater enrichment on TEs in WT ES cells are observed, indicating that DNMT3L facilitates de novo methylation in these sequences. (H) The difference in gene methylation between WT and Dnmt3l KD in high/low expression genes. (I) Twenty-four out of 107 genes upregulated in Dnmt3l KO MSCs are overlapped with hypermethylated genes in ES cells with Dnmt3l knock down. The p-value calculated by hypergeometric test is very low, indicating that these 24 up-regulated genes in Dnmt3l KO MSCs are not due to random overlapping in highly methylated ES cells.
FIGURE 5
FIGURE 5
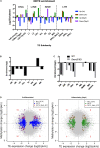
Dnmt3l genotype associated differential TE expressions and DNA methylation levels in MSCs. (A) Significant changes of TE expression patterns were observed in Dnmt3l– /– undifferentiated and differentiating MSCs, compared to wild type MSCs. Blue, upregulated TEs in undifferentiated Dnmt3l KO MSCs, UP (Un). Brown, downregulated TEs in undifferentiated Dnmt3l KO MSCs, Down (Un). Green and purple indicate upregulated and downregulated TEs in differentiating MSCs at day 3 of osteogenesis induction, UP (Day3) and Down (Day3), respectively. (B) The DNA methylation is obvious low at TE regions in ES cells. In addition to repeat sequences, DNMT3L binding regions are mostly enriched in satellites in ES cells. (C) DNMT3L associated differentially methylated TEs in ES cells (D) Blue dots indicate Dnmt3l KO genotype associated differentially expressed TEs in undifferentiated MSCs (left); Green dots indicate Dnmt3l KO genotype associated differentially expressed TEs in differentiating MSCs (right); red circled dots indicate differentially expressed TE with a ≥2-fold change in methylation in Dnmt3l KD ES cells.
FIGURE 6
FIGURE 6
Hypothesis of DNMT3L-mediated epigenome legacy from embryonic stem cells influencing MSC properties. We propose that the expression of DNMT3L in ES cells is essential to maintain the normal epigenome. Some of these DNMT3L associated epigenomic landscape may be carried over all the way from pluripotent stem cells to influence isolated MSC properties from adult mice, and their self-renewal and differentiation abilities in vitro.

References

    1. Aapola U., Kawasaki K., Scott H. S., Ollila J., Vihinen M., Heino M., et al. (2000). Isolation and initial characterization of a novel zinc finger gene, DNMT3L, on 21q22.3, related to the cytosine-5-methyltransferase 3 gene family. Genomics 65 293–298. 10.1006/geno.2000.6168 - DOI - PubMed
    1. Abdi R., Fiorina P., Adra C. N., Atkinson M., Sayegh M. H. (2008). Immunomodulation by mesenchymal stem cells: a potential therapeutic strategy for type 1 diabetes. Diabetes 57 1759–1767. 10.2337/db08-0180 - DOI - PMC - PubMed
    1. Atlasi Y., Stunnenberg H. G. (2017). The interplay of epigenetic marks during stem cell differentiation and development. Nat. Rev. Genet. 18 643–658. 10.1038/nrg.2017.57 - DOI - PubMed
    1. Ballini A., Scacco S., Coletti D., Pluchino S., Tatullo M. (2017). Mesenchymal Stem Cells as Promoters, Enhancers, and Playmakers of the Translational Regenerative Medicine. Stem Cells Int. 2017 3292810. 10.1155/2017/3292810 - DOI - PMC - PubMed
    1. Bender C. M., Gonzalgo M. L., Gonzales F. A., Nguyen C. T., Robertson K. D., Jones P. A. (1999). Roles of cell division and gene transcription in the methylation of CpG islands. Mol. Cell Biol. 19 6690–6698. - PMC - PubMed