

Single-Cell RNA Sequencing and Quantitative Proteomics Analysis Elucidate Marker Genes and Molecular Mechanisms in Hypoplastic Left Heart Patients With Heart Failure
- PMID: 33718359
- PMCID: PMC7946977
- DOI: 10.3389/fcell.2021.617853
Single-Cell RNA Sequencing and Quantitative Proteomics Analysis Elucidate Marker Genes and Molecular Mechanisms in Hypoplastic Left Heart Patients With Heart Failure
Abstract
Objective: To probe markers and molecular mechanisms of the hypoplastic left heart (HLH) by single-cell RNA sequencing (scRNA-seq) and quantitative proteomics analysis.
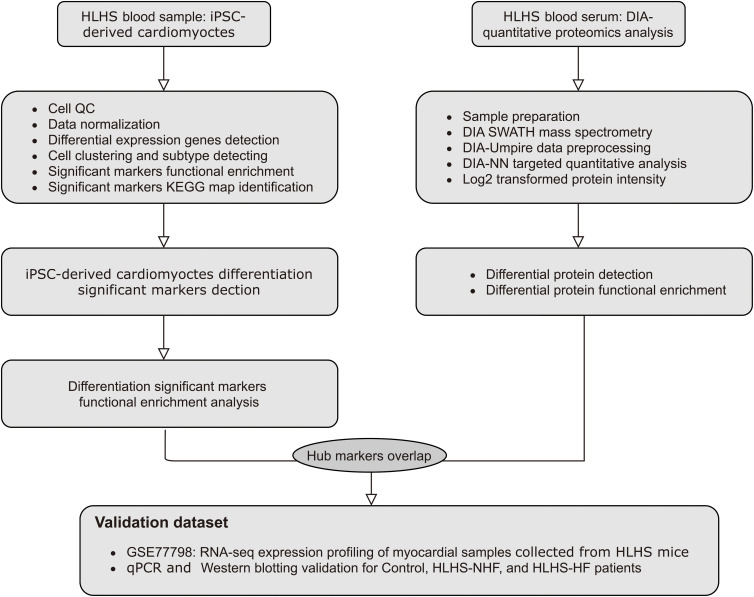
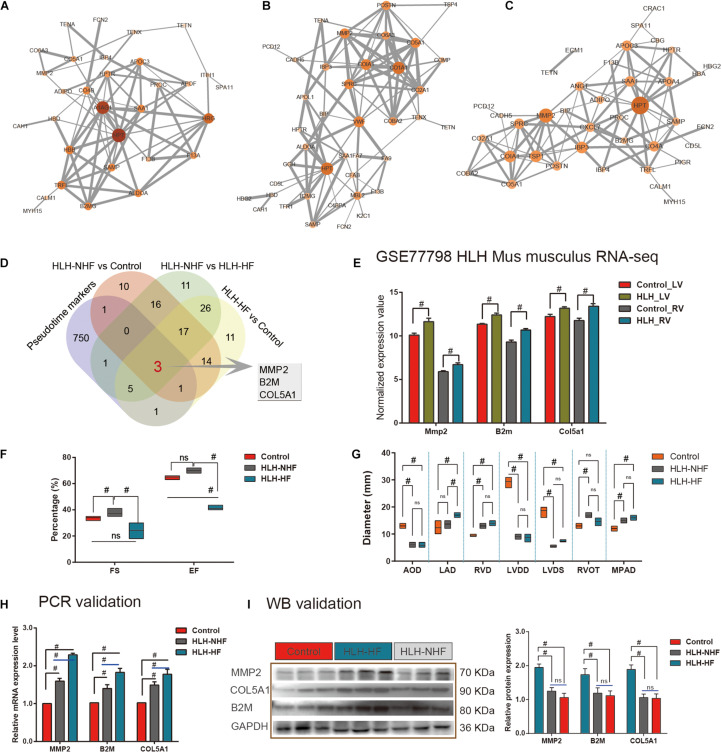
Methods: Following data preprocessing, scRNA-seq data of pluripotent stem cell (iPSC)-derived cardiomyocytes from one HLH patient and one control were analyzed by the Seurat package in R. Cell clusters were characterized, which was followed by a pseudotime analysis. Markers in the pseudotime analysis were utilized for functional enrichment analysis. Quantitative proteomics analysis was based on peripheral blood samples from HLH patients without heart failure (HLH-NHF), HLH patients with heart failure (HLH-HF), and healthy controls. Hub genes were identified by the intersection of pseudotime markers and differentially expressed proteins (DE-proteins), which were validated in the GSE77798 dataset, RT-qPCR, and western blot.
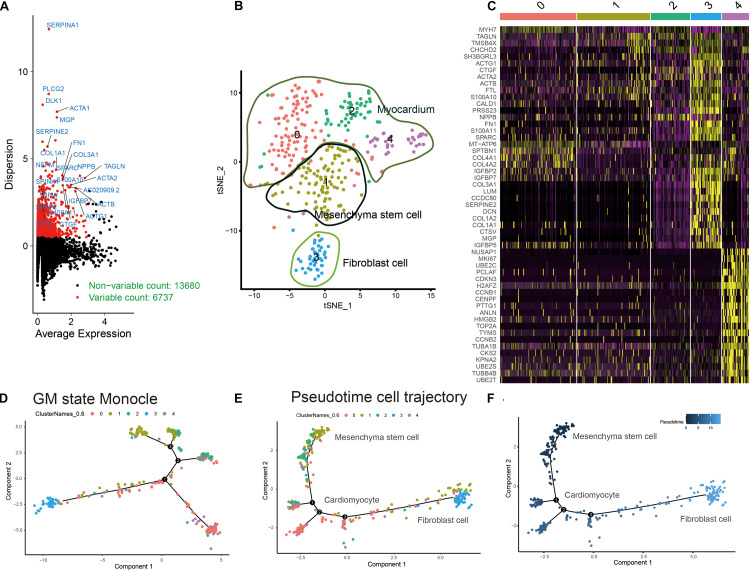
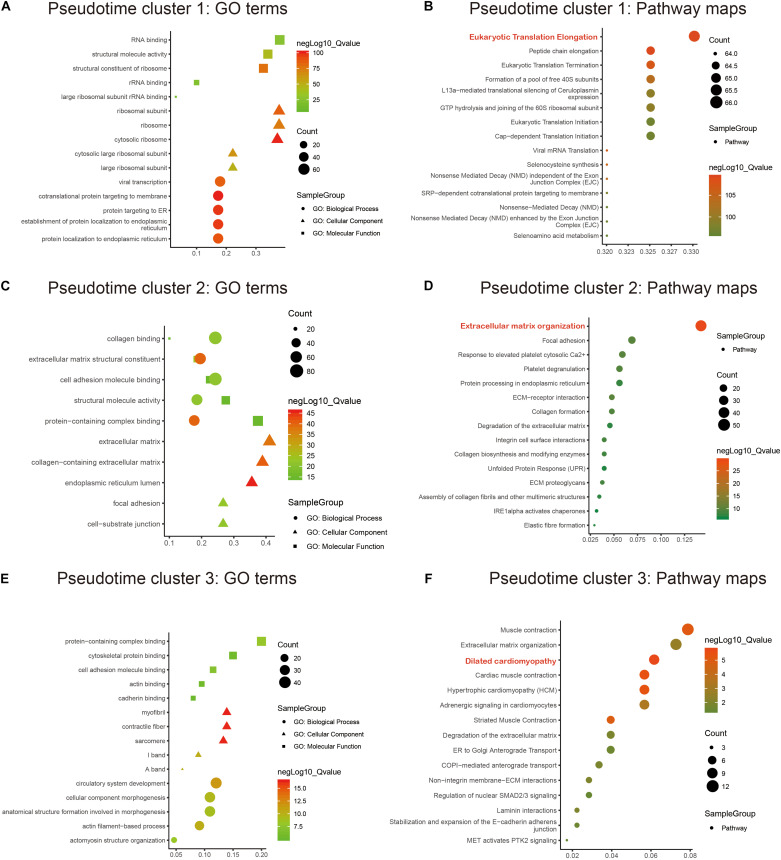
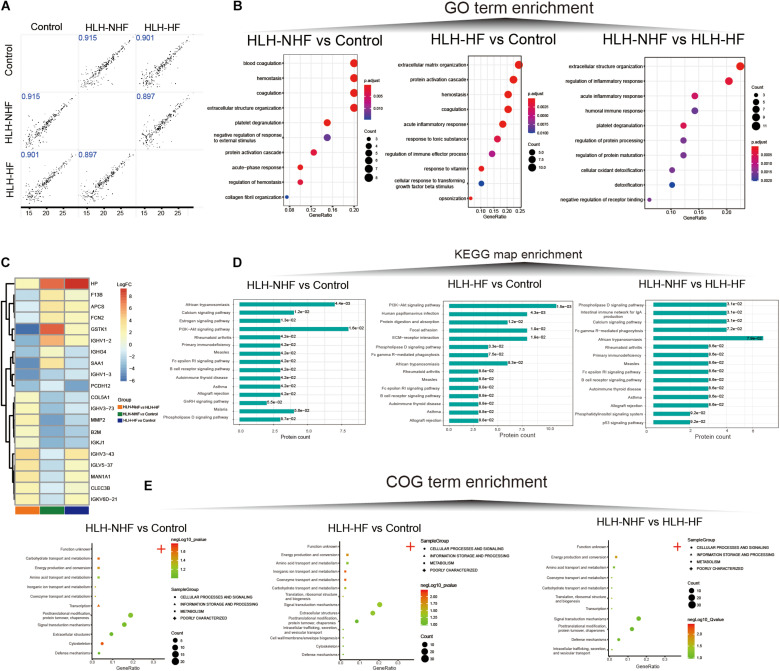
Results: Cardiomyocytes derived from iPSCs were clustered into mesenchymal stem cells, myocardium, and fibroblast cells. Pseudotime analysis revealed their differentiation trajectory. Markers in the three pseudotime clusters were significantly associated with distinct biological processes and pathways. Finally, three hub genes (MMP2, B2M, and COL5A1) were identified, which were highly expressed in the left (LV) and right (RV) ventricles of HLH patients compared with controls. Furthermore, higher expression levels were detected in HLH patients with or without HF than in controls.
Conclusion: Our findings elucidate marker genes and molecular mechanisms of HLH, deepening the understanding of the pathogenesis of HLH.
Keywords: cardiac development; heart failure; hub genes; hypoplastic left heart; quantitative proteomics analysis; single-cell RNA sequencing.
Copyright © 2021 Ma, Zhou, Zou, Shi, Luo, Du, Zhong, Zhao, Chen, Xia and Wu.
Conflict of interest statement
The authors declare that the research was conducted in the absence of any commercial or financial relationships that could be construed as a potential conflict of interest.
Figures
Similar articles
-
Exploration and validation of hub genes and pathways in the progression of hypoplastic left heart syndrome via weighted gene co-expression network analysis.BMC Cardiovasc Disord. 2021 Jun 15;21(1):300. doi: 10.1186/s12872-021-02108-0. BMC Cardiovasc Disord. 2021. PMID: 34130651 Free PMC article.
-
Gpx3 and Egr1 Are Involved in Regulating the Differentiation Fate of Cardiac Fibroblasts under Pressure Overload.Oxid Med Cell Longev. 2022 Jun 28;2022:3235250. doi: 10.1155/2022/3235250. eCollection 2022. Oxid Med Cell Longev. 2022. PMID: 35799890 Free PMC article.
-
Single-Cell Transcriptomics of Engineered Cardiac Tissues From Patient-Specific Induced Pluripotent Stem Cell-Derived Cardiomyocytes Reveals Abnormal Developmental Trajectory and Intrinsic Contractile Defects in Hypoplastic Right Heart Syndrome.J Am Heart Assoc. 2020 Oct 20;9(20):e016528. doi: 10.1161/JAHA.120.016528. Epub 2020 Oct 16. J Am Heart Assoc. 2020. PMID: 33059525 Free PMC article.
-
Regenerative Medicine Strategies for Hypoplastic Left Heart Syndrome.Tissue Eng Part B Rev. 2016 Dec;22(6):459-469. doi: 10.1089/ten.TEB.2016.0136. Epub 2016 Jun 28. Tissue Eng Part B Rev. 2016. PMID: 27245633 Review.
-
Single-Cell RNA Sequencing of the Adult Mammalian Heart-State-of-the-Art and Future Perspectives.Curr Heart Fail Rep. 2021 Apr;18(2):64-70. doi: 10.1007/s11897-021-00504-3. Epub 2021 Feb 25. Curr Heart Fail Rep. 2021. PMID: 33629280 Free PMC article. Review.
Cited by
-
Cellular Landscape of Synovial Chondromatosis Synovium Revealed by Single-Cell RNA Sequencing.FASEB J. 2025 Jul 15;39(13):e70799. doi: 10.1096/fj.202500034RR. FASEB J. 2025. PMID: 40600952 Free PMC article.
-
Trajectory Inference for Single Cell Omics.ArXiv [Preprint]. 2025 Feb 13:arXiv:2502.09354v1. ArXiv. 2025. PMID: 39990800 Free PMC article. Preprint.
-
Resident Fibroblast MKL1 Is Sufficient to Drive Pro-fibrogenic Response in Mice.Front Cell Dev Biol. 2022 Feb 1;9:812748. doi: 10.3389/fcell.2021.812748. eCollection 2021. Front Cell Dev Biol. 2022. PMID: 35178401 Free PMC article.
-
Single-Cell RNA Sequencing and Combinatorial Approaches for Understanding Heart Biology and Disease.Biology (Basel). 2024 Sep 30;13(10):783. doi: 10.3390/biology13100783. Biology (Basel). 2024. PMID: 39452092 Free PMC article. Review.
References
-
- Alphonso N., Angelini A., Barron D. J., Bellsham-Revell H., Blom N. A., Brown K., et al. (2020). Guidelines for the management of neonates and infants with hypoplastic left heart syndrome: The European Association for Cardio-Thoracic Surgery (EACTS) and the Association for European Paediatric and Congenital Cardiology (AEPC) Hypoplastic Left Heart Syndrome Guidelines Task Force. Eur. J. Cardiothorac. Surg. 58 416–499. 10.1093/ejcts/ezaa188 - DOI - PubMed
-
- Andreasová T., Vránová J. A.-O., Vondráková D., Sedláčková L., Zákostelská Z. J., Neužil P., et al. (2020). Role of biomarkers of cardiac remodeling, myofibrosis, and inflammation in assessment of disease severity in euvolemic patients with chronic stable heart failure. J. Int. Med. Res. 48:300060520947869. 10.1177/0300060520947869 - DOI - PMC - PubMed
LinkOut - more resources
Full Text Sources
Other Literature Sources
Research Materials
Miscellaneous