The Chromatin Remodeling Protein BRG1 Regulates SREBP Maturation by Activating SCAP Transcription in Hepatocytes
- PMID: 33718362
- PMCID: PMC7947303
- DOI: 10.3389/fcell.2021.622866
The Chromatin Remodeling Protein BRG1 Regulates SREBP Maturation by Activating SCAP Transcription in Hepatocytes
Abstract
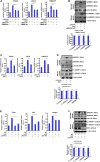
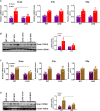
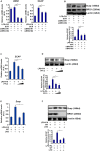
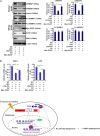
Sterol response element binding protein (SREBP) is a master regulator of cellular lipogenesis. One key step in the regulation of SREBP activity is its sequential cleavage and trans-location by several different proteinases including SREBP cleavage activating protein (SCAP). We have previously reported that Brahma related gene 1 (BRG1) directly interacts with SREBP1c and SREBP2 to activate pro-lipogenic transcription in hepatocytes. We report here that BRG1 deficiency resulted in reduced processing and nuclear accumulation of SREBP in the murine livers in two different models of non-alcoholic steatohepatitis (NASH). Exposure of hepatocytes to lipopolysaccharide (LPS) and palmitate (PA) promoted SREBP accumulation in the nucleus whereas BRG1 knockdown or inhibition blocked SREBP maturation. Further analysis revealed that BRG1 played an essential role in the regulation of SCAP expression. Mechanistically, BRG1 interacted with Sp1 and directly bound to the SCAP promoter to activate SCAP transcription. Forced expression of exogenous SCAP partially rescued the deficiency in the expression of SREBP target genes in BRG1-null hepatocytes. In conclusion, our data uncover a novel mechanism by which BRG1 contributes to SREBP-dependent lipid metabolism.
Keywords: chromatin remodeling protein; hepatocyte; lipid metabolism; steatosis; transcription factor; transcriptional regulation.
Copyright © 2021 Kong, Zhu, Shao, Fan and Xu.
Conflict of interest statement
The authors declare that the research was conducted in the absence of any commercial or financial relationships that could be construed as a potential conflict of interest.
Figures


Similar articles
-
Brg1 regulates pro-lipogenic transcription by modulating SREBP activity in hepatocytes.Biochim Biophys Acta Mol Basis Dis. 2018 Sep;1864(9 Pt B):2881-2889. doi: 10.1016/j.bbadis.2018.05.022. Epub 2018 May 30. Biochim Biophys Acta Mol Basis Dis. 2018. PMID: 29857051
-
Brahma Related Gene 1 (Brg1) Regulates Cellular Cholesterol Synthesis by Acting as a Co-factor for SREBP2.Front Cell Dev Biol. 2020 May 15;8:259. doi: 10.3389/fcell.2020.00259. eCollection 2020. Front Cell Dev Biol. 2020. PMID: 32500071 Free PMC article.
-
Hepatocyte-specific deletion of Brg1 alleviates methionine-and-choline-deficient diet (MCD) induced non-alcoholic steatohepatitis in mice.Biochem Biophys Res Commun. 2018 Sep 3;503(1):344-351. doi: 10.1016/j.bbrc.2018.06.027. Epub 2018 Jun 19. Biochem Biophys Res Commun. 2018. PMID: 29890136
-
The Role of SCAP/SREBP as Central Regulators of Lipid Metabolism in Hepatic Steatosis.Int J Mol Sci. 2024 Jan 16;25(2):1109. doi: 10.3390/ijms25021109. Int J Mol Sci. 2024. PMID: 38256181 Free PMC article. Review.
-
Maintaining cholesterol homeostasis: sterol regulatory element-binding proteins.World J Gastroenterol. 2004 Nov 1;10(21):3081-7. doi: 10.3748/wjg.v10.i21.3081. World J Gastroenterol. 2004. PMID: 15457548 Free PMC article. Review.
Cited by
-
Stress mechanism involved in the progression of alcoholic liver disease and the therapeutic efficacy of nanoparticles.Front Immunol. 2023 Sep 29;14:1205821. doi: 10.3389/fimmu.2023.1205821. eCollection 2023. Front Immunol. 2023. PMID: 37841267 Free PMC article. Review.
-
A GSK3-SRF Axis Mediates Angiotensin II Induced Endothelin Transcription in Vascular Endothelial Cells.Front Cell Dev Biol. 2021 Jul 26;9:698254. doi: 10.3389/fcell.2021.698254. eCollection 2021. Front Cell Dev Biol. 2021. PMID: 34381779 Free PMC article.
-
Neurotrophins as Key Regulators of Cell Metabolism: Implications for Cholesterol Homeostasis.Int J Mol Sci. 2021 May 26;22(11):5692. doi: 10.3390/ijms22115692. Int J Mol Sci. 2021. PMID: 34073639 Free PMC article. Review.
-
An E2F5-TFDP1-BRG1 Complex Mediates Transcriptional Activation of MYCN in Hepatocytes.Front Cell Dev Biol. 2021 Oct 22;9:742319. doi: 10.3389/fcell.2021.742319. eCollection 2021. Front Cell Dev Biol. 2021. PMID: 34746136 Free PMC article.
-
HES5-mediated repression of LIGHT transcription may contribute to apoptosis in hepatocytes.Cell Death Discov. 2021 Oct 23;7(1):308. doi: 10.1038/s41420-021-00707-6. Cell Death Discov. 2021. PMID: 34689159 Free PMC article.
References
-
- Amemiya-Kudo M., Shimano H., Yoshikawa T., Yahagi N., Hasty A. H., Okazaki H., et al. (2000). Promoter analysis of the mouse sterol regulatory element-binding protein-1c gene. J. Biol. Chem. 275 31078–31085. - PubMed
-
- Banerjee R., Bultman S. J., Holley D., Hillhouse C., Bain J. R., Newgard C. B., et al. (2015). Non-targeted metabolomics of Brg1/Brm double-mutant cardiomyocytes reveals a novel role for SWI/SNF complexes in metabolic homeostasis. Metabolomics 11 1287–1301. 10.1007/s11306-015-0786-7 - DOI - PMC - PubMed
LinkOut - more resources
Full Text Sources
Other Literature Sources
Molecular Biology Databases
Miscellaneous

