. 2021 Feb 26:9:631982.
doi: 10.3389/fcell.2021.631982. eCollection 2021.

Integrated Protein-Protein Interaction and Weighted Gene Co-expression Network Analysis Uncover Three Key Genes in Hepatoblastoma

Affiliations

Integrated Protein-Protein Interaction and Weighted Gene Co-expression Network Analysis Uncover Three Key Genes in Hepatoblastoma

Linlin Tian et al. Front Cell Dev Biol. .

Abstract

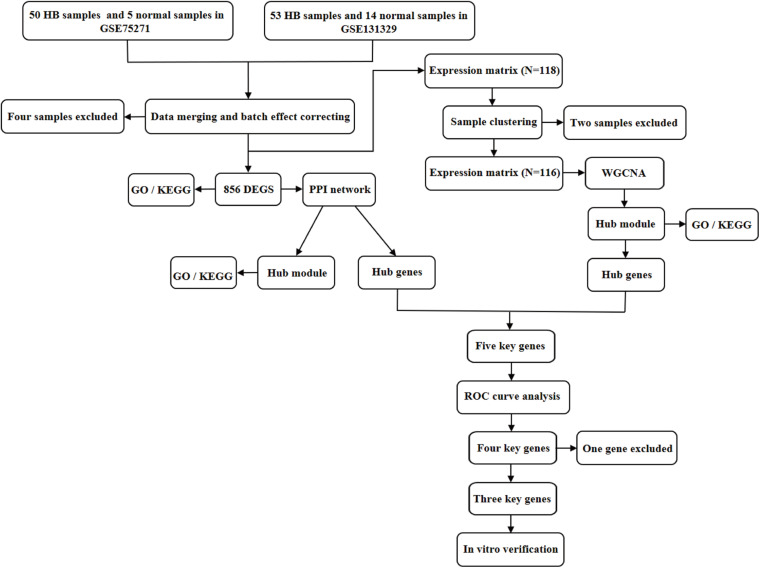
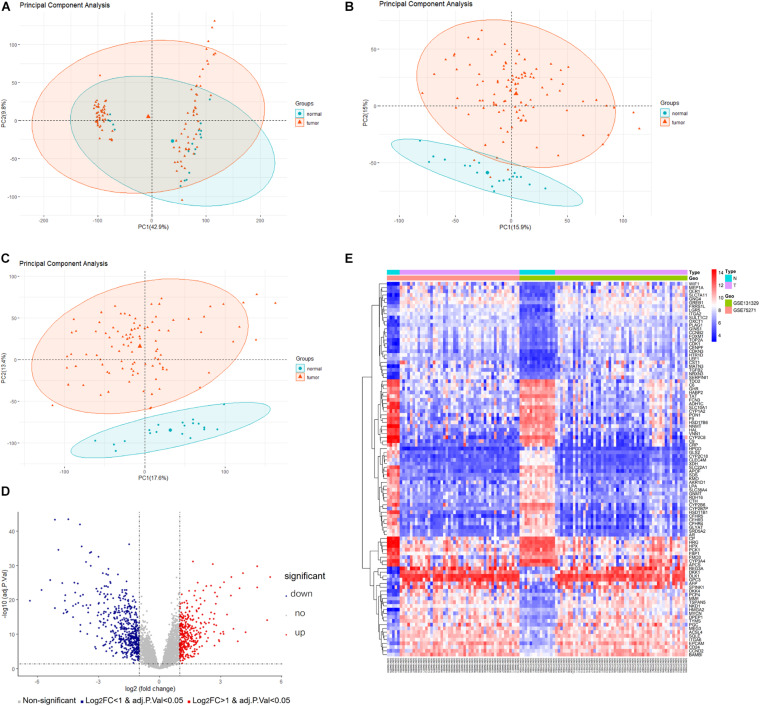
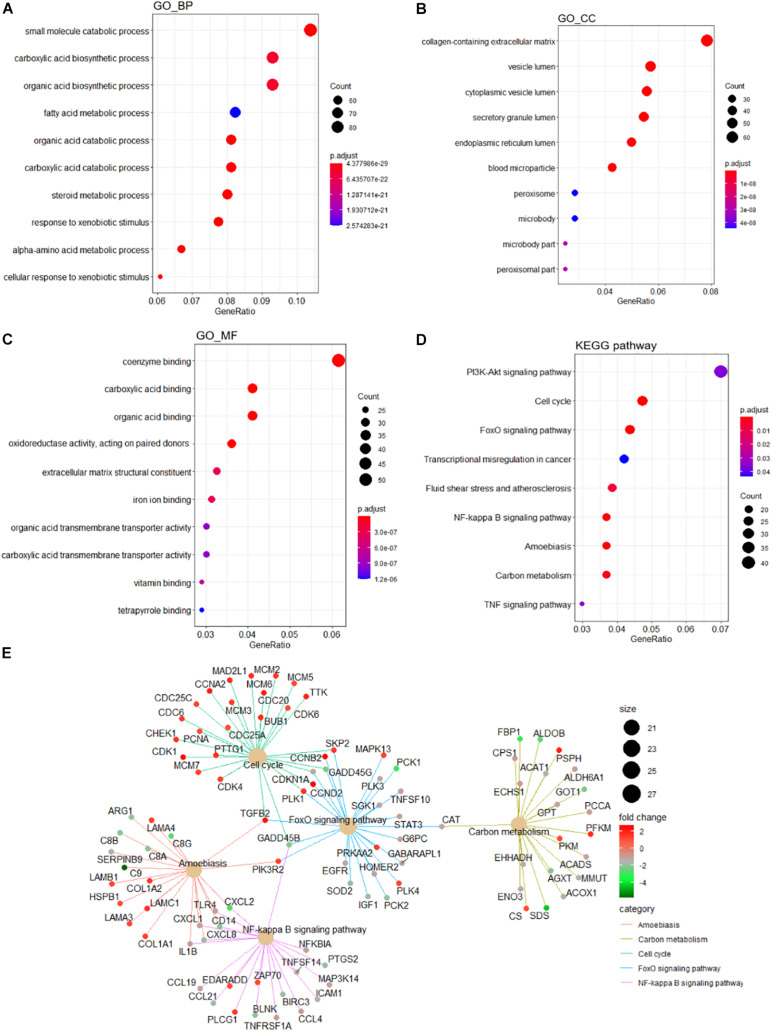
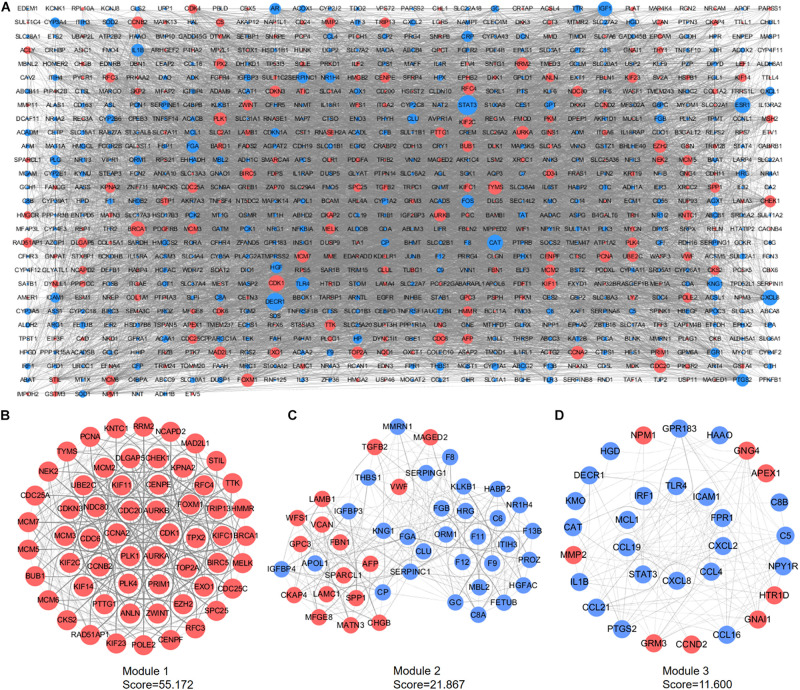
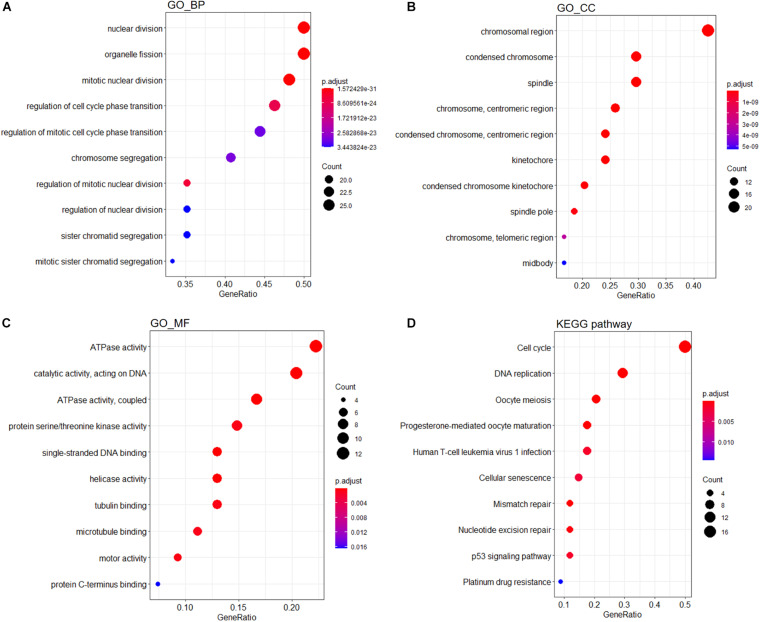
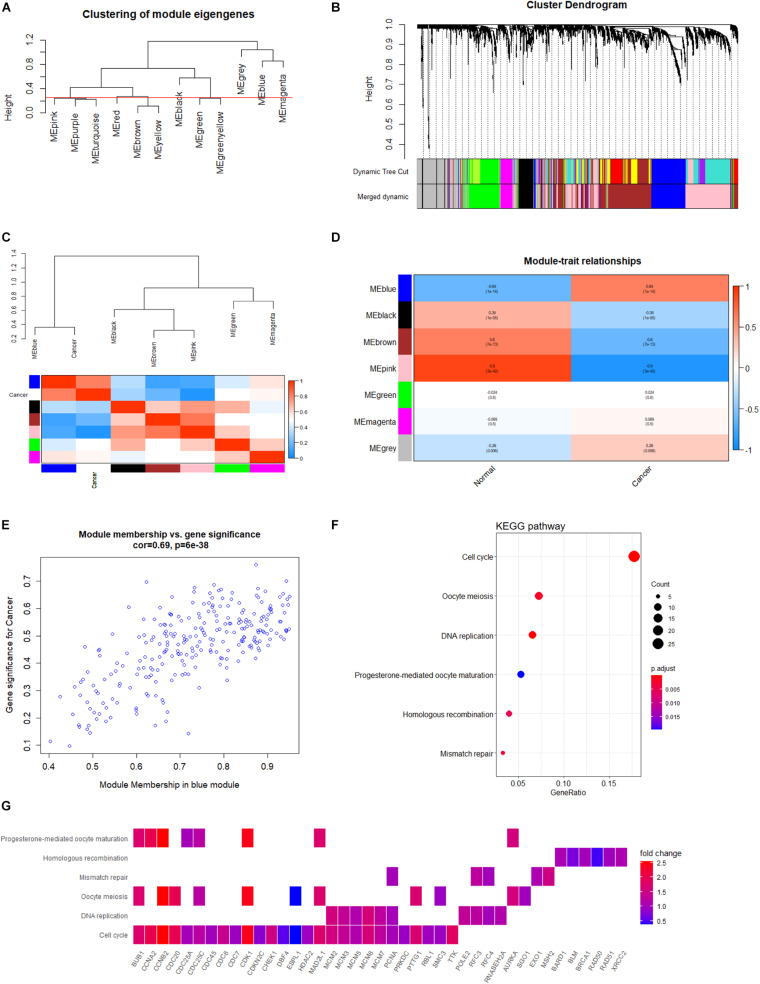
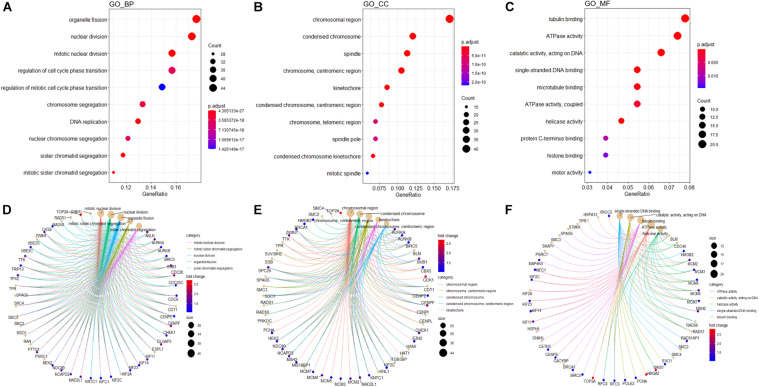
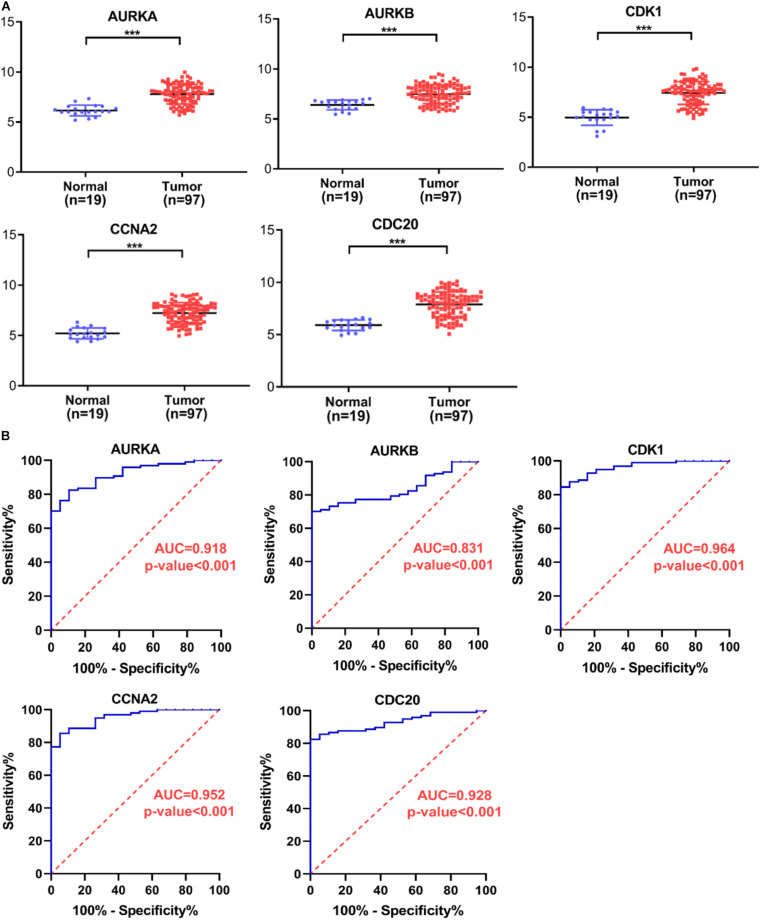
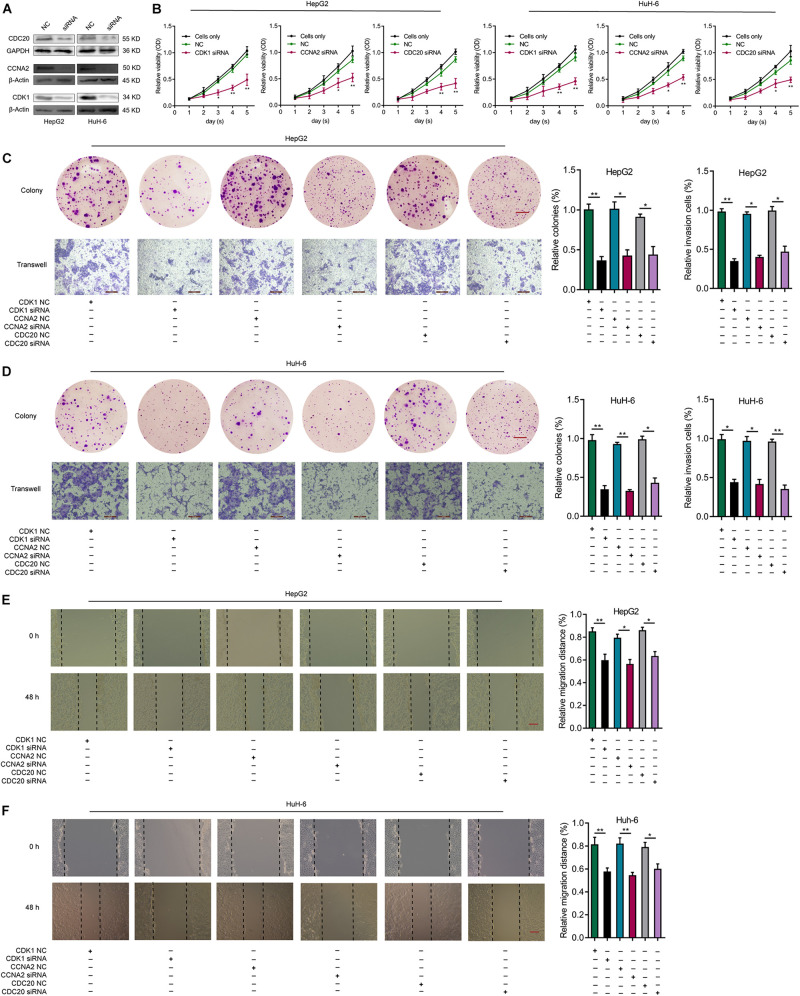
Hepatoblastoma (HB) is the most common liver tumor in the pediatric population, with typically poor outcomes for advanced-stage or chemotherapy-refractory HB patients. The objective of this study was to identify genes involved in HB pathogenesis via microarray analysis and subsequent experimental validation. We identified 856 differentially expressed genes (DEGs) between HB and normal liver tissue based on two publicly available microarray datasets (GSE131329 and GSE75271) after data merging and batch effect correction. Protein-protein interaction (PPI) analysis and weighted gene co-expression network analysis (WGCNA) were conducted to explore HB-related critical modules and hub genes. Subsequently, Gene Ontology (GO) analysis was used to reveal critical biological functions in the initiation and progression of HB. Kyoto Encyclopedia of Genes and Genomes (KEGG) analysis showed that genes involved in cell cycle phase transition and the PI3K/AKT signaling were associated with HB. The intersection of hub genes identified by both PPI and WGCNA analyses revealed five potential candidate genes. Based on receiver operating characteristic (ROC) curve analysis and reports in the literature, we selected CCNA2, CDK1, and CDC20 as key genes of interest to validate experimentally. CCNA2, CDK1, or CDC20 small interfering RNA (siRNA) knockdown inhibited aggressive biological properties of both HepG2 and HuH-6 cell lines in vitro. In conclusion, we identified CCNA2, CDK1, and CDC20 as new potential therapeutic biomarkers for HB, providing novel insights into important and viable targets in future HB treatment.

Keywords: CCNA2; CDC20; CDK1; PPI; WGCNA; hepatoblastoma.


Conflict of interest statement

The authors declare that the research was conducted in the absence of any commercial or financial relationships that could be construed as a potential conflict of interest.

Figures

FIGURE 1
FIGURE 1
Flowchart illustrating the study design. DEGs, differentially expressed genes; GO, Gene Ontology; KEGG, Kyoto Encyclopedia of Genes and Genomes; PPI, protein–protein interaction; WGCNA, weighted gene co-expression network analysis; ROC, receiver operating characteristic.
FIGURE 2
FIGURE 2
Data preprocessing and DEG analysis of the GSE75271 and GSE131329 datasets. Principal component analysis indicating the overall profiles of two datasets (A) before and (B) after batch effect correction and data merging. (C) Principal component analysis after removal of outlier samples. (D) Volcano plots visualizing DEGs between HB and normal liver tissue samples from the two datasets. Red points represent up-regulation, while blue points indicate down-regulation; gray points represent normal expression. (E) Heatmap of the top 50 up-regulated and top 50 down-regulated DEGs with P value <0.05 and logFC > 1. Red points represent up-regulation; blue points indicate down-regulation. DEG, differentially expressed gene.
FIGURE 3
FIGURE 3
Functional enrichment analyses of the DEGs. GO analysis containing (A) BP terms, (B) CC terms, and (C) MF terms. (D) KEGG pathway analysis of the DEGs. (E) The cnetplot of KEGG pathways showing genes enriched in different pathways. The symbol adjacent to nodes represents the specific gene. The color bar represents the fold change of genes in the respective pathways. DEGs, differentially expressed gene; GO, Gene Ontology; KEGG, Kyoto Encyclopedia of Genes and Genomes; BP, biological process; CC, cellular component; MF, molecular function.
FIGURE 4
FIGURE 4
PPI network construction and module analyses. (A) PPI network of DEGs was constructed in Cytoscape. Red points represent up-regulated genes, while blue points represent down-regulated genes. The node size depends on the degree of node connectivity; edges indicate straight associations. (B) Module 1 contains 59 nodes and 1,600 edges. (C) Module 2 contains 46 nodes and 492 edges. (D) Module 3 includes 31 nodes and 174 edges. Red nodes represent up-regulated genes; blue nodes represent down-regulated genes. DEG, differentially expressed gene; PPI, protein–protein interaction.
FIGURE 5
FIGURE 5
Functional enrichment analyses of genes from module 1. GO analysis containing (A) BP, (B) CC, and (C) MF terms. (D) KEGG analysis of significantly enriched pathways of genes in module 1. GO, Gene Ontology; KEGG, Kyoto Encyclopedia of Genes and Genomes; BP, biological process; CC, cellular component; MF, molecular function.
FIGURE 6
FIGURE 6
Co-expression network analysis based on WGCNA. (A) Clustering of module eigengenes with a threshold of 0.25 height to identify similar modules. (B) Identification of HB-specific modules. Each branch represents an expression module of a highly interconnected groups of genes; each color indicates a corresponding co-expression module. (C) Heatmap of the eigengene network indicates correlations between different modules; tightly connected modules are clustered together. (D) Heatmap of associations among module eigengenes in normal liver and HB samples. (E) Scatter plots highlighting the association between GS and MM based on genes from the blue module. (F) KEGG analysis of significantly enriched pathways based on genes from blue module. (G) Heatmap of specific genes associated with each enriched key pathway. WGCNA, weighted gene co-expression network analysis; HB, hepatoblastoma; GS, gene significance; MM, module membership; KEGG, Kyoto Encyclopedia of Genes and Genomes.
FIGURE 7
FIGURE 7
GO analysis of genes from blue module. The significant GO BP (A), CC (B), and MF (C) terms after enrichment analysis of genes from the WGCNA blue module. Cnetplot indicating specific genes associated with enriched GO BP (D), CC (E), or MF (F) terms; the symbol adjacent to the node represents the specific gene. GO, Gene Ontology; BP, biological process; CC, cellular component; MF, molecular function.
FIGURE 8
FIGURE 8
Verification of hub gene expression levels and ROC curve analysis. (A) The expression levels of AURKA, AURKB, CDK1, CCNA2, and CDC20 mRNAs were markedly up-regulated in HB samples relative to normal liver samples. (B) ROC curve analysis of AURKA, AURKB, CDK1, CCNA2, and CDC20. ROC, receiver operating characteristic; AUC, area under the curve. ***P < 0.001.
FIGURE 9
FIGURE 9
Knockdown of CDK1, CCNA2, or CDC20 inhibits proliferative, migrative, and invasive capacities of HB cells in vitro. (A) WB analysis confirm the knockdown efficiency of CDK1, CCNA2, or CDC20 2 days after transfection with siRNAs for CDK1, CCNA2, or CDC20. (B) The CCK-8 assay illustrates the proliferative capacity of HB cells after siRNA transfection. After siRNA transfection of HepG2 (C) or HuH-6 (D) cells, the proliferative and invasive capacities of the respective cell lines were evaluated by colony formation assays (scale bars, 8 mm) and transwell invasion assays (scale bars, 200 μm), respectively. (E,F) Wound healing assay (scale bars, 500 μm) results that indicate the migrative capacities of HepG2 (E) or HuH-6 (F) cells after transfection with siRNA. *P < 0.05, **P < 0.01. ROC, receiver operating characteristic; HB, hepatoblastoma; WB, western blot; siRNAs, small interfering RNAs; CCK-8, Cell Counting Kit-8.

Similar articles

Cited by

References

    1. Aboubakr E. M., Taye A., Aly O. M., Gamal-Eldeen A. M., El-Moselhy M. A. (2017). Enhanced anticancer effect of combretastatin A-4 phosphate when combined with vincristine in the treatment of hepatocellular carcinoma. Biomed. Pharmacother. 89 36–46. 10.1016/j.biopha.2017.02.019 - DOI - PubMed
    1. Aghajanzadeh T., Tebbi K., Talkhabi M. (2020). Identification of potential key genes and miRNAs involved in hepatoblastoma pathogenesis and prognosis. J. Cell Commun. Signal. 14 1–12. 10.1007/s12079-020-00584-1 - DOI - PMC - PubMed
    1. Allan B., Parikh P., Diaz S., Perez E., Neville H., Sola J. (2013). Predictors of survival and incidence of hepatoblastoma in the paediatric population. HPB (Oxford) 15 741–746. 10.1111/hpb.12112 - DOI - PMC - PubMed
    1. Bandettini W. P., Kellman P., Mancini C., Booker O. J., Vasu S., Leung S. W., et al. (2012). MultiContrast delayed enhancement (MCODE) improves detection of subendocardial myocardial infarction by late gadolinium enhancement cardiovascular magnetic resonance: a clinical validation study. J. Cardiovasc. Magn. Reson. 14:83. 10.1186/1532-429X-14-83 - DOI - PMC - PubMed
    1. Bannon J. H., Mc Gee M. M. (2009). Understanding the role of aneuploidy in tumorigenesis. Biochem. Soc. Trans. 37 910–913. 10.1042/BST0370910 - DOI - PubMed

LinkOut - more resources