

Unsupervised Clustering Reveals Sarcoidosis Phenotypes Marked by a Reduction in Lymphocytes Relate to Increased Inflammatory Activity on 18FDG-PET/CT
- PMID: 33718397
- PMCID: PMC7943443
- DOI: 10.3389/fmed.2021.595077
Unsupervised Clustering Reveals Sarcoidosis Phenotypes Marked by a Reduction in Lymphocytes Relate to Increased Inflammatory Activity on 18FDG-PET/CT
Abstract
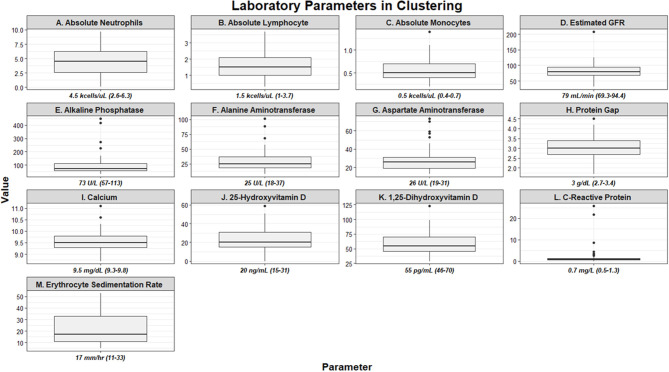
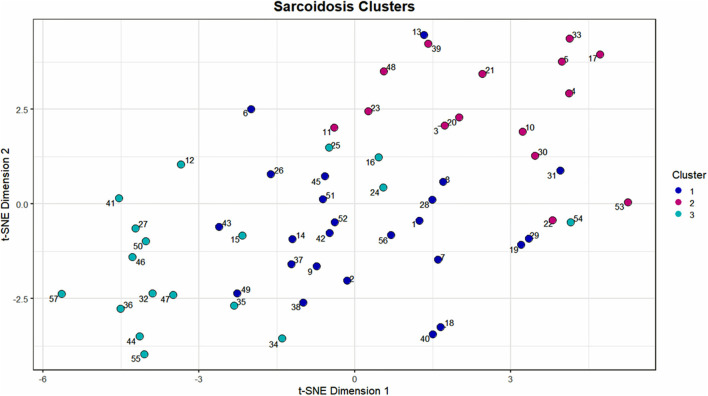
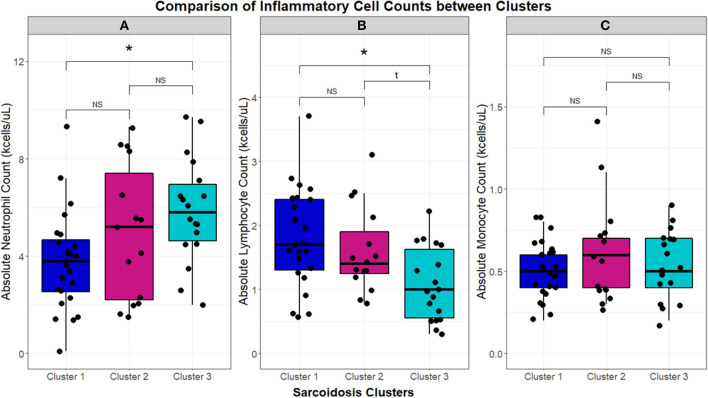
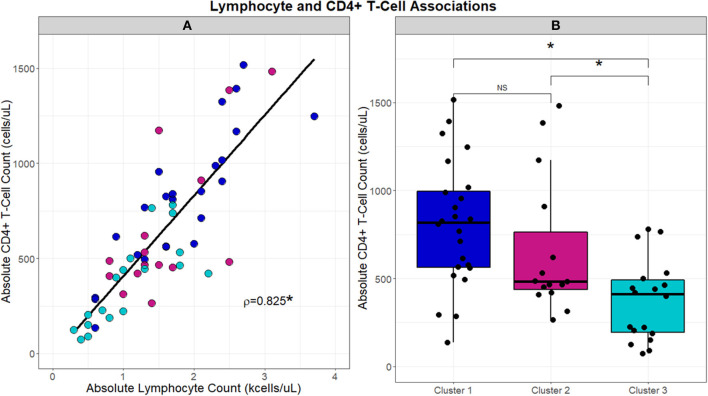
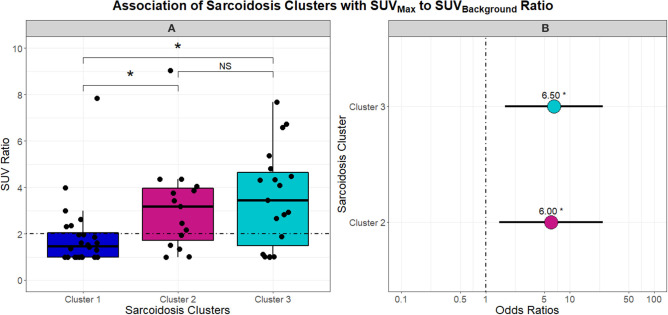
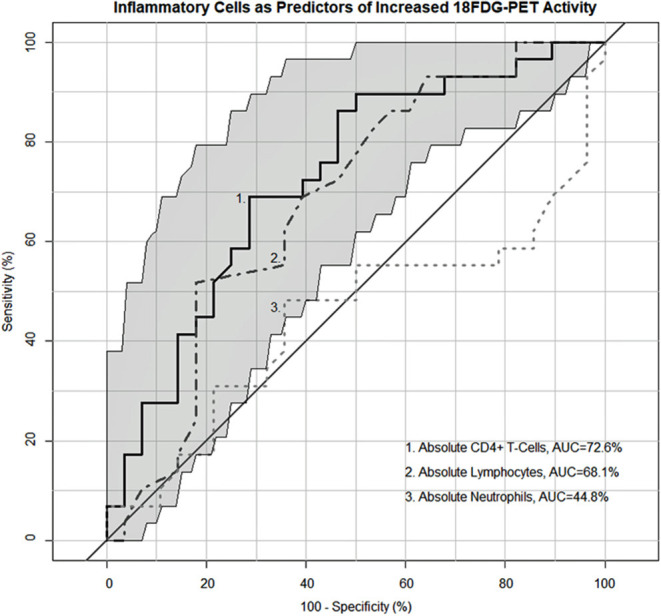
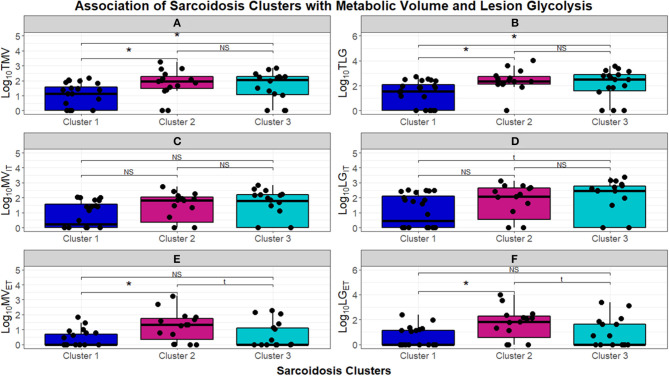
Introduction: Sarcoidosis is a T-helper cell mediated disease characterized by granulomatous inflammation. We posited that unsupervised clustering of various features in sarcoidosis would establish phenotypes associated with inflammatory activity measured by 18FDG-PET/CT. Our goal was to identify unique features capable of distinguishing clusters and subsequently examine the relationship with FDG avidity to substantiate their potential use as markers for sarcoidosis inflammation. Methods: We performed a retrospective study of a diverse, but primarily African American, cohort of 58 subjects with biopsy proven sarcoidosis followed at the University of Illinois Bernie Mac Sarcoidosis Center and Center for Lung Health who underwent 18FDG-PET/CT scan. Demographic, therapeutic, radiographic, and laboratory data were utilized in unsupervised cluster analysis to identify sarcoidosis phenotypes. The association between clusters, their defining features, and quantitative measurements on 18FDG-PET/CT was determined. The relevance of these features as markers of 18FDG-PET/CT inflammatory activity was also investigated. Results: Clustering determined three distinct phenotypes: (1) a predominantly African American cluster with chronic, quiescent disease, (2) a predominantly African American cluster with elevated conventional inflammatory markers, advanced pulmonary disease and extrathoracic involvement, and (3) a predominantly Caucasian cluster characterized by reduced lymphocyte counts and acute disease. In contrast to the chronic quiescent cluster, Clusters 2 and 3 were defined by significantly greater FDG avidity on 18FDG-PET/CT. Despite similarly increased inflammatory activity on 18FDG-PET/CT, Clusters 2, and 3 differed with regards to extrathoracic FDG avidity and circulating lymphocyte profiles, specifically CD4+ T-cells. Notably, absolute lymphocyte counts and CD4+ T-cell counts were found to predict 18FDG-PET/CT inflammatory activity by receiver operating curve analysis with a 69.2 and 73.42% area under the curve, respectively. Conclusions: Utilizing cluster analysis, three distinct phenotypes of sarcoidosis were identified with significant variation in race, disease chronicity, and serologic markers of inflammation. These phenotypes displayed varying levels of circulating inflammatory cells. Additionally, reduction in lymphocytes, specifically CD4+ T-cells, was significantly related to activity on 18FDG-PET/CT. Though future studies are warranted, these findings suggest that peripheral lymphocyte counts may be considered a determinant of sarcoidosis phenotypes and an indicator of active inflammation on 18FDG-PET/CT.
Keywords: 18FDG-PET/CT; cluster analysis; immunopathogenesis; lymphopenia; phenotype; sarcoidosis.
Copyright © 2021 Vagts, Ascoli, Fraidenburg, Baughman, Huang, Edafetanure-Ibeh, Ahmed, Levin, Lu, Perkins, Finn and Sweiss.
Conflict of interest statement
The authors declare that the research was conducted in the absence of any commercial or financial relationships that could be construed as a potential conflict of interest.
Figures
Similar articles
-
Diagnostic utility of 68Ga-citrate and 18FDG PET/CT in sarcoidosis patients.Monaldi Arch Chest Dis. 2020 Dec 23;90(4). doi: 10.4081/monaldi.2020.1509. Monaldi Arch Chest Dis. 2020. PMID: 33372740
-
Significant CD4, CD8, and CD19 lymphopenia in peripheral blood of sarcoidosis patients correlates with severe disease manifestations.PLoS One. 2010 Feb 5;5(2):e9088. doi: 10.1371/journal.pone.0009088. PLoS One. 2010. PMID: 20140091 Free PMC article.
-
Angiotensin-converting Enzyme as a Predictor of Extrathoracic Involvement of Sarcoidosis.Sarcoidosis Vasc Diffuse Lung Dis. 2016 Jan 18;32(4):318-24. Sarcoidosis Vasc Diffuse Lung Dis. 2016. PMID: 26847099
-
Functional imaging in extrapulmonary sarcoidosis: FDG-PET/CT and MR features.Clin Nucl Med. 2014 Feb;39(2):e146-59. doi: 10.1097/RLU.0b013e318279f264. Clin Nucl Med. 2014. PMID: 23579973 Review.
-
FDG PET imaging in sarcoidosis.Semin Nucl Med. 2013 Nov;43(6):404-11. doi: 10.1053/j.semnuclmed.2013.06.007. Semin Nucl Med. 2013. PMID: 24094707 Review.
Cited by
-
Altered transcription factor targeting is associated with differential peripheral blood mononuclear cell proportions in sarcoidosis.Front Immunol. 2022 Oct 13;13:848759. doi: 10.3389/fimmu.2022.848759. eCollection 2022. Front Immunol. 2022. PMID: 36311769 Free PMC article.
-
Associations of peripheral blood lymphopenia to disease course, treatment and TNF-α in sarcoidosis.Respir Res. 2025 Apr 9;26(1):130. doi: 10.1186/s12931-025-03212-x. Respir Res. 2025. PMID: 40205574 Free PMC article.
-
Radiological predictive remission factors of pulmonary involvement in systemic sarcoidosis: a computed tomography scan study.Sarcoidosis Vasc Diffuse Lung Dis. 2023 Dec 20;40(4):e2023053. doi: 10.36141/svdld.v40i4.15118. Sarcoidosis Vasc Diffuse Lung Dis. 2023. PMID: 38126498 Free PMC article.
-
Risk Indicators of Sarcoidosis Evolution-Unified Protocol (RISE-UP): protocol for a multi-centre, longitudinal, observational study to identify clinical features that are predictive of sarcoidosis progression.BMJ Open. 2023 Apr 3;13(4):e071607. doi: 10.1136/bmjopen-2023-071607. BMJ Open. 2023. PMID: 37012011 Free PMC article.
-
Trimer IgG and neutralising antibody response to COVID-19 mRNA vaccination in individuals with sarcoidosis.ERJ Open Res. 2023 Jan 3;9(1):00025-2022. doi: 10.1183/23120541.00025-2022. eCollection 2023 Jan. ERJ Open Res. 2023. PMID: 36601311 Free PMC article.
References
Grants and funding
LinkOut - more resources
Full Text Sources
Other Literature Sources
Research Materials