

Oesophageal pressure as a surrogate of pleural pressure in mechanically ventilated patients
- PMID: 33718491
- PMCID: PMC7938048
- DOI: 10.1183/23120541.00646-2020
Oesophageal pressure as a surrogate of pleural pressure in mechanically ventilated patients
Abstract
Background: Oesophageal pressure (P oes) is used to approximate pleural pressure (P pl) and therefore to estimate transpulmonary pressure (P L). We aimed to compare oesophageal and regional pleural pressures and to calculate transpulmonary pressures in a prospective physiological study on lung transplant recipients during their stay in the intensive care unit of a tertiary university hospital.
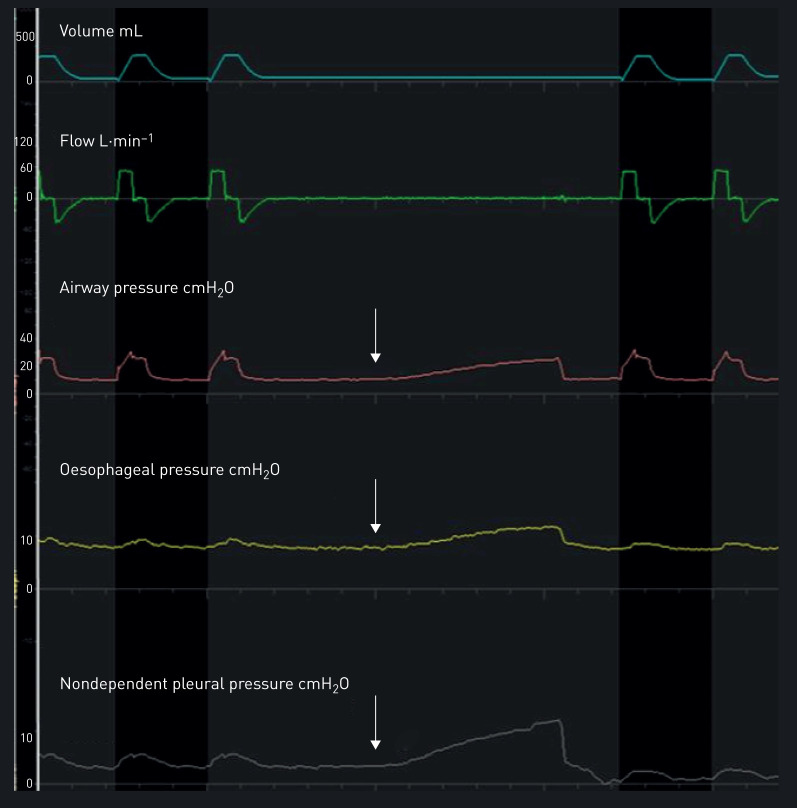
Methods: Lung transplant recipients receiving invasive mechanical ventilation and monitored by oesophageal manometry and dependent and nondependent pleural catheters were investigated during the post-operative period. We performed simultaneous short-time measurements and recordings of oesophageal manometry and pleural pressures. Expiratory and inspiratory P L were computed by subtracting regional P pl or P oes from airway pressure; inspiratory P L was also calculated with the elastance ratio method.
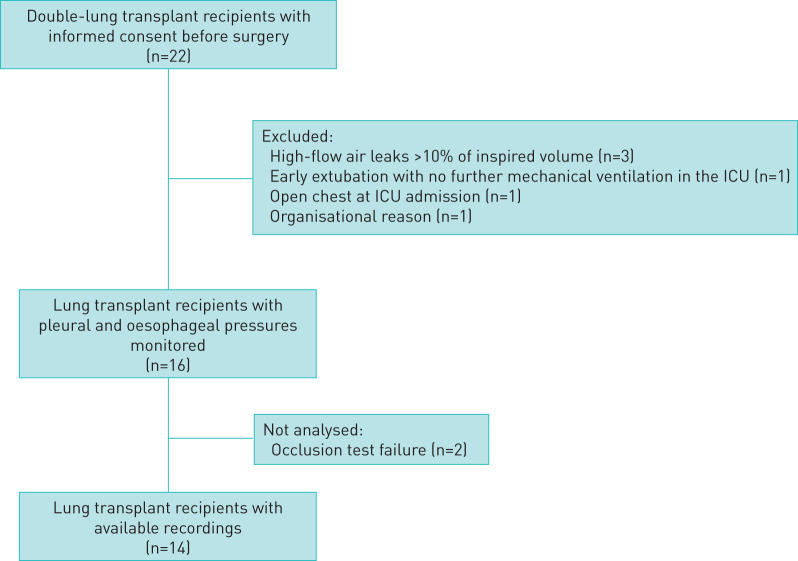
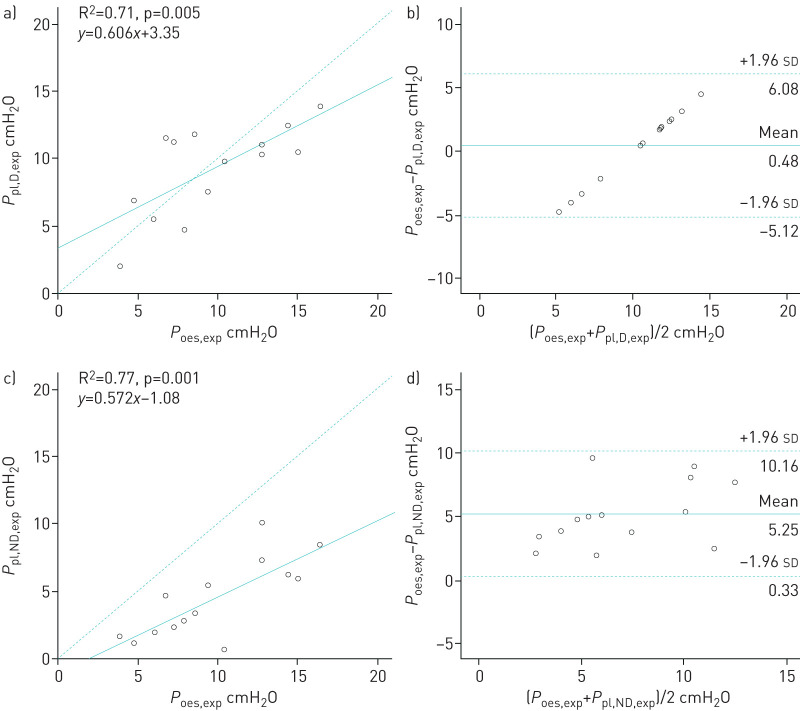
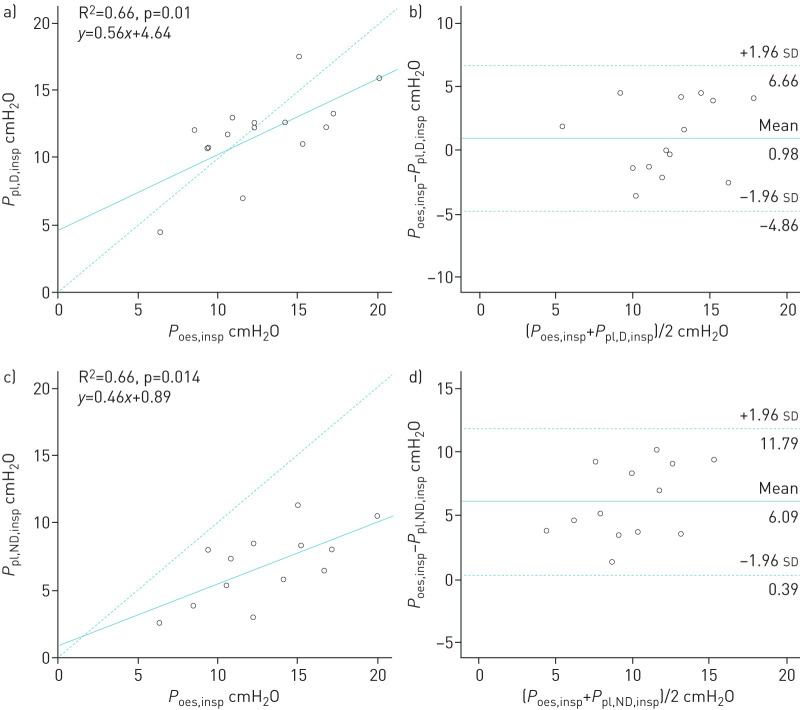
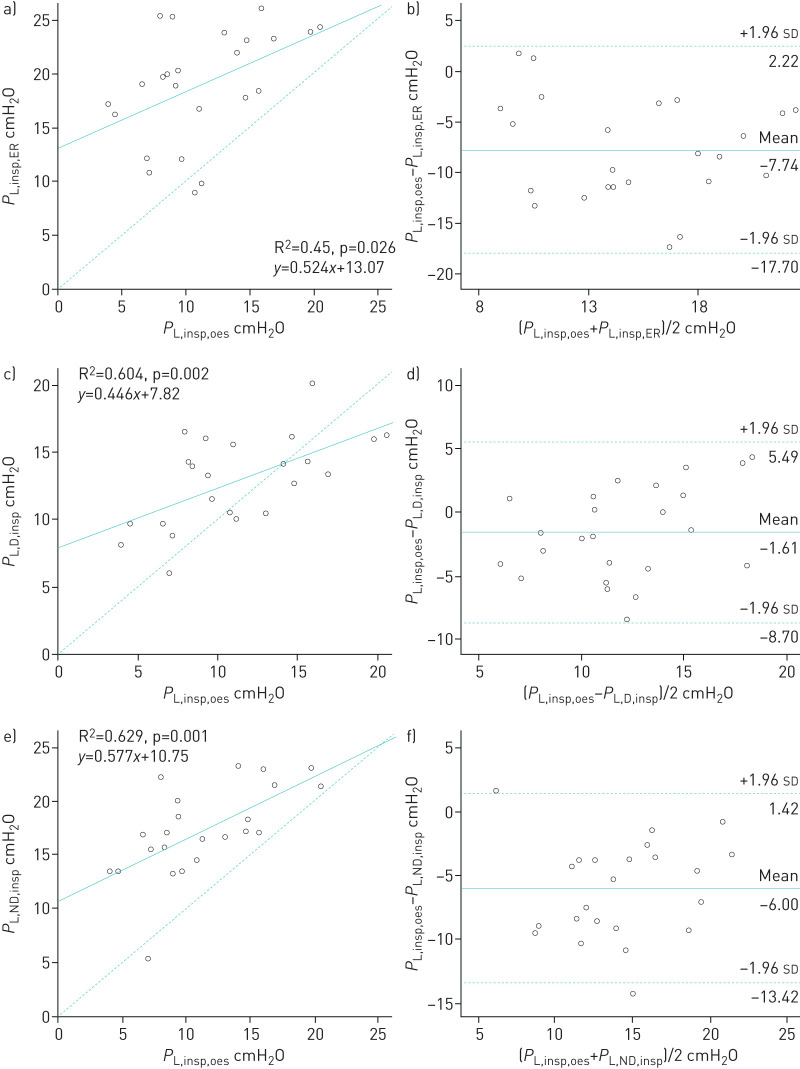
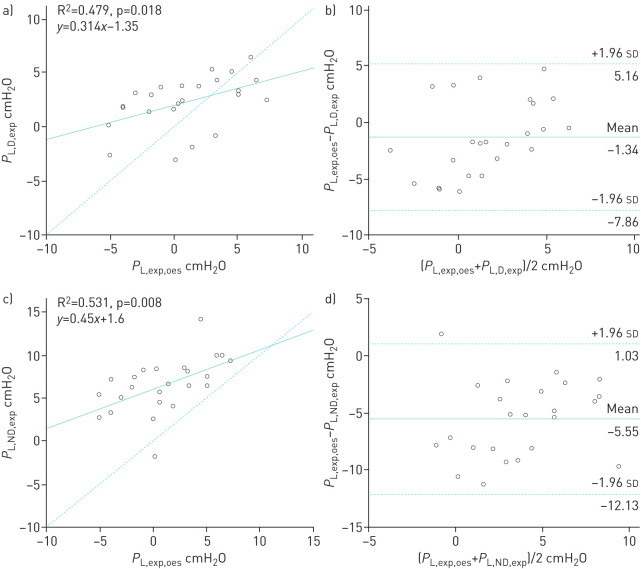
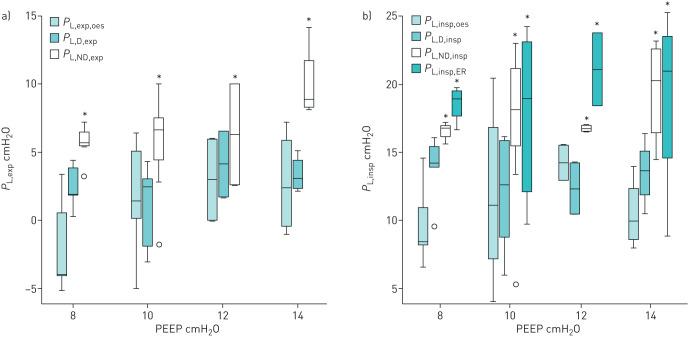
Results: 16 patients were included. Among them, 14 were analysed. Oesophageal pressures correlated with dependent and nondependent pleural pressures during expiration (R2=0.71, p=0.005 and R2=0.77, p=0.001, respectively) and during inspiration (R2=0.66 for both, p=0.01 and p=0.014, respectively). P L values calculated using P oes were close to those obtained from the dependent pleural catheter but higher than those obtained from the nondependent pleural catheter both during expiration and inspiration.
Conclusions: In ventilated lung transplant recipients, oesophageal manometry is well correlated with pleural pressure. The absolute value of P oes is higher than P pl of nondependent lung regions and could therefore underestimate the highest level of lung stress in those at high risk of overinflation.
Copyright ©ERS 2021.
Conflict of interest statement
Conflict of interest: A. Tilmont has nothing to disclose. Conflict of interest: B. Coiffard has nothing to disclose. Conflict of interest: T. Yoshida has nothing to disclose. Conflict of interest: F. Daviet has nothing to disclose. Conflict of interest: K. Baumstarck has nothing to disclose. Conflict of interest: G. Brioude has nothing to disclose. Conflict of interest: S. Hraiech has nothing to disclose. Conflict of interest: J-M. Forel has nothing to disclose. Conflict of interest: A. Roch has nothing to disclose. Conflict of interest: L. Brochard reports grants from Medtronic Covidien, grants and nonfinancial support from Fisher Paykel, nonfinancial support from Sentec, Philips and Air Liquide, and other support from General Electric, outside the submitted work. Conflict of interest: L. Papazian reports grants and personal fees from Air Liquid, personal fees from Faron, grants from SEDANA and personal fees from MSD, outside the submitted work. Conflict of interest: C. Guervilly reports personal fees from Xenios Fresenus Medical Care and MSD outside the submitted work.
Figures
References
-
- Fan E, Del Sorbo L, Goligher EC, et al. An Official American Thoracic Society/European Society of Intensive Care Medicine/Society of Critical Care Medicine Clinical Practice Guideline: Mechanical Ventilation in Adult Patients with Acute Respiratory Distress Syndrome. Am J Respir Crit Care Med 2017; 195: 1253–1263. doi: 10.1164/rccm.201703-0548ST - DOI - PubMed
-
- Mojoli F, Chiumello D, Pozzi M, et al. Esophageal pressure measurements under different conditions of intrathoracic pressure. An in vitro study of second generation balloon catheters. Minerva Anestesiol 2015; 81: 10. - PubMed
-
- Baydur A, Behrakis PK, Zin WA, et al. A simple method for assessing the validity of the esophageal balloon technique. Am Rev Respir Dis 1982; 4: 788–791. - PubMed
LinkOut - more resources
Full Text Sources
Other Literature Sources