. 2021 Jan 20:20:635-651.
doi: 10.1016/j.omtm.2021.01.007. eCollection 2021 Mar 12.

Effective, safe, and sustained correction of murine XLA using a UCOE-BTK promoter-based lentiviral vector

Affiliations

Effective, safe, and sustained correction of murine XLA using a UCOE-BTK promoter-based lentiviral vector

Brenda J Seymour et al. Mol Ther Methods Clin Dev. .

Abstract

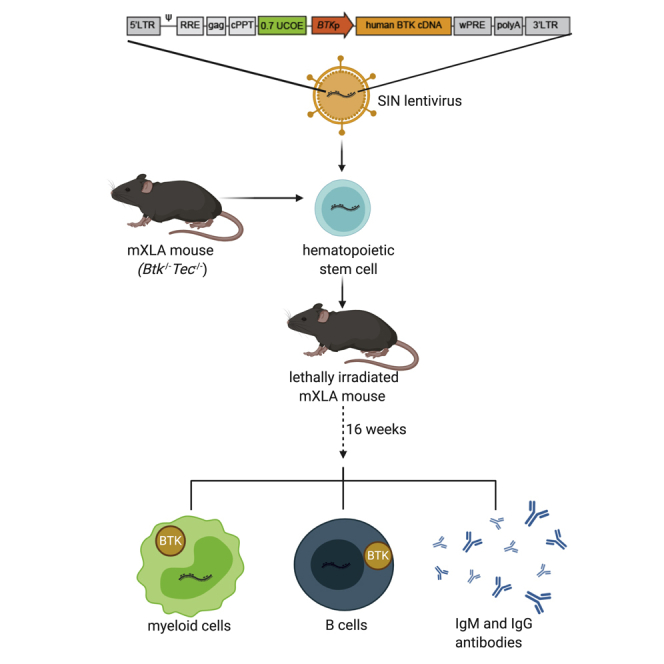
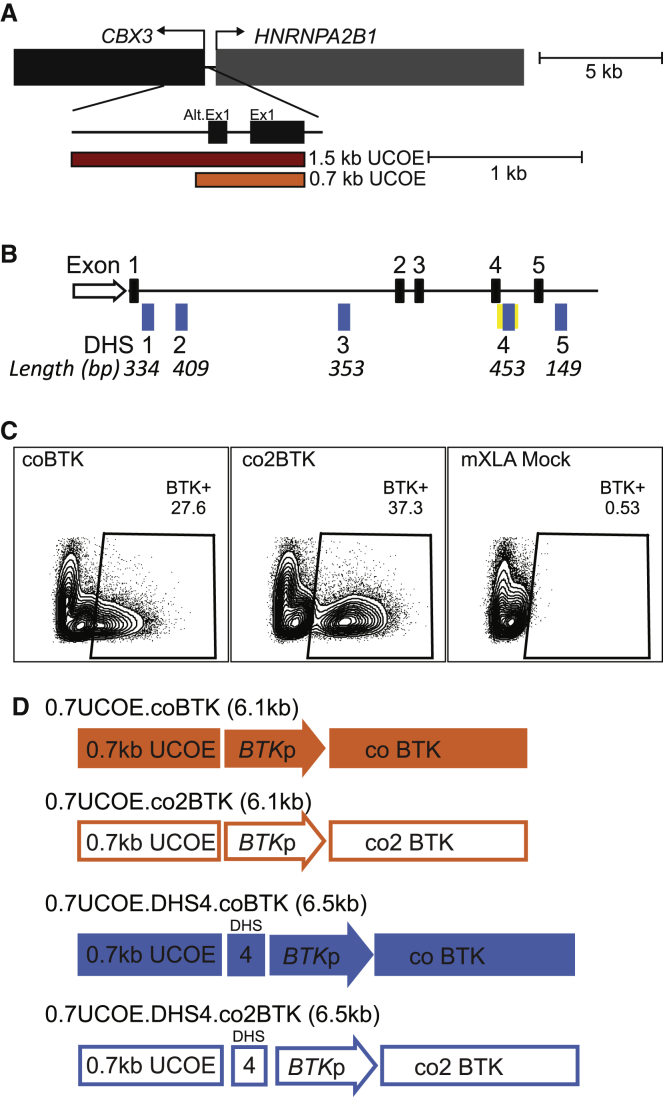
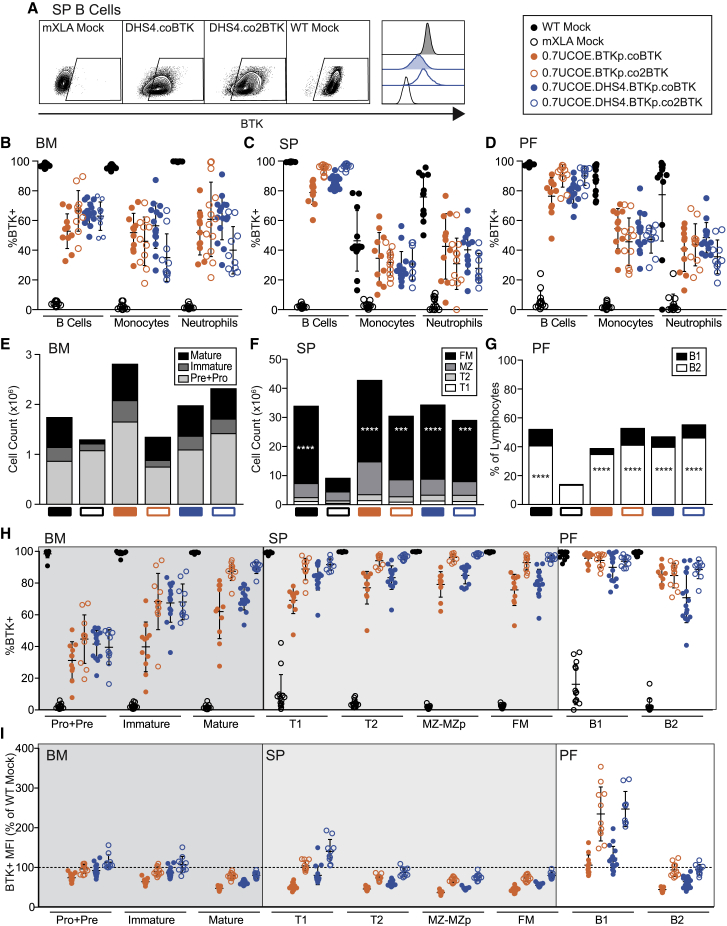
X-linked agammaglobulinemia (XLA) is an immune disorder caused by mutations in Bruton's tyrosine kinase (BTK). BTK is expressed in B and myeloid cells, and its deficiency results in a lack of mature B cells and protective antibodies. We previously reported a lentivirus (LV) BTK replacement therapy that restored B cell development and function in Btk and Tec double knockout mice (a phenocopy of human XLA). In this study, with the goal of optimizing both the level and lineage specificity of BTK expression, we generated LV incorporating the proximal human BTK promoter. Hematopoietic stem cells from Btk -/- Tec -/- mice transduced with this vector rescued lineage-specific expression and restored B cell function in Btk -/- Tec -/- recipients. Next, we tested addition of candidate enhancers and/or ubiquitous chromatin opening elements (UCOEs), as well as codon optimization to improve BTK expression. An Eμ enhancer improved B cell rescue, but increased immunoglobulin G (IgG) autoantibodies. Addition of the UCOE avoided autoantibody generation while improving B cell development and function and reducing vector silencing. An optimized vector containing a truncated UCOE upstream of the BTK promoter and codon-optimized BTK cDNA resulted in stable, lineage-regulated BTK expression that mirrored endogenous BTK, making it a strong candidate for XLA therapy.

Keywords: BTK; Bruton's tyrosine kinase; DNase hypersensitive sites; UCOE; X-linked Agammaglobulinemia; XLA; codon optimization; gene therapy; hematopoietic stem cells; lentivirus; primary immunodeficiency.


Conflict of interest statement

D.J.R., S.S., and K.S. are inventors on a patent filed by Seattle Children’s Research Institute related to the lentiviral vectors described in this study. The remaining authors declare no competing interests.

Figures

None
Graphical abstract
Figure 1
Figure 1
Comparison of the rescue of BTK expression and B cell development using alternative LV constructs in mXLA gene therapy (A) SIN-LVs were used to express human BTK cDNA driven by the BTK promoter (BTKp) (top). Variations of the vector contain a 1.5-kb ubiquitous chromatin opening element (1.5UCOE), Eμ enhancer, and/or codon-optimized human BTK cDNA (coBTK). (B and C) Bone marrow (BM), spleen (SP), and peritoneal fluid (PF) from LV gene therapy (LV-GT)-treated mice were analyzed 25–30 weeks post-transplant, and BTK expression in B cells (B) and myeloid cells (C) was determined by flow cytometry. Data represent mean ± SEM from 10 independent experiments; n = 14 (WT mock), 12 (mXLA mock), 5 (BTKp.BTK), 24 (1.5UCOE.BTKp.BTK), 18 (1.5UCOE.BTKp.coBTK), and 21 (Eμ.BTKp.BTK). (D–F) B cells (B220+) in BM, SP, and PF were stained for surface markers characterizing B cell subsets shown as number per mouse (SP and BM) or percentage of live lymphocytes (PF): (D) early B cell development (BM), (E) late B cell development (SP), and (F) peritoneal cavity B cells. Data represent mean ± SEM from 10 independent experiments with n (BM, SP, PF) = 11, 13, 14 (WT mock); 10, 11, 10 (mXLA mock); 5, 5, 5 (BTKp.BTK); 20, 21, 22 (1.5UCOE.BTKp.BTK); 14, 14, 17 (1.5UCOE.BTKp.coBTK); and 18, 19, 20 (Eμ.BTKp.BTK). (G and H) Total serum IgG (G) and IgM (H) in mice receiving LV-GT. Mice were immunized with NP-CGG 12 and 16 weeks post-transplant, and serum was collected 20 weeks post-transplant. Antibodies were measured by ELISA and quantified relative to a standard curve. Data represent mean ± SEM from four independent experiments: n = 9 (WT mock), 10 (mXLA mock), 2 (BTKp.BTK), 19 (1.5UCOE.BTKp.BTK), 14 (1.5UCOE.BTKp. coBTK), and 16 (Eμ.BTKp.BTK). p values were determined using the one-way ANOVA with Sidak’s correction for multiple comparisons. Statistically significant differences between experimental and mXLA mock cohorts are shown. ∗p < 0.05, ∗∗p < 0.01, ∗∗∗p < 0.001, ∗∗∗∗p < 0.0001.
Figure 2
Figure 2
Evidence of autoantibody formation and promoter silencing after Eμ.BTKp.BTK LV-GT (A) Anti-dsDNA IgG in serum from LV-GT-treated mXLA mice measured by ELISA prior to immunization (relative amount as OD450 absorbance). Data represent mean ± SEM from 10 independent experiments: n = 18 (WT mock), 16 (mXLA mock), 6 (BTKp.BTK), 30 (1.5UCOE.BTKp.BTK), 18 (1.5UCOE.BTKp.coBTK), 29 (Eμ.BTKp.BTK), and 2 (WASp chimera control). p values were determined using the one-way ANOVA corrected for multiple comparisons using Sidak’s method. Statistically significant differences between indicated cohorts are shown. ∗p < 0.05, ∗∗∗∗p < 0.0001. (B) Anti-dsDNA IgG2c and IgG3 subclasses in Eμ.BTKp,BTK mice (n = 23). (C) Average viral copy number (VCN) per cell in BM and SP as measured by qPCR. Data represent mean ± SEM from eight independent gene therapy experiments: n = 5 (BTKp.BTK), 18 (1.5UCOE.BTKp.BTK), 10 (1.5UCOE.BTKp.coBTK), and 18 (Eμ.BTKp.BTK) for SP, and n = 5 (BTKp.BTK.), 21 (1.5UCOE.BTKp.BTK), 14 (1.5UCOE.BTKp.coBTK), and 19 (Eμ.BTKp.BTK) for BM. (D) Methylation of BTKp within total splenocytes as quantified by bisulfite sequencing. Data are displayed as a percentage of methylated CpGs within the BTKp. p values were determined using the one-way ANOVA corrected for multiple comparisons using Tukey’s method. Statistically significant differences between experimental and mXLA Mock cohorts are shown. ∗∗∗∗p < 0.0001.
Figure 3
Figure 3
Testing novel LV elements to improve BTK expression profile (A) Depiction of the divergently transcribed housekeeping genes CBX3 and HNRNPA2B1 (A2UCOE) and the location of 1.5-kb UCOE within this region. (B) DNase I hypersensitive sites (DHS) within intronic regions of the BTK gene are shown (DHS1, DHS2, DHS3, DHS4, and DHS5; blue boxes). The ENCODE genome segmentation tool-predicted enhancer element that includes DHS4 is drawn as a yellow bar; exons are shown as black boxes. Various combinations of DHS sequences were cloned into the 0.7UCOE.BTKp.coBTK construct and tested in vitro (data not shown) and in vivo (Figure S5B). (C) Alternative codon optimizations of the BTK cDNA (coBTK and co2BTK) cloned into identical LV vectors were compared after in vitro transduction of mXLA lineage-negative BM cells (HSCs). Representative flow plots show intracellular BTK expression 7 days post-transduction. (D) Depiction of four candidate LV vectors, chosen as top candidates based on BTK expression (%BTK+ and MFI) after in vitro transduction of mXLA HSCs. Constructs contain a 0.7-kb UCOE upstream of BTKp, driving either coBTK or co2BTK expression with or without the BTK DHS4 fragment.
Figure 4
Figure 4
Alternative UCOE.BTKp LV vectors rescue BTK expression and B cell development Lymphocytes from BM, SP, and PF of mice receiving LV-GT analyzed 19–23 weeks post-transplant. Lymphoid cell subsets were identified by cell surface markers (Figure S7). (A) Representative flow plots showing intracellular BTK staining in splenic B cells at endpoint analysis. (B–D) Percent of BTK+ cells in BM (B), SP (C), and PF (D) lymphocyte subsets from LV-GT groups, determined by flow cytometry. (E–G) Numbers of cells in each B cell subset were calculated as a proportion of total BM (E) and SP (F) counts and are depicted as the group average in stacked bars for each subset. PF B cell subsets are depicted as % of total lymphocytes (G). p values were determined using the one-way ANOVA with Sidak’s correction for multiple comparisons. For a given B cell subset in (E)–(G), statistically significant differences between experimental and mXLA mock cohorts are shown. ∗∗∗p < 0.001, ∗∗∗∗p < 0.0001. (H) BTK expression in B cell subsets, measured by flow cytometry. (I) MFI (geometric mean) of BTK+ cells in each B cell subset, normalized to WT mock. Data represent mean ± SD from four experiments (in each experiment we compared two to three vectors head-to-head, and tested all vectors in at least two independent experiments): n = 13 (WT mock), 13 (mXLA mock), 11 (0.7UCOE.BTKp.co BTK), 11 (0.7UCOE.BTKp.co2BTK), 16 (0.7UCOE.DHS4.BTKp.co BTK), and 11 (0.7UCOE.DHS4.BTKp.co2 BTK). Results of statistical tests between all experimental groups are listed in Table S2.
Figure 5
Figure 5
Alternative UCOE.BTKp LV vectors restore in vivo and in vitro B cell responses (A) LV-GT-treated mXLA mice were immunized with NP-CGG in alum at 12 weeks post-transplant. Levels of NP-specific IgG in serum was measured by ELISA and quantified relative to an IgG standard. High-affinity NP-IgG (conjugation value of 4) was measured from serum prior to (–) and 10 days after primary immunization (1°). One month following primary challenge, mice were re-challenged with NP-CGG in PBS and serum was collected 10 days later (2°). One-way ANOVA with Tukey’s correction for multiple comparisons was used to determine differences between experimental and mXLA mock cohorts for both the primary and secondary antibody responses. Statistically significant p values are shown. ∗p < 0.05, ∗∗p < 0.01, ∗∗∗p < 0.001, ∗∗∗∗p < 0.0001. (B and C) Total serum IgG (B) and IgM (C) in serum from mice receiving LV-GT was measured by ELISA at endpoint analysis (21–23 weeks post-transplant). p values were determined using the one-way ANOVA with Sidak’s correction for multiple comparisons. Statistically significant differences between experimental and mXLA mock cohorts are shown. ∗p < 0.05, ∗∗p < 0.01, ∗∗∗p < 0.001, ∗∗∗∗p < 0.0001. Results from statistical tests between experimental groups are listed in Table S2. (D–F) At endpoint analysis, B cells were isolated from splenocytes by CD43 depletion, labeled with CTV, and stimulated in vitro with IgM, LPS, or media (negative control). (D) The percentage of BTK+ B cells that underwent one or more cell divisions 72 h after incubation with anti-mouse IgM antibodies, LPS, or media only (readout by flow cytometry). (E) BTK+ MFI of cells after each division (D0–D4), shown as % of WT mock. (F) Representative flow plots showing BTK staining and CTV dilution in B cells 72 h after IgM stimulation, gated on live B220+ BTK+ cells. Data represent mean ± SD from four experiments: n = 13 (WT mock), 13 (mXLA mock), 11 (0.7UCOE.BTKp.coBTK), 11 (0.7UCOE.BTKp.co2BTK), 16 (0.7UCOE.DHS4.BTKp.coBTK), and 11 (0.7UCOE.DHS4.BTKp.co2BTK).
Figure 6
Figure 6
0.7UCOE.BTKp.co LV exhibits selective advantage and functional rescue without evidence for toxicity (A and B) Relative serum concentrations of anti-dsDNA IgG (A) and anti-dsDNA IgG2c (B) in serum from the indicated mXLA LV-GT cohorts, as measured by ELISA (as OD450). Sera from autoimmune WAS chimeric mice and mice receiving Eμ.BTKp.BTK LV-GT were included as positive controls. p values were determined using the one-way ANOVA with Sidak’s method for multiple comparisons. Significant differences between the indicated groups are shown. ∗p < 0.05, ∗∗p < 0.01, ∗∗∗p < 0.001, ∗∗∗∗p < 0.0001. ns, not significant. (C and D) Genomic DNA (gDNA) was isolated from total BM (C) and SP (D) at endpoint analysis (21–23 weeks post-transplant), and VCN per cell was quantified by qPCR. Data represent mean ± SD from four independent experiments: n = 13 (WT mock), 13 (mXLA mock), 11 (0.7UCOE.BTKp.co), 11 (0.7UCOE.BTKp.co2), 16 (0.7UCOE.DHS4.BKTp.co), and 11 (0.7UCOE.DHS4.BKTp.co2).
Figure 7
Figure 7
LV 0.7UCOE.BTKp.coBTK transduces human XLA CD34+ cells at a clinically relevant VCN CD34+ PBSCs from mobilized healthy donors or XLA patients were thawed and, after a 48-h pre-stimulation in culture, transduced with LV at the indicated MOI. 16 h later, 10,000 cells from each condition were transferred to CFU media and cultured. After 1 week, cells from CFU colonies were collected and VCN was determined on gDNA by ddPCR. Black shapes indicate discrete healthy donors (used in two independent experiments); orange shapes indicate XLA patients (each patient repeated in two independent experiments). Bars and lines indicate mean ± SD.

Similar articles

Cited by

References

    1. Brosens L.A., Tytgat K.M., Morsink F.H., Sinke R.J., Ten Berge I.J., Giardiello F.M., Offerhaus G.J., Keller J.J. Multiple colorectal neoplasms in X-linked agammaglobulinemia. Clin. Gastroenterol. Hepatol. 2008;6:115–119. - PubMed
    1. Lee P.P., Chen T.X., Jiang L.P., Chan K.W., Yang W., Lee B.W., Chiang W.C., Chen X.Y., Fok S.F., Lee T.L. Clinical characteristics and genotype-phenotype correlation in 62 patients with X-linked agammaglobulinemia. J. Clin. Immunol. 2010;30:121–131. - PubMed
    1. Plebani A., Soresina A., Rondelli R., Amato G.M., Azzari C., Cardinale F., Cazzola G., Consolini R., De Mattia D., Dell’Erba G., Italian Pediatric Group for XLA-AIEOP Clinical, immunological, and molecular analysis in a large cohort of patients with X-linked agammaglobulinemia: an Italian multicenter study. Clin. Immunol. 2002;104:221–230. - PubMed
    1. Misbah S.A., Spickett G.P., Ryba P.C., Hockaday J.M., Kroll J.S., Sherwood C., Kurtz J.B., Moxon E.R., Chapel H.M. Chronic enteroviral meningoencephalitis in agammaglobulinemia: case report and literature review. J. Clin. Immunol. 1992;12:266–270. - PubMed
    1. Hermaszewski R.A., Webster A.D. Primary hypogammaglobulinaemia: a survey of clinical manifestations and complications. Q. J. Med. 1993;86:31–42. - PubMed