. 2021 Feb 12;24(3):102182.
doi: 10.1016/j.isci.2021.102182. eCollection 2021 Mar 19.

A robust platform for high-throughput screening of therapeutic strategies for acute and chronic spinal cord injury

Affiliations

A robust platform for high-throughput screening of therapeutic strategies for acute and chronic spinal cord injury

Vaibhav Patil et al. iScience. .

Abstract

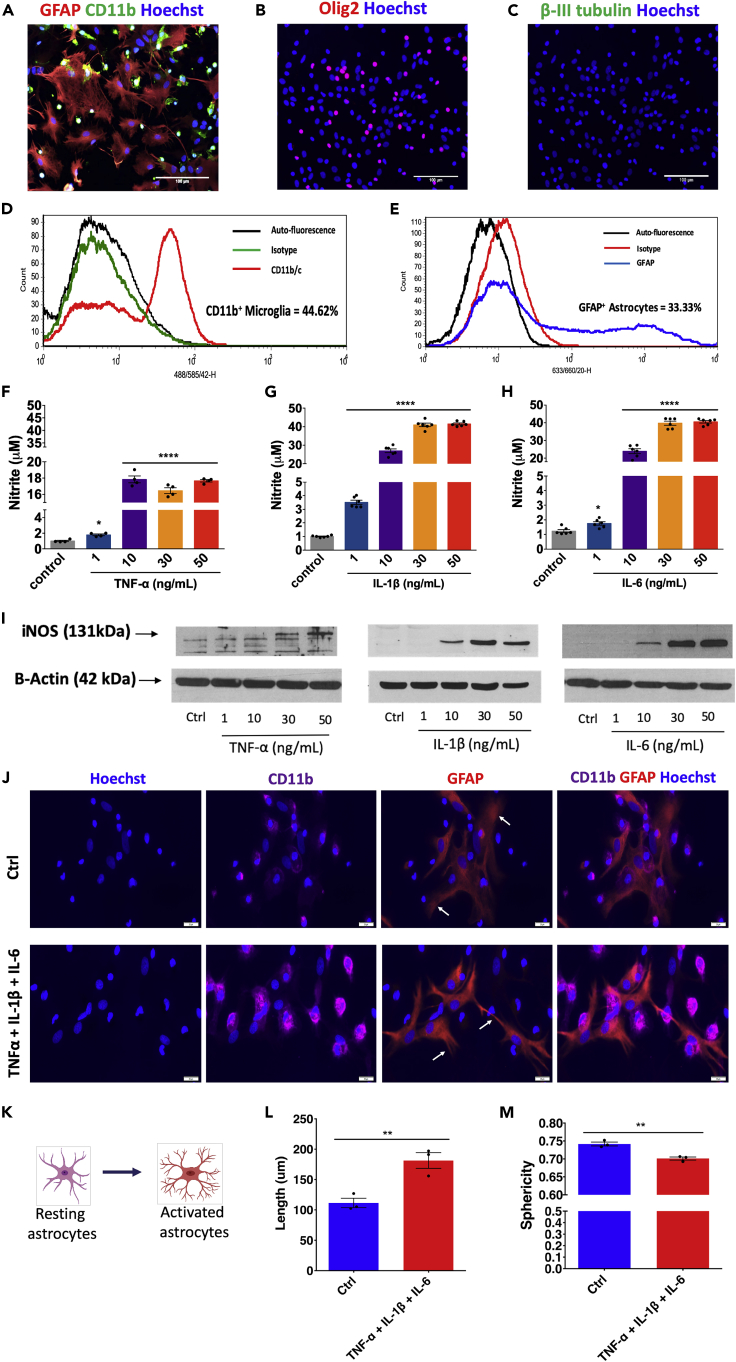
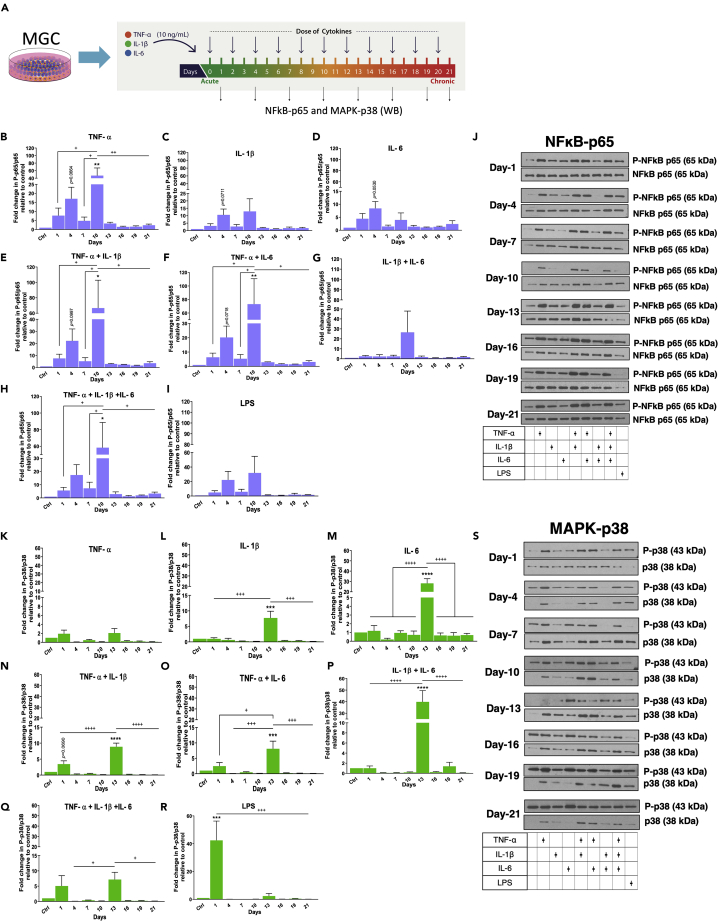
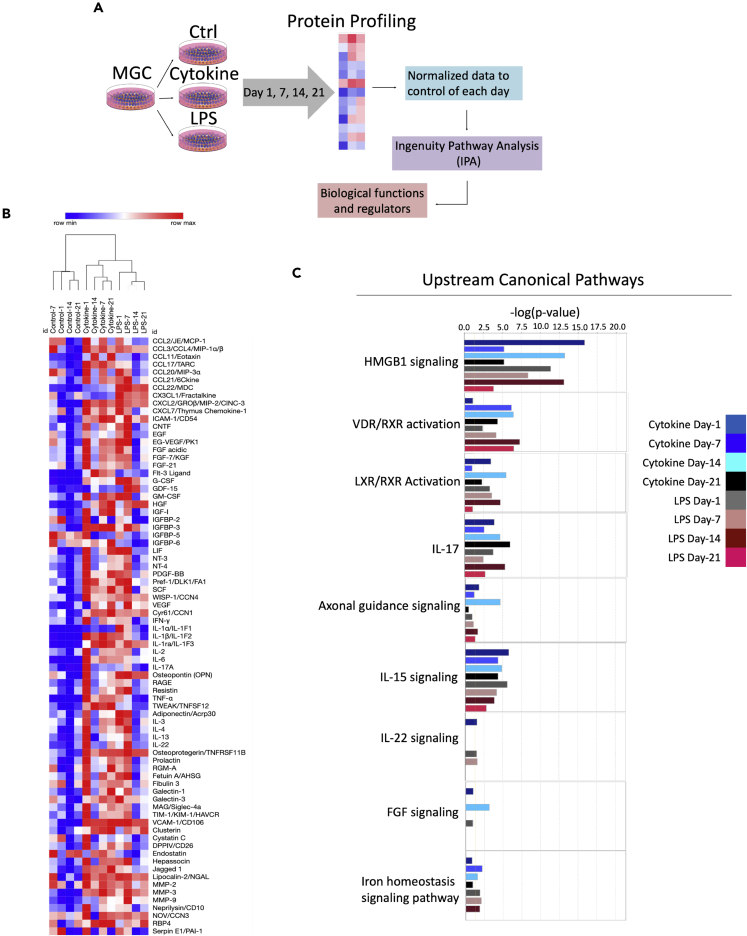
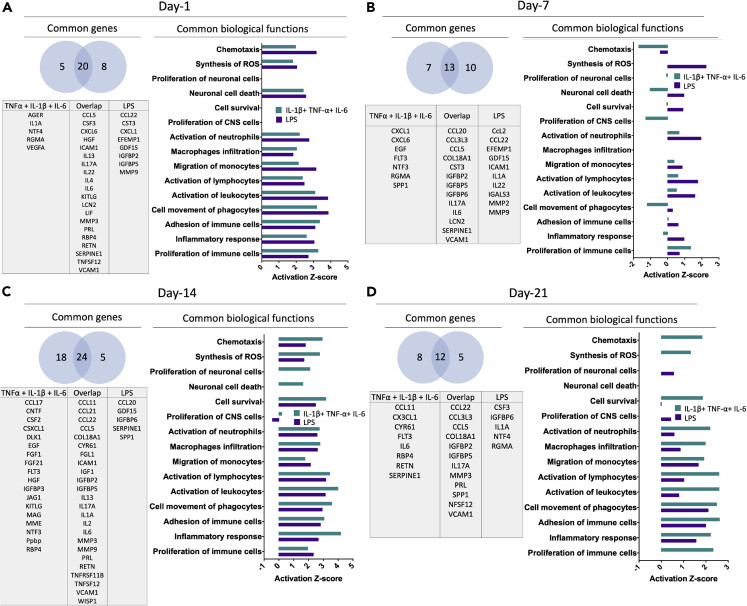
Astrocytes and microglia are critical regulators of inflammatory cascade after spinal cord injury (SCI). Existing glial in vitro studies do not replicate inflammatory phases associated with SCI. Here, we report an in vitro model of mixed glial culture where inflammation is induced by the administration of pro-inflammatory cytokines (tumor necrosis factor-α, interleukin-1β, and interleukin-6) to promote pathologically relevant "acute" and "chronic" inflammatory phases. We observed SCI relevant differential modulation of inflammatory pathways, cytokines, chemokines, and growth factors over 21 days. Mitochondrial dysfunction was associated with a cytokine combination treatment. Highly expressed cytokine induced neutrophil chemoattractant (CINC-3) chemokine was used as a biomarker to establish an enzyme-linked immunosorbent assay-based high-throughput screening (HTS) platform. We screened a 786-compound drug library to demonstrate the efficacy of the HTS platform. The developed model is robust and will facilitate in vitro screening of anti-reactive glial therapeutics for the treatment of SCI.

Keywords: Cellular Neuroscience; Immunology; Molecular Neuroscience; Proteomics.


Conflict of interest statement

The lead author declares that the invention disclosure form (IDF) is filled entitled “Designing of In vitro Inflammatory Model for High Throughput Drug Screening”.

Figures

None
Graphical abstract
Figure 1
Figure 1
Workflow describing steps involved in the development of the MGC HTS model MGCs were prepared from spinal cords isolated by the hydraulic extrusion technique from three-day-old postnatal rats. Immunocytochemistry and flow cytometry were performed to characterize the MGC, and further quantification of astrocytes, microglia, oligodendrocytes, and neurons was carried out. MGCs were treated with TNF-α, IL-1β, and IL-6 (10 ng/mL per cytokine) in combination/s for one day (acute) to 21 days (chronic). LPS (10 ng/mL) was used as a positive control. Treatments were given every alternate day (n = images from three experimental replicates). The supernatant was assayed using the Proteome Profiler Array (R&D Systems, Inc.). Total protein was extracted, and western blotting was performed to study the activation of NFκB-p65 and MAPK-p38 pathways (n = 3). Mitochondrial function was assessed by using Seahorse Mito Stress Test assay. MGCs were treated with TNF-α, IL-1β, and IL-6 (10 ng/mL per cytokine) for seven days (n = 3). Finally, an HTS platform was established that enabled identification of anti-inflammatory compounds.
Figure 2
Figure 2
Characterization of MGC and optimization of pro-inflammatory cytokine dose and effect of the treatment on MGC phenotypes (A–C) Immunostaining using GFAP, CD11b, and Olig2 markers showed the presence of astrocyte, microglia, and oligodendrocytes, respectively. The Beta III tubulin staining could not detect any neurons in MGC. n = 3, scale bar = 100 μm. (D–E) Flow cytometry confirms the quantification of astrocytes and microglia in MGC. (F–I) Griess assay and western blotting showing the production of nitrite and iNOS expression, respectively, under different dosage of TNF-α, IL-1β, and IL-6 treatment. A 10 ng/mL dose of each of cytokine was selected to be used for further studies. Data are expressed as mean ± standard error of the mean (SEM), n = two independent experiments each with two-three replicates; ∗∗∗∗p < 0.0001, ∗p < 0.05 compared with the control group (24 hr), one-way analysis of variance (ANOVA), post hoc Tukey test. (J) Effect of cytokine combination on astrocytes (GFAP, red) and microglia (CD11b, violet). Scale bar = 20 μm. (K) Change in the morphology of astrocytes from resting to activated phase. Their processes become more ramified upon activation. (L and M) Quantification of astrocytic processes shows processes that were (L) more elongated and (M) showed a decrease in roundness after cytokine combination treatment (24 hr). Data are represented as mean ± SEM, n = 3; ∗∗p < 0.01, Mann-Whitney U test (See also Figures S1 and S10).
Figure 3
Figure 3
Cytokine combination treatments differentially activate NFκB-p65 and MAP-p38 pathways Western blots show the quantification of the expression of P-NFκB-p65 and P-MAP-p38 from 24 hr up to 21 days upon various combinatorial treatments of TNF-α, IL-1β, and IL-6. The intensity of the P-NFκB-p65 was normalized to NFκB-p65, and the intensity of the P-p38-MAPAK was normalized to p38-MAPAK. (A) Layout of the experiment. (B–H) Upon the treatment of (B) TNF-α, (E) TNF-α and IL-1β, (F) TNF-α and IL-6, and (H) TNF-α, IL-1β, and IL-6 combinations, the pathway was highly activated from the acute to the subacute phase (day one to day ten). However, the combinations of (C) IL-1β, (D) IL-6, and (G) IL-1β and IL-6 treatments did not significantly regulate the pathway over the acute to the subacute phase. (I) LPS did not induce the activation of the pathway significantly. (J) Western blots. All combinatorial treatments did not affect the pathway from day 13 to day 21. (K–Q) (K) TNF-α treatment did not induce significant activation of the pathway from the acute to the chronic phase. Upon treatment of (L) IL-1β, (M) IL-6, (O) TNF-α and IL-6, (P) IL-1β and IL-6, and (Q) TNF-α, IL-1β, and IL-6 combinations, the pathway was significantly activated at day 13. However, (N) TNF-α and IL-1β combination treatment showed the pathway was activated significantly at day one compared to other days except for day 13. In this combination also, the pathway was significantly activated at day 13. (R) LPS induced the activation of the pathway at day one. (S) Western blots. Data are represented as mean ± SEM, n = three experimental replicates ∗∗∗∗p < 0.0001, ∗∗∗p < 0.001, ∗∗p < 0.01, p < 0.05 compared with a control group (Ctrl). ++++p < 0.0001, +++p < 0.001, ++p < 0.01, +p < 0.05; one-way ANOVA, post hoc multiple comparison Tukey test (See also Table S1).
Figure 4
Figure 4
Differential regulation of biological functions and diseases upon cytokine induction (A) Workflow describing steps involved in protein profiling and IPA analysis. (B) Hierarchical clustering analysis of 79 analytes. The mean pixel density analyzed by the Proteome profile array of proteins secreted by MGC in the supernatant. Colors define activation as highly expressed (red) and no expression (blue). Only one cytokine combination (i.e. TNF-α, IL-1β, and IL-6 combination) was used along with LPS as a positive control. Treatment was given from day 1 up to day 21, and at four time points, day 1, day 7, day 14, and day 21, the supernatant was analyzed. The experiment was carried out in three biological replicates, and supernatants were pooled together, and proteome profiler array was performed. Each analyte on the array was printed in duplicate. The values shown per time point are an average of both. (C) The upstream regulators are represented as activation Z score. The mean pixel density data obtained from proteome profile array were normalized to control and analyzed in IPA© software with the cutoff of 1.5 for downstream and upstream canonical pathways (See also Figures S2–S5, Data S1 and S2).
Figure 5
Figure 5
Transcriptome and biological function comparison between cytokine combination and LPS treatment from day one to day 21 (A, B, C, and D) Venn diagram of genes and biological functions analyzed using IPA. Genes commonly expressed between or unique in cytokine combination and LPS treatment are analyzed. Biological functions represented as activation Z score show positive values as upregulation, zero as no change, and negative values as downregulation (See also Data S3).
Figure 6
Figure 6
A cytokine combination treatment increases OCR, respiration, ATP production, and proton leak and decreases coupling efficiency and membrane potential over seven days (A–F) All parameters were calculated as a function of a cytokine combination treatment. For this, total protein per well was calculated using a BCA protein quantification assay, and data were normalized against it. Data are represented as mean ± SEM, n = three independent experiments. ∗p < 0.05, ∗∗p < 0.01, ∗∗∗p < 0.001 vs respective day of control. A student t-test was performed to test the difference between the treatment and the respective day of control. (G) ROS species detected using an ROS-superoxide assay confirms an increase in the oxidative stress in MGC. Negative control (-ve Ctrl): ROS inhibitor (N-acetyl-L-cysteine), positive control (+ve Ctrl): ROS inducer (Pyocyanin). Data are represented as mean ± SEM, n = four experimental replicates, ∗p < 0.05, ∗∗∗∗p < 0.001 compared with the Ctrl (control) group. (H) Basal ECAR and OCR plotted on the same axis obtained from control and cytokine combination treatment to MGC. (I) Rate of extracellular acidification caused by glycolysis by lactate production and respiration by CO2 production from day one to day seven. Both control and cytokine combination treatment groups showed an increase in acidification by glycolysis rather than by respiration, whereas compared to the control, the cytokine treatment increases glycolysis-based acidification. However, there was no difference between the control and the cytokine treatment group in acidification by respiration. (J) Data from basal ECAR and OCR have been converted to the rate of ATP production by glycolysis using formula. (K) Data from basal ECAR and OCR have been converted to the rate of ATP production by oxidation using the formula. Data are represented as mean ± SEM, n = three experimental replicates (See also Figures S6 and S9 and Data S4).
Figure 7
Figure 7
HTS optimization, validation, and its use to identify novel targets for inflammation (A) Workflow for high-throughput screening. (i)15,000 cells/well/50 uL were seeded in pre-PLL-coated 384-well plates and were left to grow for two days. (ii) After two days, 50 uL of the treatment media (without FBS and with cytokine combination) was added into compound plates and incubated for an hour. The treatment media containing compounds was transferred to cell plates after removal of original media. (iii) Compounds were incubated with cells for 24 hr. Further, ELISA was performed on the supernatant to assess CINC-3 expression from each well and alamarBlue assay on cells. All the steps were carried out using a JANUS workstation. There were three compound plates, and each plate contained four replicates of controls (Ctrl, DMSO (0.03%), cytokine combination (IL-1β+ TNF-α+ IL-6, 10 ng/mL each), and DMSO + cytokine combination. (B) Increase in the CINC-3 expression after cytokine combination treatment. Data are represented as mean ± SEM, n = 12, ∗∗∗∗p < 0.0001 compared with Ctrl, ++++p < 0.0001 compared with DMSO (0.03%) Ctrl; one-way ANOVA followed by post hoc Tukey test. (C) Three plates pulled assay points (box plot). Red dotted line: cutoff point (i.e. 783 pg/mL) for 50% inhibition of CINC-3. (D) Three plates pulled assay points (scattered dot plot). (E) alamarBlue assay showing metabolic activity after cytokine combination treatment. Red dotted line: Normalized and compared with the control (i.e. 100%). Data are represented as mean ± SEM, n = three experimental replicates with four technical replicates, ∗∗∗∗p < 0.0001, ∗∗p < 0.01; one-way ANOVA followed by post hoc Tukey multiple comparison test. (F) All assay points (box plot). (G) All assay points (scattered dot plot) (See also Figures S7 and S8 and Table S2).
Figure 8
Figure 8
Validation of HTS—dose-dependent significant reduction of CINC-3 production upon corticosteroids treatment during secondary screening (A) Methylprednisolone treatment. (B) Fluocinolone acetonide. (C) Clobetasol propionate treatment. (D–F) There were no metabolic changes upon drug induction. Data are represented as mean ± SEM, n = three-four experimental replicates. For (A-C), ∗∗∗∗p < 0.0001, ∗∗∗p < 0.001 vs DMSO + cytokine group; for (D-F), ∗∗p < 0.01 vs Ctrl group. One-way ANOVA followed by post hoc Tukey test (See also Figure S11 and Table S2).

References

    1. Akhmetzyanova E., Kletenkov K., Mukhamedshina Y., Rizvanov A. Different approaches to modulation of microglia phenotypes after spinal cord injury. Front. Syst. Neurosci. 2019;13:1–12. - PMC - PubMed
    1. Alizadeh A., Dyck S.M., Karimi-Abdolrezaee S. Traumatic spinal cord injury: an overview of pathophysiology, models and acute injury mechanisms. Front. Neurol. 2019;10:282. - PMC - PubMed
    1. Anderson M.A., O'Shea T.M., Burda J.E., Ao Y., Barlatey S.L., Bernstein A.M., Kim J.H., James N.D., Rogers A., Kato B. Required growth facilitators propel axon regeneration across complete spinal cord injury. Nature. 2018;561:396–400. - PMC - PubMed
    1. Beaudet M.-J., Yang Q., Cadau S., Blais M., Bellenfant S., Gros-Louis F., Berthod F. High yield extraction of pure spinal motor neurons, astrocytes and microglia from single embryo and adult mouse spinal cord. Sci. Rep. 2015;5:16763. - PMC - PubMed
    1. Becher B., Spath S., Goverman J. Cytokine networks in neuroinflammation. Nat. Rev. Immunol. 2017;17:49–59. - PubMed

LinkOut - more resources