. 2021 Feb 17;24(3):102199.
doi: 10.1016/j.isci.2021.102199. eCollection 2021 Mar 19.

GhPIPLC2D promotes cotton fiber elongation by enhancing ethylene biosynthesis

Affiliations

GhPIPLC2D promotes cotton fiber elongation by enhancing ethylene biosynthesis

Liping Zhu et al. iScience. .

Erratum in

Abstract

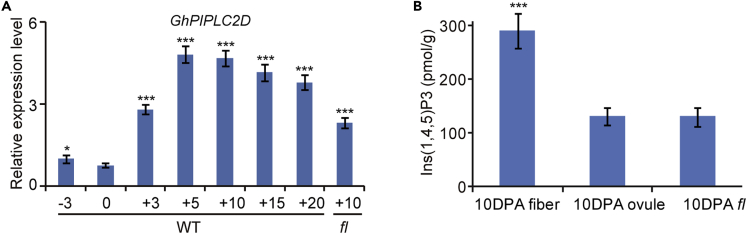
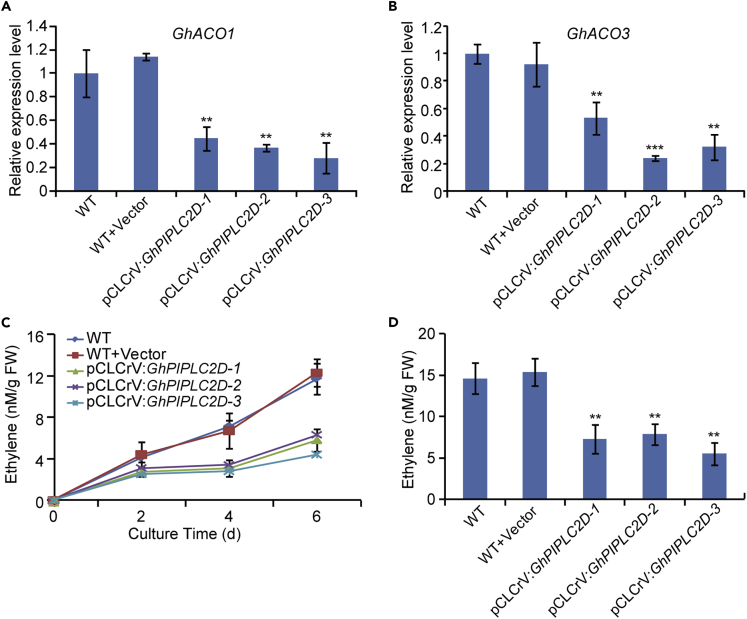
Inositol-1,4,5-trisphosphate (IP3) is an important second messenger and one of the products of phosphoinositide-specific phospholipase C (PIPLC)-mediated phosphatidylinositol (4,5) bisphosphate (PIP2) hydrolysis. However, the function of IP3 in cotton is unknown. Here, we characterized the function of GhPIPLC2D in cotton fiber elongation. GhPIPLC2D was preferentially expressed in elongating fibers. Suppression of GhPIPLC2D transcripts resulted in shorter fibers and decreased IP3 accumulation and ethylene biosynthesis. Exogenous application of linolenic acid (C18:3) and phosphatidylinositol (PI), the precursor of IP3, improved IP3 and myo-inositol-1,2,3,4,5,6-hexakisphosphate (IP6) accumulation, as well as ethylene biosynthesis. Moreover, fiber length in GhPIPLC2D-silenced plant was reduced after exogenous application of IP6 and ethylene. These results indicate that GhPIPLC2D positively regulates fiber elongation and IP3 promotes fiber elongation by enhancing ethylene biosynthesis. Our study broadens our understanding of the function of IP3 in cotton fiber elongation and highlights the possibility of cultivating better cotton varieties by manipulating GhPIPLC2D in the future.

Keywords: biological sciences; plant biology; plant development.


Conflict of interest statement

The authors declare that they have no conflict of interests.

Figures

None
Graphical abstract
Figure 1
Figure 1
Phylogenetic analysis and conserved domains of GhPIPLCs (A) phylogenetic analysis of 12 GhPIPLCs, 9 GaPIPLCs, 9 GrPIPLCs, 9 GhePIPLCs, 9 AtPIPLCs, and 4 OsPIPLCs. Numbers indicate bootstrap confidence percentages. Scale indicates evolutionary distance. (B) conserved domains of GhPIPLCs. The gray line indicates protein sequence length. Boxes with different colors represent different conserved domains of the GhPIPLC proteins.
Figure 2
Figure 2
Expression of the GhPIPLC2D gene and IP3 accumulation in cotton fibers and ovules (A) the expression levels of GhPIPLC2D during fiber development between 3 day prior to anthesis to 20 days post-anthesis. Gene expression data were obtained by quantitative real-time PCR with three independent replicates. Error bars represent the SE (n = 3 biological replicates). Statistical significance was determined using one-way ANOVA with Tukey's test. (B) analysis of IP3 accumulation in fibers, WT ovules and fl ovules 10 DPA. Statistical significance was determined using one-way ANOVA with Tukey's test. Error bars represent the SE (n = 3 biological replicates). ∗p < 0.05, ∗∗∗p < 0.001. WT, wild-type; fl, fuzzless-lintless mutant; DPA, days post-anthesis.
Figure 3
Figure 3
GhPIPLC2D is involved in cotton fiber elongation (A) the expression levels of GhPIPLC2D in fibers of WT and GhPIPLC2D-silenced plants 10 DPA. Gene expression data were obtained by quantitative real-time PCR with three independent replicates. (B) comparison of fiber lengths in WT and GhPIPLC2D-silenced plants. (C) representative seeds with attached fibers from the VIGS experiment. Scale bar = 1 cm. (D) comparison analysis of IP3 contents in WT and GhPIPLC2D-silenced plants. Statistical significance was determined using one-way ANOVA with Tukey's test. Error bars represent the SE (n = 3 biological replicates). ∗∗p < 0.01, ∗∗∗p < 0.001. WT, wild-type.
Figure 4
Figure 4
Silencing the GhPIPLC2D gene reduced ethylene biosynthesis and production Relative expression levels of GhAC O 1 (A) and GhAC O 3 (B) in 10 DPA fibers of WT and GhPIPLC2D-silenced plants. Gene expression data were obtained by quantitative real-time PCR with three independent replicates. The relative expression level of each gene was determined after normalizing to the expression level of the WT, which was set to 1.0. (C) ethylene production in 10 DPA fibers of WT and GhPIPLC2D-silenced plants. (D) ethylene production from ovules of WT and GhPIPLC2D-silenced plants cultured for six days. Statistical significance was determined using one-way ANOVA with Tukey's test. Error bars represent the SE (n = 3 biological replicates). ∗∗p < 0.01, ∗∗∗p < 0.001. WT, wild-type.
Figure 5
Figure 5
C18:3 and PI promote IP3 and IP6 production and ethylene biosynthesis Accumulation of IP3 (A) and ethylene biosynthesis gene transcripts (B) in ovules treated in vitro with C18:3, the C18:3 inhibitor carbenoxolone, PI or the PI inhibitor 5-hydroxytryptamine. Gene transcripts in (B) were obtained by qRT-PCR with three replicates. (C) ethylene production in the same treatments as in (A). (D) ethylene production over six days of ovule cultivation with the same treatments as in (A). (E) IP6 accumulation in ovules treated in vitro with C18:3, the C18:3 inhibitor carbenoxolone, PI or the PI inhibitor 5-hydroxytryptamine. ∗p < 0.05, ∗∗p < 0.01, ∗∗∗p < 0.001. Statistical significance was determined using one-way ANOVA with Tukey's test. Error bars represent the SE (n = 3 biological replicates). No chemicals were added the control.
Figure 6
Figure 6
Fiber length and ethylene production increased after IP6 treatment in vitro Analysis of fiber length (A) and GhAC O 1 (B) and GhAC O 3 (C) gene expression, as well as ethylene production (D) after treatment with different concentrations of IP6in vitro. Relative expression levels of each gene were determined after normalizing to the expression level in the control, which was set to 1.0. Statistical significance was determined using one-way ANOVA with Tukey's test. Error bars represent the SE (n = 3 biological replicates). ∗p < 0.05, ∗∗p < 0.01, ∗∗∗p < 0.001. No chemicals were added to the control.
Figure 7
Figure 7
Exogenous application of ethylene and IP6 promoted fiber length of GhPIPLC2D-silenced cotton (A) phenotype of fiber cells from WT, GhPIPLC2D-silenced plant and WT, GhPIPLC2D-silenced plant with ethylene and IP6 application, respectively. Scale bar = 2mm. (B) comparison of fiber lengths in WT, GhPIPLC2D-silenced plants and WT, GhPIPLC2D-silenced plant with ethylene and IP6 application, respectively. Statistical significance was determined using one-way ANOVA with Tukey's test. Error bars represent the SE (n = 3 biological replicates). ∗∗p < 0.01, ∗∗∗p < 0.001. WT, wild-type.
Figure 8
Figure 8
Proposed working model of GhPIPLC regulation of fiber elongation

References

    1. Abd-El-Haliem A.M., Joosten M.H. Plant phosphatidylinositol-specific phospholipase C at the center of plant innate immunity. J. Integr. Plant Biol. 2017;59:164–179. - PubMed
    1. Alimohammadi M., de Silva K., Ballu C., Ali N., Khodakovskaya M.V. Reduction of inositol (1,4,5)-trisphosphate affects the overall phosphoinositol pathway and leads to modifications in light signalling and secondary metabolism in tomato plants. J. Exp. Bot. 2012;63:825–835. - PMC - PubMed
    1. Arpat A.B., Waugh M., Sullivan J.P., Gonzales M., Frisch D., Main D., Wood T., Leslie A., Wing R.A., Wilkins T.A. Functional genomics of cell elongation in developing cotton fibers. Plant Mol. Biol. 2004;54:911–929. - PubMed
    1. Blatt M.R., Thiel G., Trentham D.R. Reversible inactivation of K+ channels of Vicia stomatal guard cells following the photolysis of caged inositol 1,4,5-trisphosphate. Nature. 1990;346:766–769. - PubMed
    1. Chu Y.J., Chen X., Xue H.W. Ins(1,4,5)P3 suppresses protein degradation in plant vacuoles by regulating SNX-mediated protein sorting. Mol. Plant. 2016;9:1440–1443. - PubMed