

A Deep Learning Approach to Diagnostic Classification of Prostate Cancer Using Pathology-Radiology Fusion
- PMID: 33719168
- PMCID: PMC8360022
- DOI: 10.1002/jmri.27599
A Deep Learning Approach to Diagnostic Classification of Prostate Cancer Using Pathology-Radiology Fusion
Abstract
Background: A definitive diagnosis of prostate cancer requires a biopsy to obtain tissue for pathologic analysis, but this is an invasive procedure and is associated with complications.
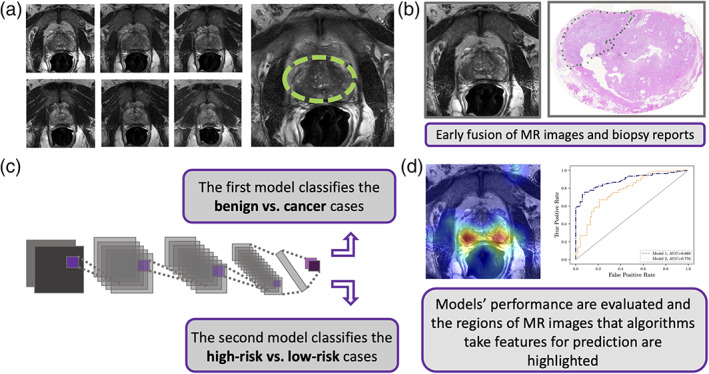
Purpose: To develop an artificial intelligence (AI)-based model (named AI-biopsy) for the early diagnosis of prostate cancer using magnetic resonance (MR) images labeled with histopathology information.
Study type: Retrospective.
Population: Magnetic resonance imaging (MRI) data sets from 400 patients with suspected prostate cancer and with histological data (228 acquired in-house and 172 from external publicly available databases).
Field strength/sequence: 1.5 to 3.0 Tesla, T2-weighted image pulse sequences.
Assessment: MR images reviewed and selected by two radiologists (with 6 and 17 years of experience). The patient images were labeled with prostate biopsy including Gleason Score (6 to 10) or Grade Group (1 to 5) and reviewed by one pathologist (with 15 years of experience). Deep learning models were developed to distinguish 1) benign from cancerous tumor and 2) high-risk tumor from low-risk tumor.
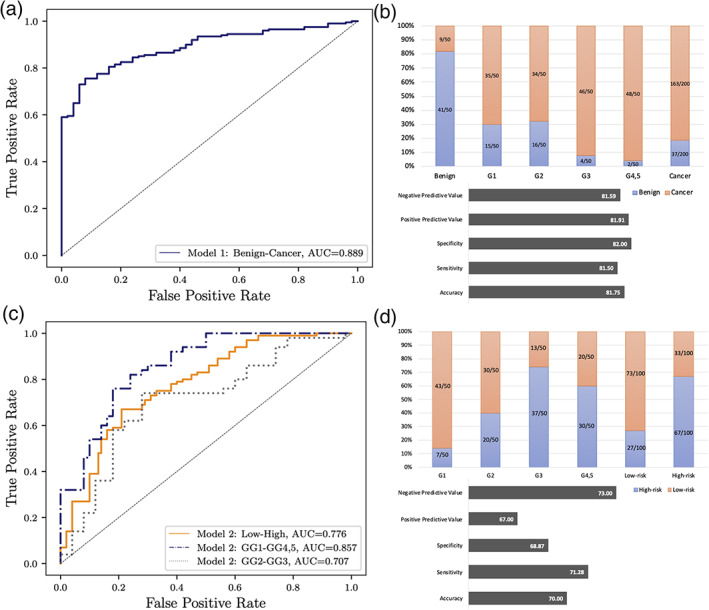
Statistical tests: To evaluate our models, we calculated negative predictive value, positive predictive value, specificity, sensitivity, and accuracy. We also calculated areas under the receiver operating characteristic (ROC) curves (AUCs) and Cohen's kappa.
Results: Our computational method (https://github.com/ih-lab/AI-biopsy) achieved AUCs of 0.89 (95% confidence interval [CI]: [0.86-0.92]) and 0.78 (95% CI: [0.74-0.82]) to classify cancer vs. benign and high- vs. low-risk of prostate disease, respectively.
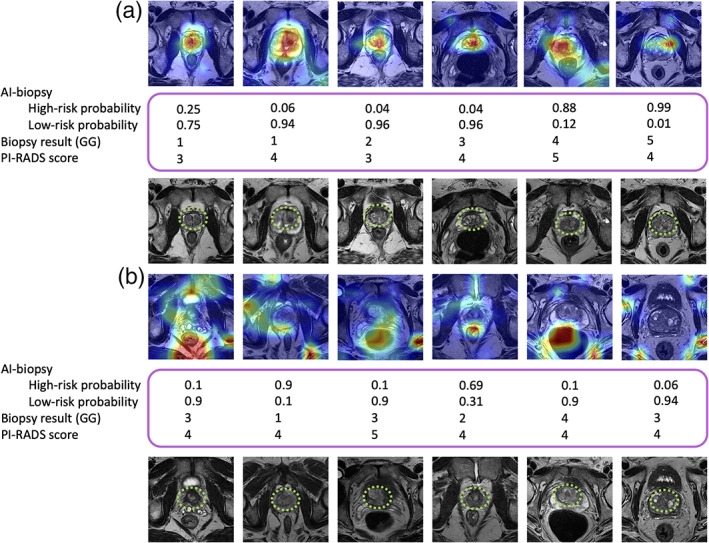
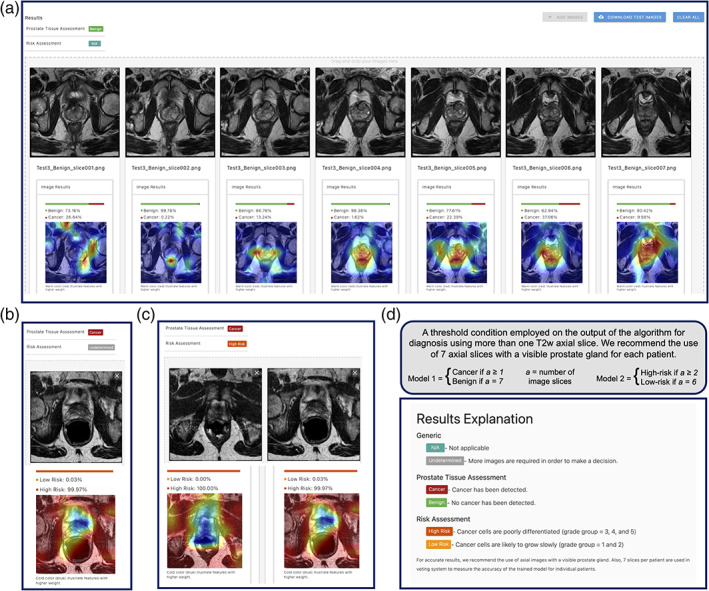
Data conclusion: AI-biopsy provided a data-driven and reproducible way to assess cancer risk from MR images and a personalized strategy to potentially reduce the number of unnecessary biopsies. AI-biopsy highlighted the regions of MR images that contained the predictive features the algorithm used for diagnosis using the class activation map method. It is a fully automatic method with a drag-and-drop web interface (https://ai-biopsy.eipm-research.org) that allows radiologists to review AI-assessed MR images in real time.
Level of evidence: 1 TECHNICAL EFFICACY STAGE: 2.
Keywords: MRI images; PI-RADS; artificial intelligence; biopsy; deep neural networks; prostate cancer.
© 2021 The Authors. Journal of Magnetic Resonance Imaging published by Wiley Periodicals LLC. on behalf of International Society for Magnetic Resonance in Medicine.
Conflict of interest statement
The authors declare no competing interests.
Figures
Comment in
-
Editorial for "A Deep Learning Approach to Diagnostic Classification of Prostate Cancer Using Pathology-Radiology Fusion".J Magn Reson Imaging. 2021 Aug;54(2):472-473. doi: 10.1002/jmri.27630. Epub 2021 Apr 4. J Magn Reson Imaging. 2021. PMID: 33813780 No abstract available.
References
-
- Pilleron S, Sarfati D, Janssen‐Heijnen M, et al. Global cancer incidence in older adults, 2012 and 2035: A population‐based study. Int J Cancer 2019;144(1):49‐58. - PubMed
-
- Hricak H, Choyke PL, Eberhardt SC, Leibel SA, Scardino PT. Imaging prostate cancer: A multidisciplinary perspective. Radiology 2007;243(1):28‐53. - PubMed
-
- Barrett T, Haider MA. The emerging role of MRI in prostate cancer active surveillance and ongoing challenges. AJR Am J Roentgenol 2017;208(1):131‐139. - PubMed
-
- Hamdy FC, Donovan JL, Lane JA, et al. 10‐year outcomes after monitoring, surgery, or radiotherapy for localized prostate cancer. N Engl J Med 2016;375(15):1415‐1424. - PubMed
Publication types
MeSH terms
Grants and funding
LinkOut - more resources
Full Text Sources
Other Literature Sources
Medical
Research Materials
Miscellaneous
