. 2021 Apr 6;10(7):e019310.
doi: 10.1161/JAHA.120.019310. Epub 2021 Mar 15.

Estrogen Plays a Crucial Role in Rab9-Dependent Mitochondrial Autophagy, Delaying Arterial Senescence

Affiliations

Estrogen Plays a Crucial Role in Rab9-Dependent Mitochondrial Autophagy, Delaying Arterial Senescence

Yuichi Sasaki et al. J Am Heart Assoc. .

Abstract

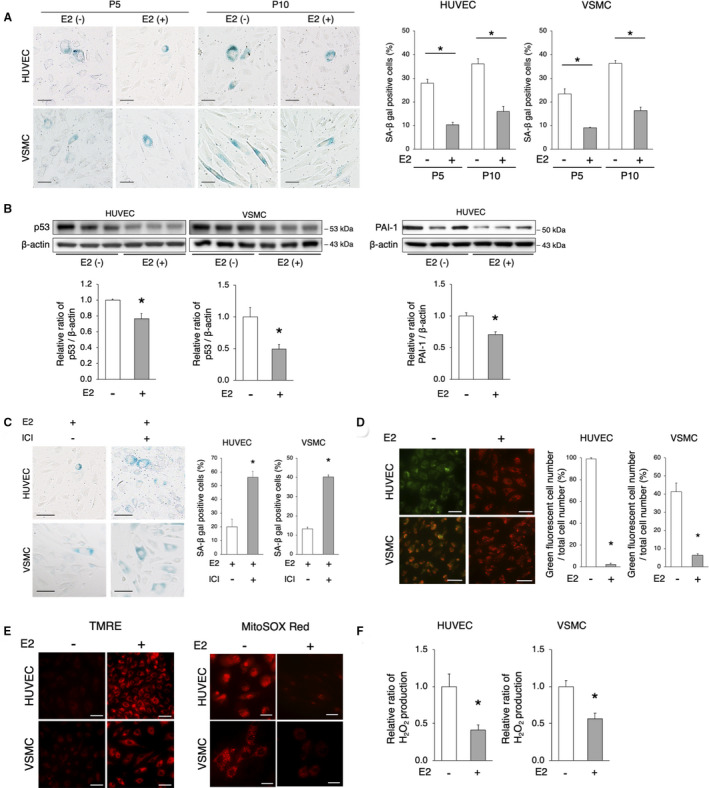
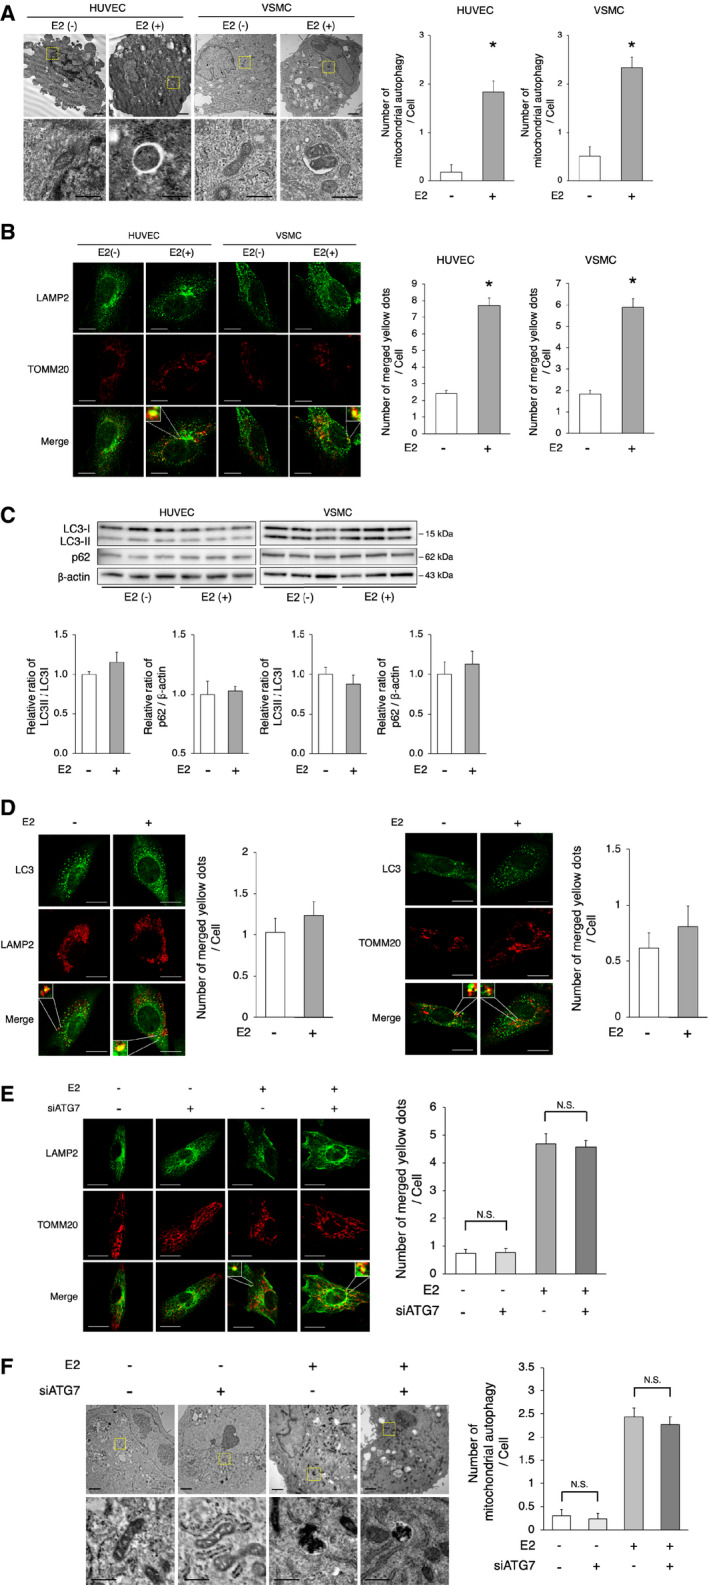
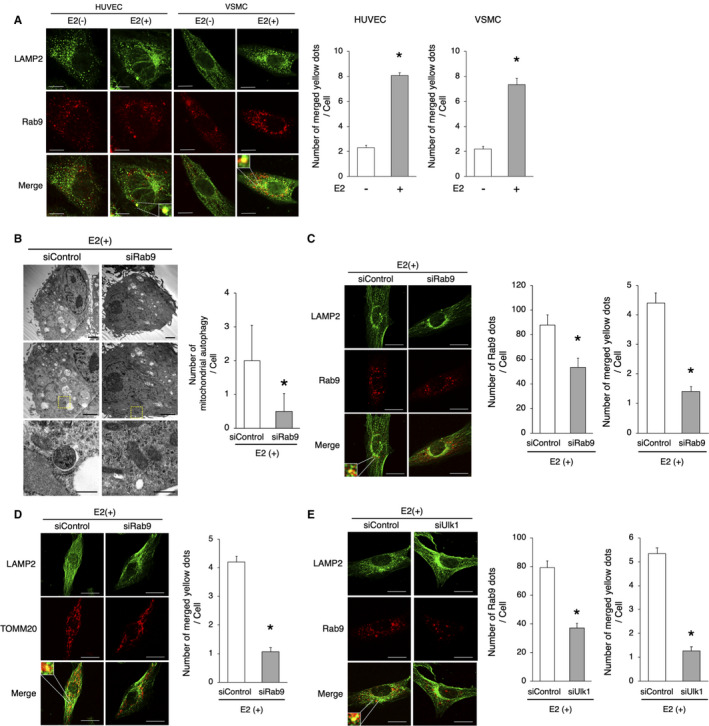
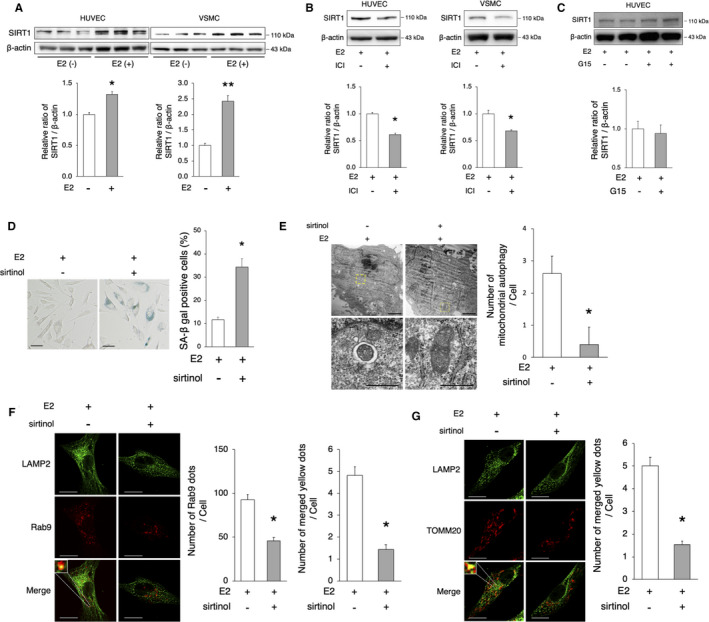
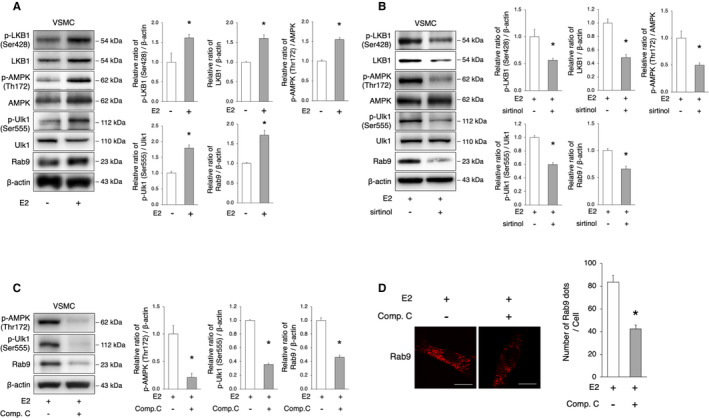
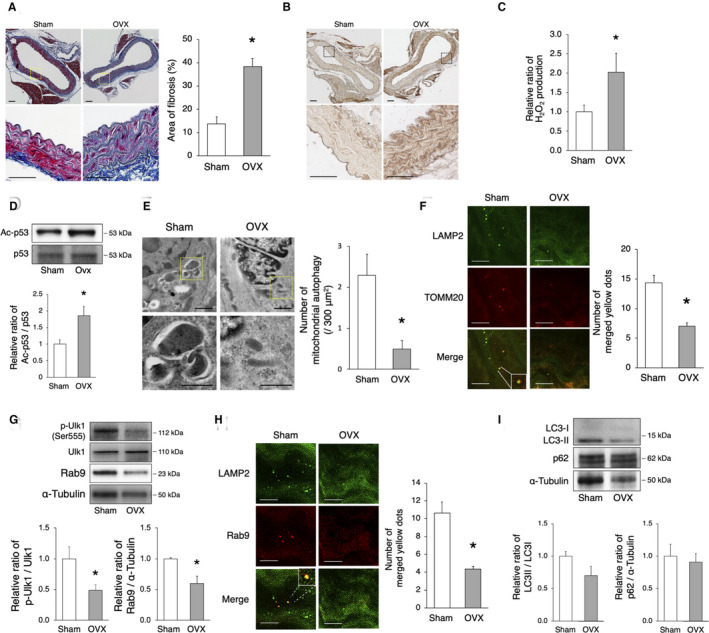
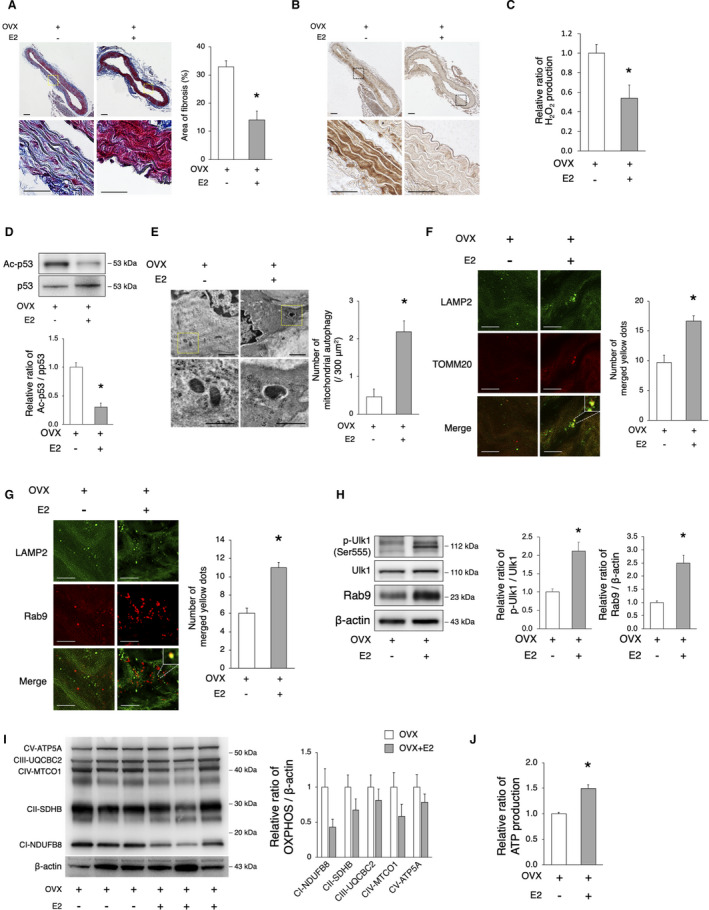
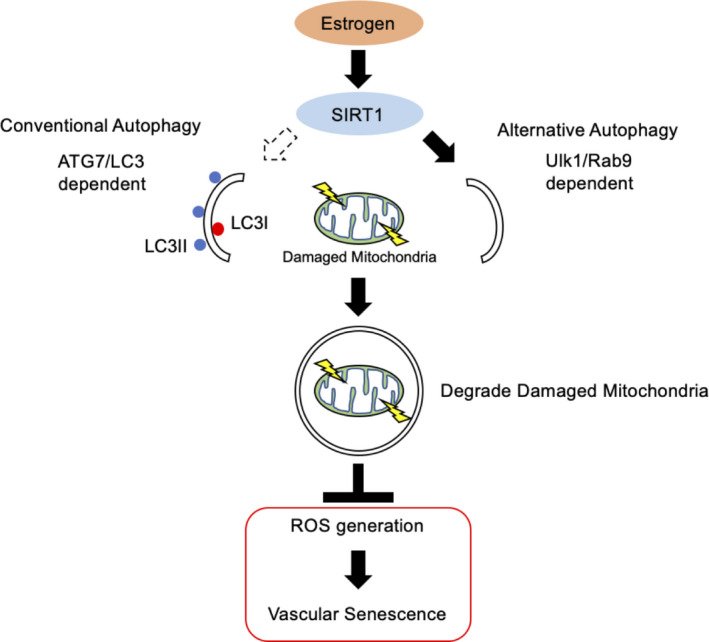
Background The risk of cardiovascular disease is known to increase after menopause. Mitochondria, which undergo quality control via mitochondrial autophagy, play a crucial role in the regulation of cellular senescence. The aim of this study was to investigate whether the effect of estrogen-mediated protection from senescence on arteries is attributed to the induction of mitochondrial autophagy. Methods and Results We used human umbilical vein cells, vascular smooth muscle cells, and 12-week-old female C57BL/6 mice. The administration of 17β-estradiol (E2) to cells inhibited cellular senescence and mitochondrial dysfunction. Furthermore, E2 increased mitochondrial autophagy, maintaining mitochondrial function, and retarding cellular senescence. Of note, E2 did not modulate LC3 (light chain 3), and ATG7 (autophagy related 7) deficiency did not suppress mitochondrial autophagy in E2-treated cells. Conversely, E2 increased the colocalization of Rab9 with LAMP2 (lysosomal-associated membrane protein 2) signals. The E2-mediated effects on mitochondrial autophagy were abolished by the knockdown of either Ulk1 or Rab9. These results suggest that E2-mediated mitochondrial autophagy is associated with Rab9-dependent alternative autophagy. E2 upregulated SIRT1 (sirtuin 1) and activated LKB1 (liver kinase B1), AMPK (adenosine monophosphate-activated protein kinase), and Ulk1, indicating that the effect of E2 on the induction of Rab9-dependent alternative autophagy is mediated by the SIRT1/LKB1/AMPK/Ulk1 pathway. Compared with the sham-operated mice, ovariectomized mice showed reduced mitochondrial autophagy and accelerated mitochondrial dysfunction and arterial senescence; these detrimental alterations were successfully rescued by the administration of E2. Conclusions We showed that E2-induced mitochondrial autophagy plays a crucial role in the delay of vascular senescence. The Rab9-dependent alternative autophagy is behind E2-induced mitochondrial autophagy.

Keywords: autophagy; estrogen; mitochondria; vascular senescence.


Conflict of interest statement

None.

Figures

Figure 1
Figure 1. Estrogen treatment delays cellular senescence and maintains mitochondrial function in HUVECs and VSMCs.
A, Representative images of SA‐β gal staining are shown. SA‐β gal‐positive cells increased with the increase in cell passages. The administration of E2 (10 nmol/L) decreased SA‐β gal‐positive cells. Scale bar=50 μm. *P<0.01 vs E2(−) (n=5 per group). Statistical analysis was performed using 2‐way analysis of variance. B, Immunoblots, and quantitative analysis results of p53, PAI‐1, and β‐actin are shown. The protein expression of p53 and PAI‐1 were lower in E2‐treated cells vs untreated cells. *P<0.05 vs E2(−) (n=3 per group). C, Representative images of SA‐β gal staining of passage 5 cells treated with E2 (10 nmol/L)+ICI 182780 (1 μmol/L) are shown. The administration of ICI attenuated the E2‐mediated delay of cellular senescence. Scale bar, 50 μm. *P<0.01 vs E2 (n=5 per group). D, Mitochondrial membrane potential was evaluated using JC‐1. Red indicates mitochondria in which the membrane potential is maintained, whereas green indicates depolarized mitochondria. The quantification of HUVECs and VSMCs with depolarized mitochondria is shown. Scale bar, 50 μm. *P<0.01 vs E2 (HUVECs, n=3 per group; VSMCs, n=5 per group). E, Left panel: TMRE staining for the assessment of mitochondrial membrane potential. Red indicates polarized mitochondria in which the membrane potential is maintained. Scale bar, 50 μm. Right panel: Mitochondrial ROS was evaluated using MitoSox Red. The level of mitochondrial ROS, as red signals, was lower in E2‐treated cells (n=4 per group). Scale bar, 25 μm. F, H2O2 production in HUVECs and VSMCs treated with or without E2 was evaluated using the Amplex Red Assay. *P<0.01 (HUVECs, n=3 per group; VSMCs, n=4 per group). All data are shown as the mean±SEM. E2 indicates 17β‐estradiol; HUVECs, human umbilical vein endothelial cells; PAI‐1, plasminogen activator inhibitor‐1; ROS, reactive oxygen species; SA‐β gal, senescence‐associated β‐galactosidase; TMRE, tetramethylrhodamine ethyl ester; and VSMCs, vascular smooth muscle cells.
Figure 2
Figure 2. E2‐induced mitochondrial autophagy.
A, Electron microscopy analyses of mitochondrial autophagy in HUVECs and VSMCs with or without E2 (upper panel, scale bar=1 μm). Enlarged images of the areas delineated by the dashed rectangles are shown below (scale bar=500 nm). The cells of each group were randomly selected from 3 independent experiments, and the number of mitochondria engulfed by autophagosomes was counted. The number of autophagosomes/autolysosomes engulfing mitochondria per cell was higher in E2‐treated cells. *P<0.01 vs E2(−). B, Representative images of LAMP2 (green) and TOMM20 (red) immunohistochemistry in HUVECs and VSMCs with or without E2. Thirty cells were evaluated per group, in the context of 3 independent experiments. The number of merged yellow signals was higher in E2‐treated cells. Scale bar=10 μm. *P<0.01 vs E2(−). C, Immunoblots and quantitative analysis results of LC3 and p62 are shown. No difference in LC3 and p62 was noted between the 2 groups (n=3 per group). D, Left panel: Representative images of LC3 (green) and LAMP2 (red) immunohistochemistry in VSMCs with or without E2. Thirty cells were evaluated per group, in the context of 3 independent experiments. The number of merged yellow signals was not different between the 2 groups. Scale bar=10 μm. Right panel: Representative images of LC3 (green) and TOMM20 (red) immunohistochemistry in VSMCs with or without E2. Thirty cells were evaluated per group, in the context of 3 independent experiments. The number of merged yellow signals was not different between the 2 groups. Scale bar=10 μm. E, Representative images of LAMP2 (green) and TOMM20 (red) immunohistochemistry in E2 or vehicle‐treated VSMCs transfected with siATG7 or siControl. Thirty cells were evaluated per group, in the context of 3 independent experiments. The number of merged yellow signals was not different in VSMCs transfected with siATG7 and siControl, either treated with vehicle or E2, respectively. N. S.; not significant. Statistical analysis was performed using 2‐way analysis of variance. Scale bar=10 μm. F, Electron microscopy analyses of mitochondrial autophagy in E2 or vehicle‐treated VSMCs transfected with siATG7 or siControl (upper panel, scale bar, 1 μm). Enlarged images of the areas delineated by the dashed rectangles are shown below (scale bar=500 nm). The cells of each group were randomly selected from 3 independent experiments, and the number of mitochondria engulfed by autophagosomes was counted. The number of autophagosomes/autolysosomes engulfing mitochondria per cell was not different in VSMCs transfected with siATG7 and siControl, either treated with vehicle or E2, respectively. N. S.; not significant. Statistical analysis was performed using 2‐way analysis of variance. All data are shown as the mean±SEM. E2 indicates 17β‐estradiol; HUVECs, human umbilical vein endothelial cells; LAMP2, lysosome‐associated membrane protein 2; LC3, light chain 3; TOMM20, translocase of outer mitochondrial membrane 20; and VSMCs, vascular smooth muscle cells.
Figure 3
Figure 3. E2‐induced Rab9‐dependent alternative autophagy.
A, Representative images of LAMP2 (green) and Rab9 (red) immunohistochemistry in HUVECs and VSMCs with or without E2. Thirty cells were evaluated per group, in the context of 3 independent experiments. The number of merged yellow signals was higher in E2‐treated cells. *P<0.01 vs E2(−). Scale bar=10 μm. B, Electron microscopy analyses of mitochondrial autophagy in E2‐treated VSMCs transfected with siRab9 or siControl (upper and middle panel, respectively, scale bar, 1 μm). Enlarged images of the areas delineated by the dashed rectangles are shown below (scale bar, 500 nm). The cells of each group were randomly selected from 3 independent experiments, and the number of mitochondria engulfed by autophagosomes was counted. The number of autophagosomes/autolysosomes engulfing mitochondria per cell was lower in E2‐treated cells transfected with siRab9. *P<0.01 vs siControl. C, Representative images of LAMP2 (green) and Rab9 (red) immunohistochemistry in E2‐treated VSMCs transfected with siRab9. Thirty cells were evaluated per group, in the context of 3 independent experiments. The number of Rab9 signals and merged yellow signals was lower in E2‐treated cells transfected siRab9. Scale bar, 10 μm. *P<0.01 vs siControl. D, Representative images of LAMP2 (green) and TOMM20 (red) immunohistochemistry in E2‐treated VSMCs transduced with siRab9. Thirty cells were evaluated per group, in the context of 3 independent experiments. The number of merged yellow signals was lower in E2‐treated cells transfected with siRab9. Scale bar, 10 μm. *P<0.01 vs siControl. E, Representative images of LAMP2 (green) and Rab9 (red) immunohistochemistry in E2‐treated VSMCs transfected with siUlk1. Thirty cells were evaluated per group, in the context of 3 independent experiments. The number of Rab9 signals and merged yellow signals was lower in E2‐treated cells transfected with siUlk1. Scale bar, 10 μm. *P<0.01 vs siControl. All data are shown as the mean±SEM. E2 indicates 17β‐estradiol; HUVECs, human umbilical vein endothelial cells; LAMP2, lysosome‐associated membrane protein 2; TOMM20, translocase of outer mitochondrial membrane 20; and VSMCs, vascular smooth muscle cells.
Figure 4
Figure 4. SIRT1 regulates E2‐mediated Rab9‐dependent alternative autophagy.
A, Immunoblots and quantitative analysis results of SIRT1 are shown. SIRT1 protein expression was higher in E2‐treated cells vs untreated cells. *P<0.05 vs E2(−); **P<0.01 vs E2(−) (n=3 per group). B, Representative immunoblots and quantitative analysis results of E2‐treated HUVECs and VSMCs with or without ICI 182780 (1 μmol/L) are shown. ICI 182780 decreased the protein expression of SIRT1. *P<0.05 vs E2(+) (HUVECs, n=3 per group; VSMCs, n=4 per group). C, Representative immunoblots and quantitative analysis results of E2‐treated HUVECs with or without G15 (20 μmol/L) are shown. G15 did not change the protein expression of SIRT1 (n=4 per group). D, Representative images of SA‐β gal staining of cells treated with E2 (10 nmol/L)+sirtinol (50 μmol/L) are shown. The number of SA‐β gal‐positive cells was increased after the administration of sirtinol. Scale bar, 50 μm. *P<0.05 vs E2(+) (n=5 per group). E, Electron microscopy analyses of mitochondrial autophagy in E2‐treated VSMCs with or without sirtinol (upper panel, scale bar, 1 μm). Enlarged images of the areas delineated by the dashed rectangles are shown below (scale bar, 500 nm). The cells of each group were randomly selected from 3 independent experiments, and the number of mitochondria engulfed by autophagosomes was counted. The number of autophagosomes/autolysosomes engulfing mitochondria per cell was lower in E2‐treated cells with sirtinol. *P<0.01 vs E2(+). F, Representative images of LAMP2 (green) and Rab9 (red) immunohistochemistry in E2‐treated VSMCs with sirtinol. Thirty cells were evaluated per group, in the context of 3 independent experiments. The number of Rab9 signals and merged yellow signals was lower in E2‐treated cells with sirtinol. Scale bar, 10 μm. *P<0.01 vs E2(+). G, Representative images of LAMP2 (green) and TOMM20 (red) immunohistochemistry in E2‐treated VSMCs with sirtinol. Thirty cells were evaluated per group, in the context of 3 independent experiments. The number of merged yellow signals was lower in E2‐treated cells with sirtinol. Scale bar, 10 μm. *P<0.01 vs E2(+). All data are shown as the mean±SEM. E2 indicates 17β‐estradiol; HUVECs, human umbilical vein endothelial cells; LAMP2, lysosome‐associated membrane protein 2; SA‐β gal, senescence‐associated β‐galactosidase; SIRT1, sirtuin 1; TOMM20, translocase of outer mitochondrial membrane 20; and VSMCs, vascular smooth muscle cells.
Figure 5
Figure 5. The SIRT1/LKB1/AMPK/Ulk1 axis is involved in the induction of alternative autophagy.
A, Representative immunoblots and quantitative analysis of LKB1, AMPK, Ulk1, and Rab9 in VSMCs with or without E2 treatment. E2 treatment activated LKB1, AMPK, Ulk1, and Rab9. *P<0.05 vs E2(−) (n=3 per group). B, Representative immunoblots and quantitative analysis of LKB1, AMPK, Ulk1, and Rab9 in E2‐treated VSMCs with or without sirtinol. The administration of sirtinol attenuated the activation of LKB1, AMPK, Ulk1, and Rab9 by E2. *P<0.05 vs E2(+) (n=3 per group). C, Representative immunoblots and quantitative analysis of AMPK, Ulk1, and Rab9 in E2‐treated VSMC with or without Compound C (10 μmol/L). The administration of Compound C attenuated the activation of AMPK, Ulk1, and Rab9 by E2. *P<0.05 vs E2(+) (n=3 per group). D, Representative images of Rab9 (red) immunohistochemistry in E2‐treated VSMCs with Compound C (10 μmol/L). Thirty cells were evaluated per group, in the context of 3 independent experiments. The number of Rab9 signals was lower in E2‐treated cells with Compound C. Scale bar, 10 μm. *P<0.01 vs E2(+). All data are shown as the mean±SEM. AMPK indicates adenosine monophosphate‐activated protein kinase; E2, 17β‐estradiol; LAMP2, lysosome‐associated membrane protein 2; LKB1, liver kinase B1; SIRT1, sirtuin 1; and VSMCs, vascular smooth muscle cells.
Figure 6
Figure 6. OVX promotes arterial senescence via the decrease of mitochondrial autophagy.
C57BL/6 mice were subjected to OVX or sham surgery. A, Assessment of aortic fibrosis in sham‐operated and OVX mice using the Masson’s trichrome staining 8 weeks after surgery. Enlarged images of the areas delineated by the dashed rectangles are shown below. The area of fibrosis was greater in OVX mice. Scale bar, 25 μm. *P<0.05 vs sham (n=3 per group). B, Representative images of 4‐HNE in sham‐operated and OVX mice. Immunoreactivity of 4‐HNE increased in the aorta of OVX mice compared with that of sham‐operated mice. C, The relative H2O2 production by isolated mitochondria from the aorta of sham‐operated and OVX mice 8 weeks after surgery was evaluated using the Amplex Red Assay. H2O2 production was higher in OVX mice. *P<0.05 vs sham (n=3 per group). D, Representative immunoblots and quantitative analysis of Ac‐p53 and p53 in sham‐operated and OVX mice. The expression of Ac‐p53 was higher in OVX mice than that in sham‐operated mice. *P<0.05 vs sham (n=4 per group). E, Electron microscopy images of the aorta from sham‐operated and OVX mice (upper panel, scale bar, 1 μm). Enlarged images of the areas delineated by the dashed rectangles are shown below (scale bar, 500 nm). More than 900 μm2 of the aorta of each mouse were screened in a random fashion; 3 samples per group were evaluated and the number of mitochondria engulfed by autophagosomes was counted. The number of mitochondrial autophagy was lower in OVX mice. *P<0.05 vs sham. F, Representative images of LAMP2 (green) and TOMM20 (red) immunohistochemistry of the aorta in sham‐operated and OVX mice. The merged yellow signals were lower in OVX mice. Scale bar, 5 μm. *P<0.05 vs sham (n=3 per group). G, Representative immunoblots and quantitative analysis of Ulk1 and Rab9 in sham‐operated and OVX mice. The expression of activated Ulk1 and Rab9 was higher in sham‐operated vs OVX mice. *P<0.05 vs sham (n=4 per group). H, Representative images of LAMP2 (green) and Rab9 (red) immunohistochemistry of the aorta in sham‐operated and OVX mice. The number of yellow signals was lower in OVX mice. Scale bar, 5 μm. *P<0.05 vs sham (n=3 per group). I, Representative immunoblots and quantitative analysis of LC3 and p62 in sham and OVX mice. The expression of both LC3 and p62 was not different between the 2 groups (n=4 per group). All data are shown as the mean±SEM. 4‐HNE indicates 4‐hydroxynonenal; LAMP2, lysosome‐associated membrane protein 2; LC3, light chain 3; OVX, ovariectomy; and TOMM20, translocase of outer mitochondrial membrane 20.
Figure 7
Figure 7. Estrogen rescues OVX‐induced arterial senescence via the induction of mitochondrial autophagy.
OVX mice were implanted with either E2 or control pellets for 8 weeks. A, Assessment of aortal fibrosis in OVX and OVX+E2 mice using the Masson’s trichrome staining 8 weeks after implantation. Enlarged images of the areas delineated by the dashed rectangles are shown below. The area of fibrosis was smaller in OVX+E2 mice. Scale bar, 25 μm. *P<0.05 vs OVX (n=3 per group). B, Representative images of 4‐HNE in OVX and OVX+E2 mice. Immunoreactivity of 4‐HNE increased in the aorta of OVX mice compared with that of OVX+E2 mice. C, The relative H2O2 production by isolated mitochondria from the aorta of OVX and OVX+E2 mice 8 weeks after implantation was evaluated using the Amplex Red assay. H2O2 production was lower in OVX+E2 mice. *P<0.05 vs OVX (n=3 per group). D, Representative immunoblots and quantitative analysis of Ac‐p53 and p53 in OVX and OVX+E2 mice. The expression of Ac‐p53 in OVX+E2 mice was lower than that in OVX mice. *P<0.05 vs sham (n=3 per group). E, Electron microscopy images of the aorta from OVX and OVX+E2 mice (upper panel, scale bar, 1 μm). Enlarged images of the areas delineated by the dashed rectangles are shown below (scale bar, 500 nm). More than 900 μm2 of the aorta of each mouse were screened in a random fashion; 3 samples per group were evaluated and the number of mitochondria engulfed by autophagosomes was counted. The number of mitochondrial autophagy was higher in OVX+E2 mice. *P<0.05 vs OVX. F, Representative images of LAMP2 (green) and TOMM20 (red) immunohistochemistry in OVX and OVX+E2 mice. The merged yellow signals were higher in OVX+E2 mice. Scale bar, 5 μm. *P<0.05 vs OVX (n=3 per group). G, Representative images of LAMP2 (green) and Rab9 (red) immunohistochemistry in OVX and OVX+E2 mice. The merged yellow signals were higher in OVX+E2 mice. Scale bar, 5 μm. *P<0.05 vs OVX (n=3 per group). H, Representative immunoblots and quantitative analysis of Ulk1 and Rab9 in OVX and OVX+E2 mice. The expression of activated Ulk1 and Rab9 in OVX+E2 mice was higher than that in OVX mice. *P<0.05 vs sham (n=3 per group). I, Representative immunoblots and quantitative analysis of total OXPHOS in OVX and OVX+E2 mice. The expression of total OXPHOS was not different between the 2 groups (n=3 per group). J, The relative ATP production of isolated mitochondria from the aorta of OVX and OVX+E2 mice 8 weeks after implantation was evaluated. ATP production was higher in OVX+E2 mice. *P<0.05 vs OVX (n=3 per group). All data are shown as the mean±SEM. 4‐HNE indicates 4‐hydroxynonenal; E2, 17β‐estradiol; LAMP2, lysosome‐associated membrane protein 2; OVX, ovariectomy; OXPHOS, oxidative phosphorylation; and TOMM20, translocase of outer mitochondrial membrane 20.
Figure 8
Figure 8. The proposed mechanism of the effect of estrogen on the delay of arterial senescence.
Estrogen increases mitochondrial autophagy, contributing to mitochondrial quality control and delaying cellular senescence. Rab9 dependent alternative autophagy, but not conventional autophagy, is the predominant form of E2‐induced mitochondrial autophagy. The effect of E2 on the induction of Rab9 is mediated by the SIRT1/LKB1/AMPK/Ulk1 pathway. As a result, mitochondrial autophagy derived from SIRT1/LKB1/AMPK/Ulk1/Rab9‐mediated alternative autophagy plays a key role in the effect of estrogen on the delay of vascular senescence. AMPK indicates adenosine monophosphate‐activated protein kinase;ATG7, autophagy related 7; E2, 17β‐estradiol; LC3, light chain 3; LKB1, liver kinase B1; ROS, reactive oxygen species; and SIRT1, sirtuin 1.

Comment in

References

    1. Sheffield‐Moore M, Urban RJ. An overview of the endocrinology of skeletal muscle. Trends Endocrinol Metab. 2004;15:110–115. DOI: 10.1016/j.tem.2004.02.009. - DOI - PubMed
    1. Stevenson JC. A woman’s journey through the reproductive, transitional and postmenopausal periods of life: impact on cardiovascular and musculo‐skeletal risk and the role of estrogen replacement. Maturitas. 2011;70:197–205. - PubMed
    1. Viña J, Lloret A. Why women have more Alzheimer’s disease than men: gender and mitochondrial toxicity of amyloid‐β peptide. J Alzheimer’s Dis. 2010;20:S527–S533. DOI: 10.3233/JAD-2010-100501. - DOI - PubMed
    1. Barton M, Meyer MR, Haas E. Hormone replacement therapy and atherosclerosis in postmenopausal women: does aging limit therapeutic benefits? Arterioscler Thromb Vasc Biol. 2007;27:1669–1672. DOI: 10.1161/ATVBAHA.106.130260. - DOI - PubMed
    1. Xing D, Nozell S, Chen YF, Hage F, Oparil S. Estrogen and mechanisms of vascular protection. Arterioscler Thromb Vasc Biol. 2009;29:289–295. DOI: 10.1161/ATVBAHA.108.182279. - DOI - PMC - PubMed

Publication types

Substances

LinkOut - more resources