. 2021 Mar 15;131(6):e136098.
doi: 10.1172/JCI136098.

N-cadherin upregulation mediates adaptive radioresistance in glioblastoma

Affiliations

N-cadherin upregulation mediates adaptive radioresistance in glioblastoma

Satoru Osuka et al. J Clin Invest. .

Abstract

Glioblastoma (GBM) is composed of heterogeneous tumor cell populations, including those with stem cell properties, termed glioma stem cells (GSCs). GSCs are innately less radiation sensitive than the tumor bulk and are believed to drive GBM formation and recurrence after repeated irradiation. However, it is unclear how GSCs adapt to escape the toxicity of repeated irradiation used in clinical practice. To identify important mediators of adaptive radioresistance in GBM, we generated radioresistant human and mouse GSCs by exposing them to repeat cycles of irradiation. Surviving subpopulations acquired strong radioresistance in vivo, which was accompanied by a reduction in cell proliferation and an increase in cell-cell adhesion and N-cadherin expression. Increasing N-cadherin expression rendered parental GSCs radioresistant, reduced their proliferation, and increased their stemness and intercellular adhesive properties. Conversely, radioresistant GSCs lost their acquired phenotypes upon CRISPR/Cas9-mediated knockout of N-cadherin. Mechanistically, elevated N-cadherin expression resulted in the accumulation of β-catenin at the cell surface, which suppressed Wnt/β-catenin proliferative signaling, reduced neural differentiation, and protected against apoptosis through Clusterin secretion. N-cadherin upregulation was induced by radiation-induced IGF1 secretion, and the radiation resistance phenotype could be reverted with picropodophyllin, a clinically applicable blood-brain-barrier permeable IGF1 receptor inhibitor, supporting clinical translation.

Keywords: Brain cancer; Cell migration/adhesion; Oncology; Radiation therapy.


Conflict of interest statement

Conflict of interest: The authors have declared that no conflict of interest exists.

Figures

Figure 1
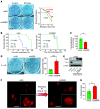
Figure 1. Radioresistant GSCs display increased cell-cell adhesion, slower proliferation, and an elevation of stemness properties.
(A) Clonogenic survival assay for mGS and mGSRR subjected to irradiation (IR) or control without IR. Left: representative images of colonies formed by surviving cells 13 days after a single dose (4 Gy) of irradiation are shown. Right: fraction of surviving cells after radiation doses of 1, 3, or 5 Gy. Scale bar: 10 mm. (B) Survival curves for mice implanted with 1000 tumor cells (mGS or mGSRR) and subjected to whole-brain irradiation consisting of a daily dose of 2 Gy from days 3 to 7 after cell implantation (10 Gy total). Log-rank test. (C) Cell proliferation analysis for mGS and mGSRR after 72 hours. (D) Self-renewal ability of mGS and mGSRR as evaluated by sphere formation assay in soft agar. Scale bar: 10 mm. (E) Western blot showing expression of stem cell marker (Olig2) progressively increases and neural differentiation maker (Tuj1) is decreased following repeated cycles of irradiation in mGS cells. All blots show representative images (n = 3). (F) Representative images of mGS and mGSRR cells stably expressing a fluorescence marker (mCherry) and grown as spheres in neural stem cell medium are shown. Scale bars: 200 μm. (G) Single-cell suspension of mGS and mGSRR cells were cultured for 4 hours, and then the number of nonattached cells determined by differential centrifugation. *P < 0.05, **P < 0.01, ***P < 0.001, 2-tailed Student’s t tests unless otherwise indicated.
Figure 2
Figure 2. Fractionated irradiation increases N-cad expression in GSCs and N-cad drives the radioresistance phenotype.
(A) Western blot showing expression of cell-cell adhesion molecules following 6 to 12 cycles of 5 Gy irradiation in mGS cells. (B) Fluorescence microscopy shows that N-cad expression is increased on the cell surface of mGSRR cells (green). mGS and mGSRR cells are stably expressing mCherry (red). Nuclei were counterstained with Hoechst 33342 (blue). Scale bars: 25 μm. (C) Western blot showing expression of N-cad following 3 cycles of irradiation (1–2 Gy) in human GSCs, MGG4. (D) Western blot showing expression of N-cad, Tuj1, and Olig2 in human GSCs (MGG4) transfected with either control (Ctrl) or human N-cad expression vectors (OE). (E) Cell proliferation analysis for MGG4-Ctrl and MGG4 N-cad OE cells. (F) Clonogenic survival assay showing the surviving fraction of MGG4+/– N-cad cells after radiation doses of 1, 3, or 5 Gy. (G) Schematic showing experimental design to establish radioresistant PDX models. Subcutaneous tumors were exposed to repeated irradiation (2 Gy × 6 = 12 Gy total over 2 weeks). (H) Western blot showing expression of N-cad, Tuj1, and Olig2 in primary (P) or adapted to radiation therapy (RT) tumors of 2 PDX models. (I) Kaplan-Meier curve shows that increased N-cad mRNA expression is correlated with reduced survival in the TCGA-GBM data set. Log-rank test. High and low are defined as the top and bottom 15%. All blots show representative images (n = 3 or more). *P < 0.05, **P < 0.01, 2-tailed Student’s t tests unless otherwise indicated. The intensity of the immunoreactive bands was quantified in 3 independent experiments and the average is indicated below the blot.
Figure 3
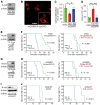
Figure 3. Knockout of N-cad in radioresistant GSCs annuls their radioresistance.
(A) Western blot showing expression of N-cad in mGSRR and mGSRR with CRISPR/cas9-mediated knockout of CDH2 (N-cad–KO). (B) Representative neurospheres of mGSRR N-cad–KO cells expressing a fluorescence marker (mCherry) grown in neural stem cell medium. Scale bar: 200 μm. (C) Cell proliferation analysis for mGS, mGSRR, and mGSRR N-cad–KO cells after 72 hours. *P < 0.05, Tukey’s HSD test. (D) Self-renewal ability of mGS, mGSRR, and mGSRR N-cad–KO as evaluated by sphere formation assay. ***P < 0.001, Tukey’s HSD test. (E) Western blot showing expression of N-cad in mGS N-cad–KO with or without N-cad restoration. (F) Survival curves for mice implanted with 1000 cells (mGS N-cad–KO with or without N-cad restoration) and subjected to whole-brain irradiation consisting of a daily dose of 2 Gy from days 3 to 7 after cell implantation (10 Gy total). Log-rank test. (G) Western blot showing expression of N-cad in mGSRR N-cad–KO cells with or without N-cad restoration. (H) Survival curves for mice implanted with 1000 cells (mGSRR N-cad–KO with or without N-cad restoration) and subjected to whole-brain irradiation (2 Gy × 5 days). Log-rank test. (I) Western blot showing expression of N-cad in JX39-RT cells transfected with control (Ctrl) or N-cad shRNAs (clones #1 and #2). (J) Survival curves for mice implanted with 5 × 10⁵ cells (JX39-RT with shCtrl or shN-cad #2) and subjected to whole-brain irradiation consisting of a dose of 2 Gy every other day over 2 weeks (12 Gy total). Log-rank test. All blots show representative images (n = 3).
Figure 4
Figure 4. Elevated N-cad leads to increased levels of cell-surface β-catenin, resulting in suppression of Wnt/β-catenin–mediated proproliferative and neuronal differentiation signaling.
(A) Western blot showing expression changes of several N-cad binding catenins following 6–12 cycles of irradiation (5 Gy) in mGS cells. (B) Fluorescence microscopy shows that β-catenin (green) selectively coaccumulates with N-cad (red) on the cell surface of mGSRR but not mGS cells. Nuclei were counterstained with Hoechst 33342 (blue). Scale bars: 25 μm. (C) Wnt/β-catenin regulated transcriptional activity in mGS and mGSRR cells measured through transient transfection with a luciferase reporter driven by a WT (TOP) or mutant (FOP) TCF binding site. ***P < 0.001, 2-tailed Student’s t test. (D) TOP/FOP ratio showing Wnt/β-catenin activity in parental N-cad–overexpressing and N-cad–KO mGS cells. **P < 0.01, ***P < 0.001, Tukey’s HSD test. (E) Microarray analysis showing that mRNA expression of multiple Wnt target genes is suppressed in mGSRR compared with mGS cells. Each group contains 2 independent replicates (n = 2). (F) qRT/PCR showing that NeuroD1, Ngn1, and Brn3a mRNAs are reduced in mGSRR cells. Two-tailed Student’s t test. (G) Western blot showing expression change of β-catenin (pan and non-phospho), c-Myc, and Tuj1 by N-cad–overexpressing and N-cad–KO mGS cells. All blots show representative images (n = 3 or more).
Figure 5
Figure 5. The CBR domain of N-cad is essential for radioresistance of GSCs.
(A) Diagram showing expression vectors for N-cad WT and ΔCBR, a mutant lacking the β-catenin binding region (CBR). JM, p120-catenin binding site. (B) Fluorescence microscopy shows that β-catenin accumulates at the cell surface of mGS N-cad–KO cells when reconstituted with WT N-cad, but not ΔCBR N-cad. Nuclei were counterstained with Hoechst 33342 (blue). Scale bars: 25 μm. (C) Western blot showing that restoration of WT but not ΔCBR N-cad in GSCs knocked out for N-cad strongly stabilizes β-catenin expression, which reduces the expression of Wnt/β-catenin target genes c-Myc and neuronal marker Tuj-1. All blots show representative images (n = 3). (D) Clonogenic survival assay shows reconstitution with WT, but not ΔCBR N-cad increases survival in mGS-N-cad KO cells. **P < 0.01, ***P < 0.001, Tukey’s HSD test. (E) Wnt/β-catenin transcriptional activity (TOP/FOP luciferase reporter ratio) is strongly suppressed in mGS N-cad–KO cells when reconstituted with WT N-cad, but only partially with ΔCBR N-cad. *P < 0.05, **P < 0.01, ***P < 0.001, Tukey’s HSD test. (F) Cell proliferation analysis for mGS N-cad–KO, with or without reconstitution with WT or ΔCBR N-cad. **P < 0.01, ***P < 0.001, Tukey’s HSD test.
Figure 6
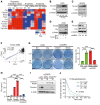
Figure 6. Enhanced N-cad elevates Clusterin expression and protects against radiation-induced apoptosis.
(A) Heatmap comparing 9 gene mRNA expression measured by RNA-seq analysis in untreated mGS cells (Ctrl), in mGS cells after 6–12 cycles of fractionated irradiation with 5 Gy (Ct, 30 Gy, 45 Gy, and 60 Gy total dose), in mGS or mGSRR N-cad–KO cells (mGS N-cad–KO #1, #2, and mGSRR N-cad–KO), with or without N-cad reconstitution (OE). Two independent replicates per cell line (n = 2). (B and C) Western blot showing expression of N-cad and Clu are gradually increased following mouse GS (B) and human MGG4 (C) adaptation to fractionated irradiation. (D) Western blot showing expression of Clu is suppressed by N-cad–KO and restored by stable N-cad transfection in mGS cells. (E) Western blot showing expression of Clu is suppressed by shRNA-mediated knockdown of N-cad in JX39-RT radioresistant PDX cells. (F) CDH2 and CLU mRNA expression correlate in GBM (TCGA database). (G) Clonogenic survival assay for mGS cells transfected with control or Clu expression vectors and mGSRR cells transfected with shCtrl or shClu expression vectors with or without a single dose (3 Gy) of IR. Left: representative images of colonies formed by surviving cells 13 days after irradiation. Scale bar: 10 mm. Right: quantification of the fraction of surviving colony-forming cells. ***P < 0.001, Tukey’s HSD test. (H) ELISA assay showing that Clu secretion is remarkably increased by mGSRR compared with mGS cells and this is strongly suppressed by N-cad knockout. **P < 0.01, ***P < 0.001, Tukey’s HSD test. (I) Western blot showing that suppression of Clu expression by shRNA or as a result of N-cad knockout increases PARP cleavage in mGSRR cells. (J) Kaplan-Meier curve shows that increased CLU mRNA expression is correlated with poor outcome in the TCGA-GBM data set. High and low are defined as top and bottom 15%. All blots show representative images (n = 3).
Figure 7
Figure 7. IGF-1 augments N-cad expression after radiation therapy.
(A) qRT/PCR showing that mGSRR cells display increased Cdh2 and decreased Cdh1 mRNA expression compared with mGS. Two-tailed Student’s t test. (B) Western blot showing expression of Slug, Snail1, and Zeb1 are gradually increased upon repeated irradiation in mGS cells. (C) Western blot showing that Snail overexpression induces elevation of N-cad, Olig2, and Zeb1, and suppression of Tuj1 in mGS cells. (D) Wnt/β-catenin transcriptional activity is suppressed in mGSRR and mGS with Snail1 overexpression (OE) compared with mGS cells. ***P < 0.001, Tukey’s HSD test. (E) Clonogenic survival assay shows mGS Snail1 OE cells have a higher survival rate than mGS cells. Two-tailed Student’s t test. *P < 0.05, **P < 0.01. (F) Western blot showing increased N-cad, β-catenin, Slug, and Zeb1 expression 2 days after mouse recombinant IGF1 (100 ng/mL), but not TGF-β1 (10 ng/mL) treatment in mGS cells. (G) Western blot showing IGF1 overexpression increases N-cad, β-catenin, Zeb1, and IGF1R expression in mGS cells. (H) Survival curves for mice implanted with 1000 cells (GS with IGF1 expression vector) and subjected to whole-brain irradiation (2 Gy/day, days 3 to 7, 10 Gy total). (I) Left: schematic showing experimental design for clonogenic survival assay with repeated irradiation. Single mGS cells seeded in agarose medium were exposed to repeated irradiation (5 doses of 4 Gy, every 3 days) with or without drug rescue. IGF1R (AEW541 0.5 μM; PPP 0.2 μM) and TGF-β1 (LY2157299 10 μM, SB431542 10 μM) inhibitors were used. Right: quantification of percentage of surviving colonies shows that IGF1R inhibitors selectively decreased survival rate. Drugs alone had no effect on colony formation (data not shown). ***P < 0.001, Dunnett’s test. (J) Mice implanted orthotopically with mGSRR cells had a survival benefit after whole-brain irradiation (2 Gy × 5 days) with adjuvant PPP (15 mg/kg, i.p. twice a day from day 3–7) in contrast to vehicle control, only IR or PPP alone (8 mice/group; log-rank test). All blots show representative images (n = 3 or more).

Similar articles

Cited by

References

    1. Schonberg DL, et al. Brain tumor stem cells: Molecular characteristics and their impact on therapy. Mol Aspects Med. 2014;39:82–101. doi: 10.1016/j.mam.2013.06.004. - DOI - PMC - PubMed
    1. Hadjipanayis CG, Van Meir EG. Brain cancer propagating cells: biology, genetics and targeted therapies. Trends Mol Med. 2009;15(11):519–530. doi: 10.1016/j.molmed.2009.09.003. - DOI - PMC - PubMed
    1. Lathia JD, et al. Cancer stem cells in glioblastoma. Genes Dev. 2015;29(12):1203–1217. doi: 10.1101/gad.261982.115. - DOI - PMC - PubMed
    1. Skvortsova I, et al. Radiation resistance: cancer stem cells (CSCs) and their enigmatic pro-survival signaling. Semin Cancer Biol. 2015;35:39–44. doi: 10.1016/j.semcancer.2015.09.009. - DOI - PubMed
    1. Vogin G, Foray N. The law of Bergonié and Tribondeau: a nice formula for a first approximation. Int J Radiat Biol. 2013;89(1):2–8. doi: 10.3109/09553002.2012.717732. - DOI - PubMed

Publication types

MeSH terms