. 2021 Jun 25;38(7):2854-2868.
doi: 10.1093/molbev/msab075.

Directed Evolution of an Enhanced POU Reprogramming Factor for Cell Fate Engineering

Affiliations

Directed Evolution of an Enhanced POU Reprogramming Factor for Cell Fate Engineering

Daisylyn Senna Tan et al. Mol Biol Evol. .

Abstract

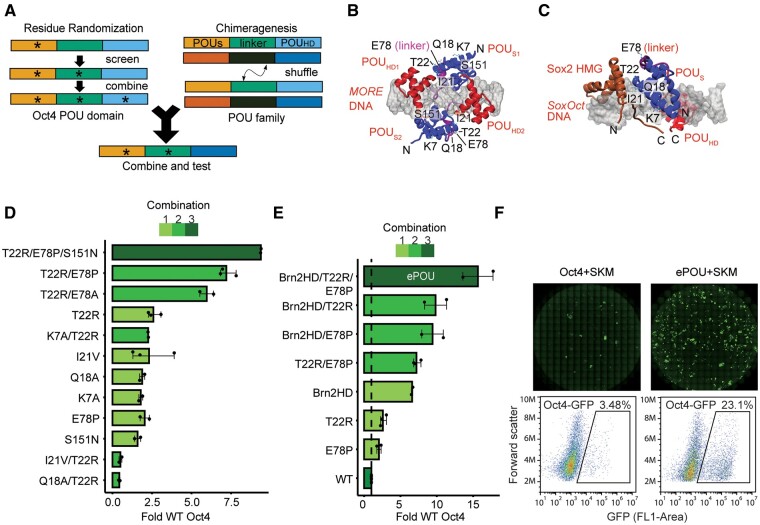
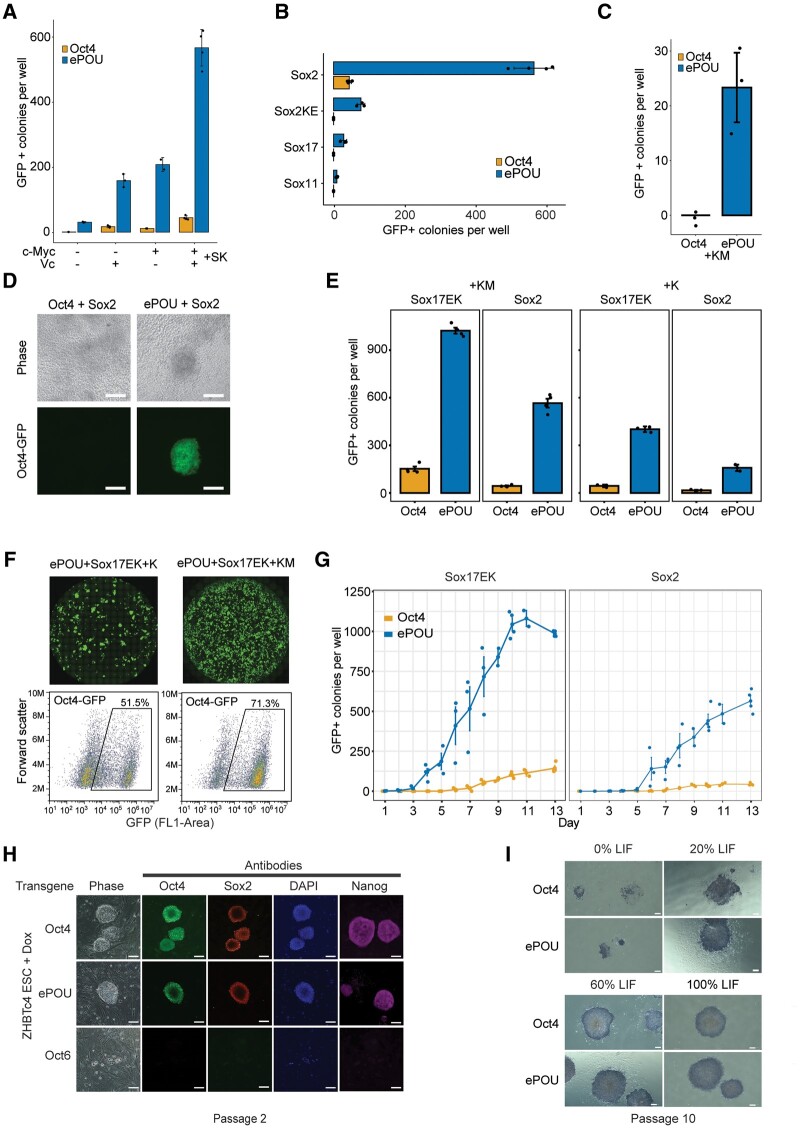
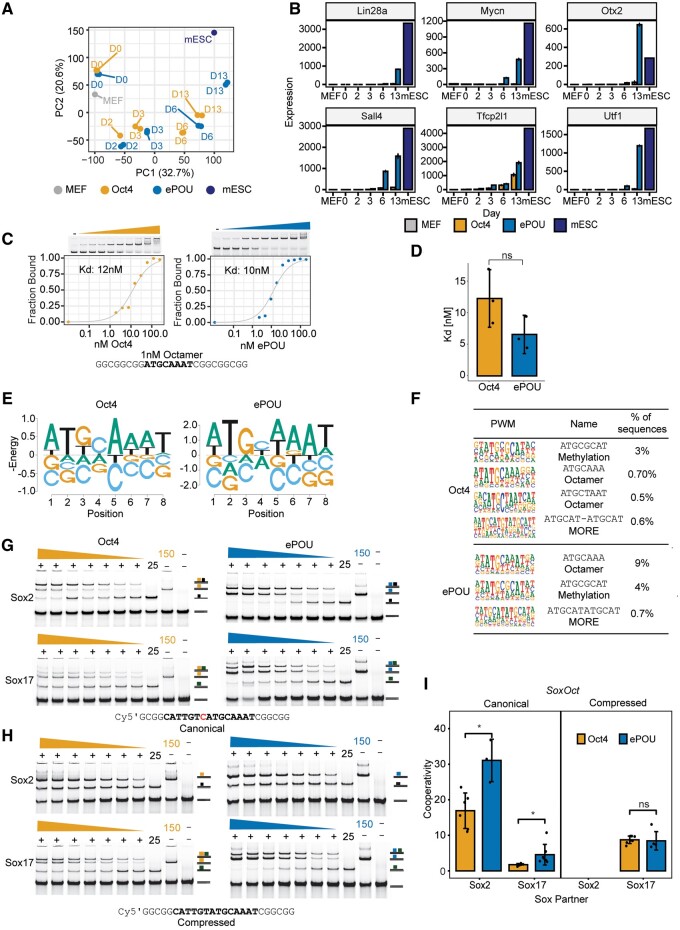
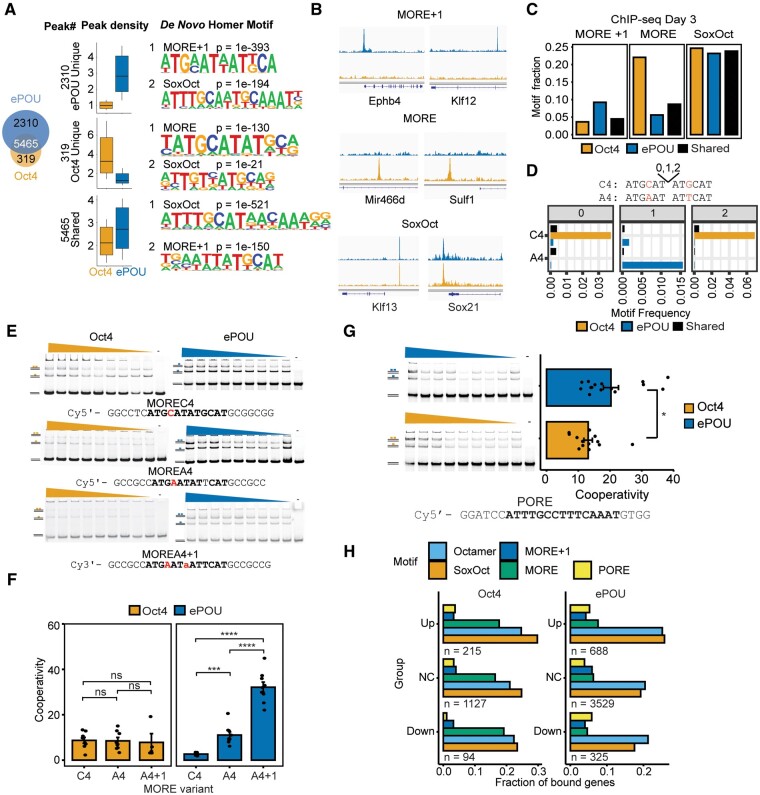
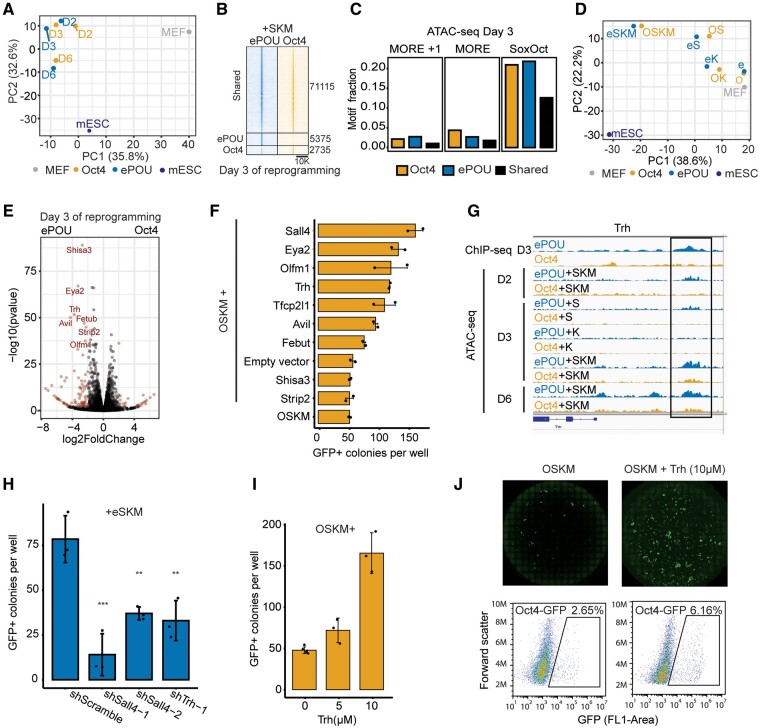
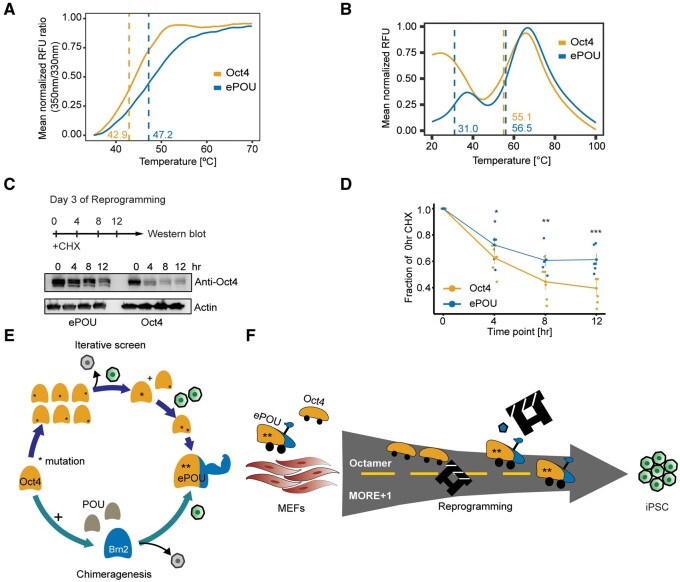
Transcription factor-driven cell fate engineering in pluripotency induction, transdifferentiation, and forward reprogramming requires efficiency, speed, and maturity for widespread adoption and clinical translation. Here, we used Oct4, Sox2, Klf4, and c-Myc driven pluripotency reprogramming to evaluate methods for enhancing and tailoring cell fate transitions, through directed evolution with iterative screening of pooled mutant libraries and phenotypic selection. We identified an artificially evolved and enhanced POU factor (ePOU) that substantially outperforms wild-type Oct4 in terms of reprogramming speed and efficiency. In contrast to Oct4, not only can ePOU induce pluripotency with Sox2 alone, but it can also do so in the absence of Sox2 in a three-factor ePOU/Klf4/c-Myc cocktail. Biochemical assays combined with genome-wide analyses showed that ePOU possesses a new preference to dimerize on palindromic DNA elements. Yet, the moderate capacity of Oct4 to function as a pioneer factor, its preference to bind octamer DNA and its capability to dimerize with Sox2 and Sox17 proteins remain unchanged in ePOU. Compared with Oct4, ePOU is thermodynamically stabilized and persists longer in reprogramming cells. In consequence, ePOU: 1) differentially activates several genes hitherto not implicated in reprogramming, 2) reveals an unappreciated role of thyrotropin-releasing hormone signaling, and 3) binds a distinct class of retrotransposons. Collectively, these features enable ePOU to accelerate the establishment of the pluripotency network. This demonstrates that the phenotypic selection of novel factor variants from mammalian cells with desired properties is key to advancing cell fate conversions with artificially evolved biomolecules.

Keywords: POU; cell fate conversion; molecular evolution; protein engineering; reprogramming; transcription factor.


Figures

Fig. 1.
Fig. 1.
Identification of an evolved and enhanced POU factor through iterative phenotypic selection. (A) Scheme of the iterative screen to evolve the Oct4 scaffold by residue randomization and POU family chimeragenesis. (B, C) Structural model of (B) the Oct4 homodimer on MORE DNA and (C) a Sox2/Oct4 heterodimer on the SoxOct DNA. The six mutated residues (K7, Q18, I21, T22, E78, and S151) are labeled when visible. (D) iPSC colony count data relative to WT Oct4 for selected single, double, and triple combinations of mutations. (E) iPSC colony count data relative to WT Oct4 for chimeric POU factors point mutated variants and combinations thereof. The variant composed of the Brn2-POUHD plus T22R/E78P performed best. The variant was subsequently termed “ePOU” and selected for further characterization. (F) Whole-well scans showing Oct4-GFP+ colonies (upper panel) and cells sorted for GFP fluorescence (lower panel) using FACS. In (DE), data are shown as mean of 2–3 biological replicates (three technical replicates each) with the range shown as error bars. POUS, POU Specific; POUHD, POU Homeodomain; HMG, High Mobility Group; O, Oct4; S, Sox2; K, Klf4; M, c-Myc; MORE, More palindromic Oct factor Recognition Element; iPSC, induced pluripotent stem cells.
Fig. 2.
Fig. 2.
ePOU outperforms Oct4 in a range of reprogramming conditions. (AC) Colony count data of pluripotency reprogramming experiments: (A) in the absence or presence of c-Myc and Vitamin C, (B) using Sox factors that compromise iPSC generation in the presence of WT Oct4 (Sox2KE, Sox17, and Sox11) in four-factor conditions, and (C) Three-factor conditions omitting Sox factors. (D) Oct4-GFP+ fluorescence images of iPSC colonies generated with two-factor reprogramming of Oct4+Sox2 (left) and ePOU+Sox2 (right) cocktails (scale = 100µm). (E) Oct4-GFP+ colony count data for reprogramming experiments to evaluate synergies of eSOX (Sox17EK) and ePOU in the absence or presence of c-Myc. (F) Whole well Oct4-GFP fluorescence scans and fluorescence-activated cell sorting (FACS) with GFP channel for ePOU/Sox17EK combinations in the absence or presence of c-Myc. (G) Time course of GFP+ colony counts from day 1 to day 13 in four-factor conditions. (H) Colonies of ZHBTc4 ESCs transduced with Oct4, ePOU, or Oct6 in the presence of Dox and 100% LIF (10 ng/ml) after two passages, stained with indicated antibodies (scale = 80 µm). (I) Alkaline phosphatase staining of ZHBTc4 ESC colonies transduced with Oct4 or ePOU at varying concentrations of LIF at passage 10 (scale = 200µm). In (AC, E), data are mean ± SEM of three biological replicates with 2–3 technical replicates each. Colonies are counted at day 13 of reprogramming. O, Oct4; S, Sox2; K, Klf4; M, c-Myc; Sox2KE, Sox2 K57E mutant defective in Oct4 heterodimerization; Sox17EK, Sox17 E57K mutant with enhanced pluripotency reprogramming capacity; ESC, embryonic stem cells; LIF, Leukemia inhibitory factor; Dox, doxycycline.
Fig. 3.
Fig. 3.
ePOU accelerates reprogramming without switching reprogramming trajectories, monomeric DNA specificity or Sox partners. (A) Principal-component analysis (PCA) of global gene expression profiles determined by RNA-seq for cells transduced with Oct4 or ePOU+SKM at days 0, 2, 3, 6, and 13 along with public data sets of MEFs (GSE103979) (Malik et al. 2019) and mESC (GSE93029) (Li et al. 2017). (B) Expression of six selected pluripotency-related genes. (C, D) (C) Binding of ePOU and Oct4 to canonical octamer DNA. Varying protein concentrations (0–500 nM) were incubated with 1 nM fluorescently labeled DNA. Binding isotherms and dissociation constants (Kd) are shown under the gels. (D) Kd’s from three independent titration EMSAs. (E) Energy logos derived from Spec-seq using a set of sequences with one nucleotide difference to the canonical octamer motif (ATGCAAAT). Note that the vertical axis is -Energy so that the highest affinity bases are on top and each column is normalized to a mean of 0. (F) Top enriched motifs in the third cycle of high throughput-SELEX for Oct4 and ePOU. Motifs shown are the octamer, MORE and methylation motif (a palindromic motif with a CpG methylation site). (GI) Heterodimer EMSAs with 50 nM Cy5 labeled DNA probes for (G) canonical and (H) compressed SoxOct DNA elements to monitor the complex formation of ePOU (blue) or Oct4 (orange) with Sox2 (black square) and Sox17 (green square). (I) Quantifications of heterodimer EMSAs and calculation of cooperativity factors according to (Ng et al. 2012). In (D, I), data are shown as mean ± SD (n = 3–5). * P-value < 0.05 from an unpaired t-test. MEF, mouse embryonic fibroblasts; mESC, mouse embryonic stem cells; MORE, More palindromic Oct factor Recognition Element.
Fig. 4.
Fig. 4.
ePOU preferentially targets a MORE motif variant as a homodimer. (A) Left: Venn diagram for ChIP-seq peaks of Oct4 and ePOU at day 3 of reprogramming defined using MAnorm (Shao et al. 2012). Center: Normalized Oct4 and ePOU ChIP-seq signals. Right: Top two de novo motifs for each peak category. Boxes represent the interquartile range with a horizontal median line. Whiskers extend up to 1.5 times the interquartile range. (B) Genome browser tracks of Oct4 and ePOU ChIP-seq peaks at selected gene loci containing matches to indicated motifs. Genomic coordinates are listed in supplementary table S5, Supplementary Material online. (C, D) Motif occurrences within each peak category in A determined by (C) PWM scanning and (D) text search with perfect matches to MORE subtypes A4 and C4 with spacers 0–2. (EG) (E) EMSAs using MORE variants MOREC4, MOREA4, and MOREA4 + 1. Dimeric and monomeric states are marked. (F) Homodimer cooperativity factors determined by densitometric analysis as in (Jerabek et al. 2017). (G) EMSAs using PORE DNA and corresponding homodimer cooperativity factors. Data are shown as mean ± SEM (n = 5–15). *, ***, **** P-value <0.05, 0.001, and 0.0001, respectively from an unpaired t-test with Benjamini–Hochberg correction. EMSAs were performed with 50 nM DNA and protein concentrations of 0–400 nM. (H) Fractional presence of DNA motifs within Oct4 (left) and ePOU (right) ChIP-seq peaks nearby genes that are upregulated (Up), not changed (NC) or downregulated (Down) at reprogramming day 6 with respect to MEFs. MORE, More Oct factor Recognition Element.
Fig. 5.
Fig. 5.
ePOU differentially activates novel reprogramming facilitators but does not gain pioneering activity. (A) PCA of ATAC-seq signals at indicated reprogramming stages for four-factor experiments. (B) ATAC-seq signals around shared and unique ATAC-seq peaks defined using MAnorm (Shao et al. 2012) at day 3 in four-four factor experiments. (C) Motif occurrences within each class of ATAC-seq peaks defined in (B). (D) PCA of ATAC-seq signals for cells transduced with ePOU or Oct4 alone, as 2F cocktail with Sox2, 2F cocktail with Klf4 or as part of four-factor cocktails at day 3 of reprogramming. (E) Volcano plot highlighting differentially expressed genes in four-factor ePOU versus Oct4 conditions at day 3. Dots are red when P < 0.05 and |log2FoldChange| > 2. (F) Colony count data for reprogramming experiments with OSKM along with candidates selected from (E). Data shown is mean ± range (n = 2). (G) Genome browser tracks of Trh loci showing ChIP-seq and ATAC-seq signals. Location of a MORE+1 motif is indicated with a black bar. Coordinates are in supplementary table S5, Supplementary Material online. (H) Effect of shRNA knock-down on the Oct4-GFP+ colony number at day 13 in ePOU-SKM conditions. Cells were cultured in the presence of 1 µg/ml puromycin to select for cells expressing indicated shRNAs. Data shown as mean ± SD (n = 3) **, *** P ≤ 0.01, 0.001 from Tukey’s test after ANOVA. (I, J) (I) Oct4-GFP+ colonies obtained using OSKM in the presence of 0, 5, or 10 μM TRH peptide in the medium. Data shown as mean ± SD (n = 3–5). (J) The corresponding whole-well scans and cell sorting results. O, Oct4; e, ePOU; S, Sox2; K, Klf4; M, c-Myc; MEF, mouse embryonic fibroblasts; mESC, mouse embryonic stem cells; D2, day 2; D3, day3; D6, day6.
Fig. 6.
Fig. 6.
ePOU is stabilized in comparison to Oct4. (A B) Normalized thermal unfolding curves of purified ePOU and Oct4 DNA binding domains determined using (A) nanoDSF based on intrinsic tryptophan fluorescence and (B) fluorescence emission of a Sypro® Orange dye. Unfolding transitions were measured thrice and melting points (Tm) indicated by dashed lines were estimated using the peak of the first derivative of the melt curve. (C, D) Cycloheximide (CHX) chase assay in reprogramming MEFs transfected with Oct4 or ePOU +SKM at day 3. (C) Representative western blot using an Oct4 antibody with actin as control. (D) Quantification of Oct4/ePOU immunoblot bands (normalized for Actin). *, **, *** P ≤ 0.05, 0.01, and 0.001, respectively from an unpaired t-test. Data are shown as mean ± SEM (n = 6, 2 biological replicates). (E) Schema for the iterative screen with phenotypic selection leading to the discovery of the ePOU. Oct4 (orange), Brn2 (blue), ePOU (orange+blue with an arm to symbolize increased stability), and gray (other POU factors). Green cells are GFP+ iPSCs whereas gray cells are nonreprogrammed ones. * indicates point mutations. (F) ePOU has two-point mutations (asterisk) as well as a fragment from Brn2. ePOU accelerates reprogramming compared with Oct4 by acquiring new binding preferences (i.e., MORE+1) while retaining binding sites of Oct4. Increased robustness/enhanced stability allows ePOU more effective removal of the roadblock and accompanied by expression of factors, such as TRH (pentagon). MEFs, mouse embryonic fibroblasts; iPSC, induced pluripotent stem cells.

Similar articles

Cited by

References

    1. Aksoy I, Jauch R, Chen J, Dyla M, Divakar U, Bogu GK, Teo R, Leng Ng CK, Herath W, Lili S, et al.2013. Oct4 switches partnering from Sox2 to Sox17 to reinterpret the enhancer code and specify endoderm. EMBO J. 32(7):938–953. - PMC - PubMed
    1. Aksoy I, Jauch R, Eras V, Chng WB, Chen J, Divakar U, Ng CK, Kolatkar PR, Stanton LW.. 2013. Sox transcription factors require selective interactions with oct4 and specific transactivation functions to mediate reprogramming. Stem Cells 31(12):2632–2646. - PubMed
    1. Alazard R, Blaud M, Elbaz S, Vossen C, Icre G, Joseph G, Nieto L, Erard M.. 2005. Identification of the ‘NORE’ (N-Oct-3 responsive element), a novel structural motif and composite element. Nucleic Acids Res. 33(5):1513–1523. - PMC - PubMed
    1. Arnold FH. 2018. Directed evolution: bringing new chemistry to life. Angew Chem Int Ed Engl. 57(16):4143–4148. - PMC - PubMed
    1. Asial I, Cheng YX, Engman H, Dollhopf M, Wu B, Nordlund P, Cornvik T.. 2013. Engineering protein thermostability using a generic activity-independent biophysical screen inside the cell. Nat Commun. 4:2901. - PubMed

Publication types