. 2021 Jun 25;38(7):2831-2842.
doi: 10.1093/molbev/msab073.

Asexual Experimental Evolution of Yeast Does Not Curtail Transposable Elements

Affiliations

Asexual Experimental Evolution of Yeast Does Not Curtail Transposable Elements

Piaopiao Chen et al. Mol Biol Evol. .

Abstract

Compared with asexual reproduction, sex facilitates the transmission of transposable elements (TEs) from one genome to another, but boosts the efficacy of selection against deleterious TEs. Thus, theoretically, it is unclear whether sex has a positive net effect on TE's proliferation. An empirical study concluded that sex is at the root of TE's evolutionary success because the yeast TE load was found to decrease rapidly in approximately 1,000 generations of asexual but not sexual experimental evolution. However, this finding contradicts the maintenance of TEs in natural yeast populations where sexual reproduction occurs extremely infrequently. Here, we show that the purported TE load reduction during asexual experimental evolution is likely an artifact of low genomic sequencing coverages. We observe stable TE loads in both sexual and asexual experimental evolution from multiple yeast data sets with sufficient coverages. To understand the evolutionary dynamics of yeast TEs, we turn to asexual mutation accumulation lines that have been under virtually no selection. We find that both TE transposition and excision rates per generation, but not their difference, tend to be higher in environments where yeast grows more slowly. However, the transposition rate is not significantly higher than the excision rate and the variance of the TE number among natural strains is close to its neutral expectation, suggesting that selection against TEs is at best weak in yeast. We conclude that the yeast TE load is maintained largely by a transposition-excision balance and that the influence of sex remains unclear.

Keywords: Saccharomyces cerevisiae; asexual reproduction; excision; mutation accumulation; sexual reproduction; transposon.


Figures

Fig. 1.
Fig. 1.
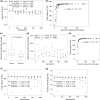
Reanalysis of McDonald et al.’s data previously analyzed by Bast et al. shows that asexual experimental evolution does not curtail yeast TEs upon the removal of unreliable samples. Unless otherwise noted, red and blue indicate sexual and asexual populations, respectively. (a) The genomic TE load at various time points in sexual and asexual experimental evolution. Solid and open dots show samples with >20× and <20× genomic sequencing coverage, respectively. Pearson’s correlation (r) between TE load and number of generations of evolution is shown along with the P value. Dashed lines show linear regressions. (b) Relationship between the observed TE number and the genomic sequencing coverage across samples. The vertical line indicates the coverage of 20. Spearman’s rank correlation (ρ) between the coverage and TE number is shown along with the P value. (c) Genomic sequencing coverage is significantly higher for sexual populations than asexual populations. In each box plot, the lower and upper edges of a box represent the first (qu1) and third (qu3) quartiles, respectively, the horizontal line inside the box indicates the median (md), the whiskers extend to the most extreme values inside inner fences, md±1.5(qu3−qu1), and the circles represent values outside the inner fences (outliers). The P value is based on Wilcoxon rank-sum test. (d) Genomic sequencing coverages of individual samples. The ρ between coverage and number of generations of evolution is shown along with the P value. (e) Numbers of TEs detected from individual subsamples created by downsampling the reads from sexual population 2F5F at 630 generations to the coverage levels of all real samples. The red dashed line is the SCAM regression. The vertical line indicates the coverage of 20. The ρ between the coverage and TE number is shown along with the P value. (f and g) Estimated numbers of TEs (f) and full-length TEs (g) of individual samples upon the regression-based correction for low coverage. All symbols follow panel (a).
Fig. 2.
Fig. 2.
Population genetic simulation of Bast et al.’s model under various parameter settings. (a) Under the initial allele frequency (f0) of 10−2 for the modifier that increases the excision rate, TE numbers reduce more in asexual (blue) than sexual (red) populations. Each line shows one simulation replication, and ten replications were simulated for sexual and asexual populations, respectively. A sexual population undergoes one sexual cycle after every 90 asexual generations. (b) Under the more realistic f0 of 10−5, TE numbers change only slightly in 1,000 generations, and no significant difference is detected between sexual and asexual populations (see inset). A sexual population undergoes one sexual cycle after every 90 asexual generations. (c and d) When sexual reproduction occurs once after 1,000 asexual generations as in natural yeast populations, TE numbers continuously drop under f0=10−2 (c) or 10−5 (d), indicating that the model is unrealistic.
Fig. 3.
Fig. 3.
Yeast genomic TE load and numbers of various groups of TEs are stable over Lang et al.’s asexual experimental evolution. (a) Genomic TE load remains stable in 40 asexual lines over 1,000 generations. Each dot represents a line at a time point. The linear regression of TE load over 12 time points for all data points is shown, along with Pearson’s correlation (r) and P value. (b) Frequency distribution of the slope of the 40 linear regressions of genomic TE load on number of generations, one per experimental evolution line. The red dashed vertical line indicates the mean of the distribution. (c) Frequency distribution of the percentage change in TE load per line from the start to the end of experimental evolution. The red dashed vertical line indicates the mean of the distribution. (d) Total numbers of TEs remain stable in 40 asexual lines over 1,000 generations. Symbols follow panel (a). (e) Frequency distribution of the slope of the 40 linear regressions of number of TEs on number of generations, one per experimental evolution line. The red dashed vertical line indicates the mean of the distribution. (f) Frequency distribution of the percentage change in TE number per line from the start to the end of experimental evolution. The red dashed vertical line indicates the mean of the distribution. (gi) Numbers of full-length TEs (g), reference TEs (h), and nonreference TEs (i) remain stable in 40 asexual lines over 1,000 generations. Symbols follow panel (a).
Fig. 4.
Fig. 4.
Yeast genomic TE load and numbers of various groups of TEs are stable over Leu et al.’s sexual and asexual experimental evolution. Red and blue dots indicate sexual and asexual populations, respectively, whereas solid and open dots show samples with >20× and <20× genomic sequencing coverage, respectively. (a) Genomic TE load remains stable in three sexual and three asexual lineages over 1,440 generations. The linear regression of TE load over the number of generations of experimental evolution is shown, along with Pearson’s correlation (r) and P value. (be) Numbers of all TEs (b), full-length TEs (c), reference TEs (d), and nonreference TEs (e) of individual samples upon the regression-based correction for low coverage. Symbols follow panel (a).
Fig. 5.
Fig. 5.
TE transpositions and excisions in 167 yeast mutation accumulation (MA) lines collected in seven different environments. (a) Estimated rates of TE transposition and excision per full-length TE per generation. The error bar shows the 95% confidence interval. The transposition and excision rates are not significantly different (P =0.36, Wilcoxon rank-sum test). (b and c) Both rates of TE transposition (b) and excision (c) per full-length TE per generation in an environment decrease with the yeast growth rate in the environment before the MA. The black dashed line shows the linear regression. Spearman’s rank correlation and P value are shown. Vertical and horizontal error bars respectively show standard deviations of transposition/excision rates and growth rates among replicate lines.

Similar articles

Cited by

References

    1. Adrion JR, Song MJ, Schrider DR, Hahn MW, Schaack S.. 2017. Genome-wide estimates of transposable element insertion and deletion rates in Drosophila melanogaster. Genome Biol Evol. 9(5):1329–1340. - PMC - PubMed
    1. Ågren JA, Greiner S, Johnson MTJ, Wright SI.. 2015. No evidence that sex and transposable elements drive genome size variation in evening primroses. Evolution 69(4):1053–1062. - PubMed
    1. Arkhipova I, Meselson M.. 2000. Transposable elements in sexual and ancient asexual taxa. Proc Natl Acad Sci U S A. 97(26):14473–14477. - PMC - PubMed
    1. Bartolomé C, Maside X, Charlesworth B.. 2002. On the abundance and distribution of transposable elements in the genome of Drosophila melanogaster. Mol Biol Evol. 19(6):926–937. - PubMed
    1. Barton NH. 1990. Pleiotropic models of quantitative variation. Genetics 124(3):773–782. - PMC - PubMed

Publication types

Substances

LinkOut - more resources