. 2021 Jun 24;137(25):3518-3532.
doi: 10.1182/blood.2020008551.

Very long chain fatty acid metabolism is required in acute myeloid leukemia

Affiliations

Very long chain fatty acid metabolism is required in acute myeloid leukemia

Matthew Tcheng et al. Blood. .

Abstract

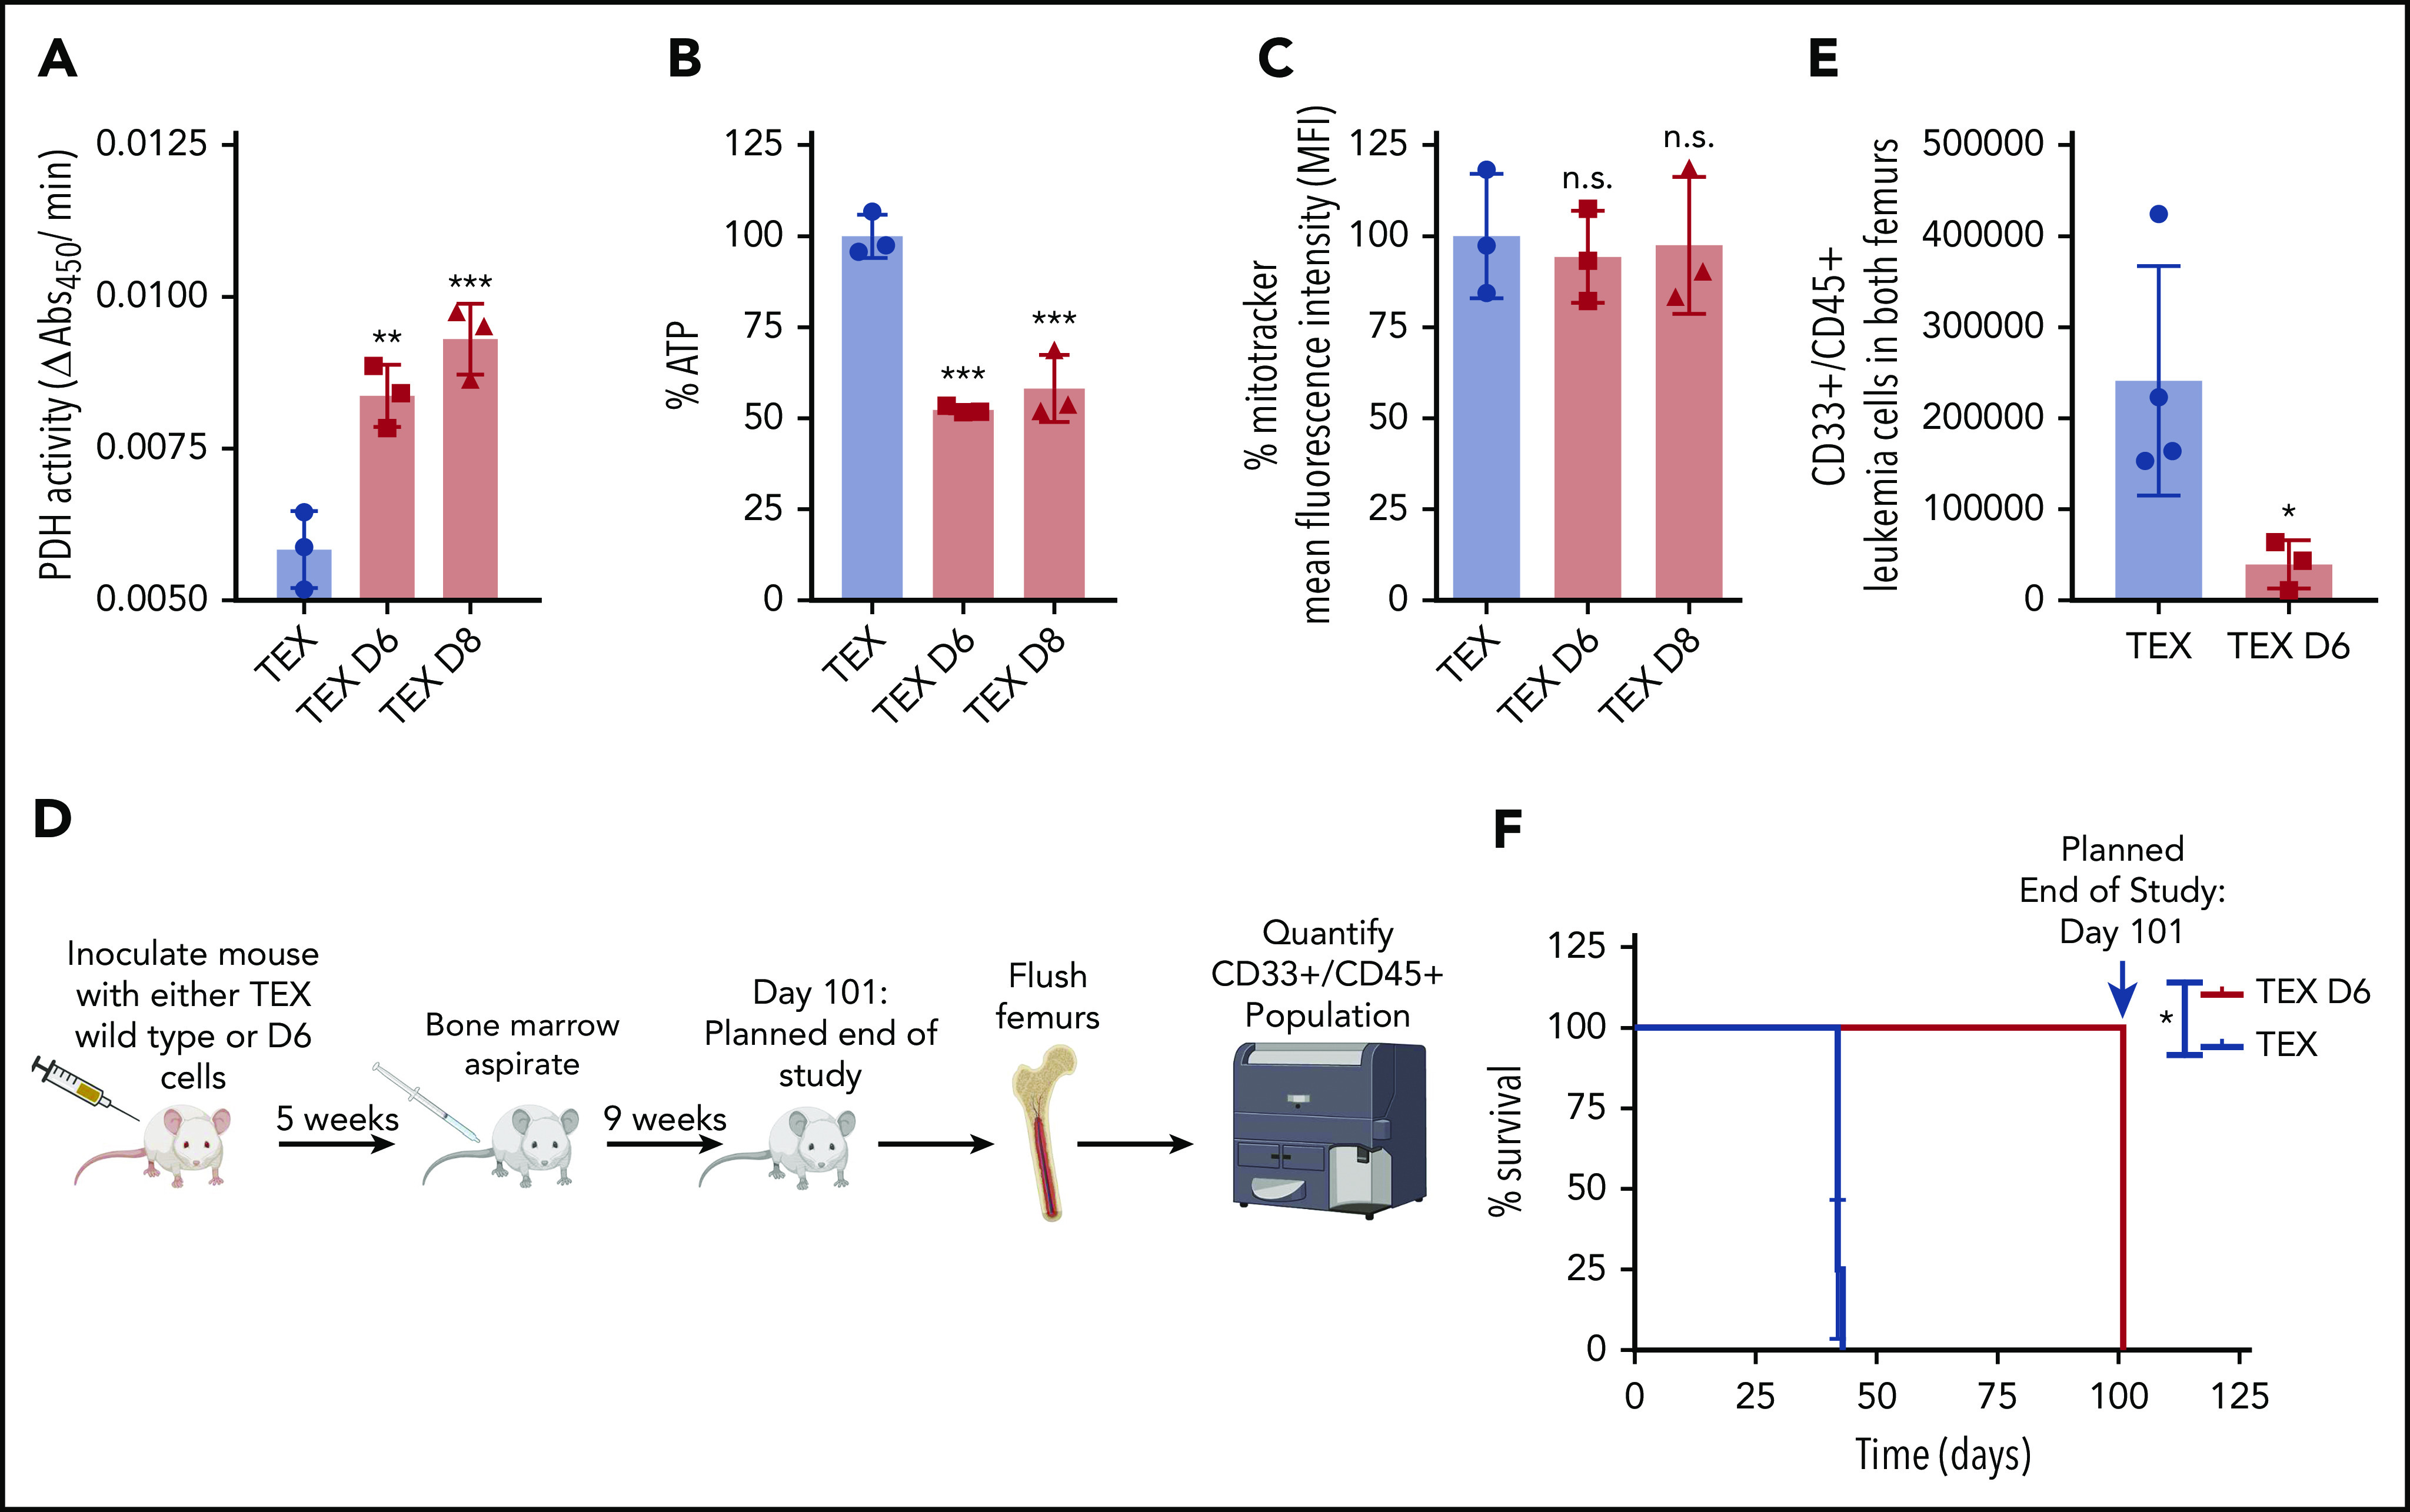
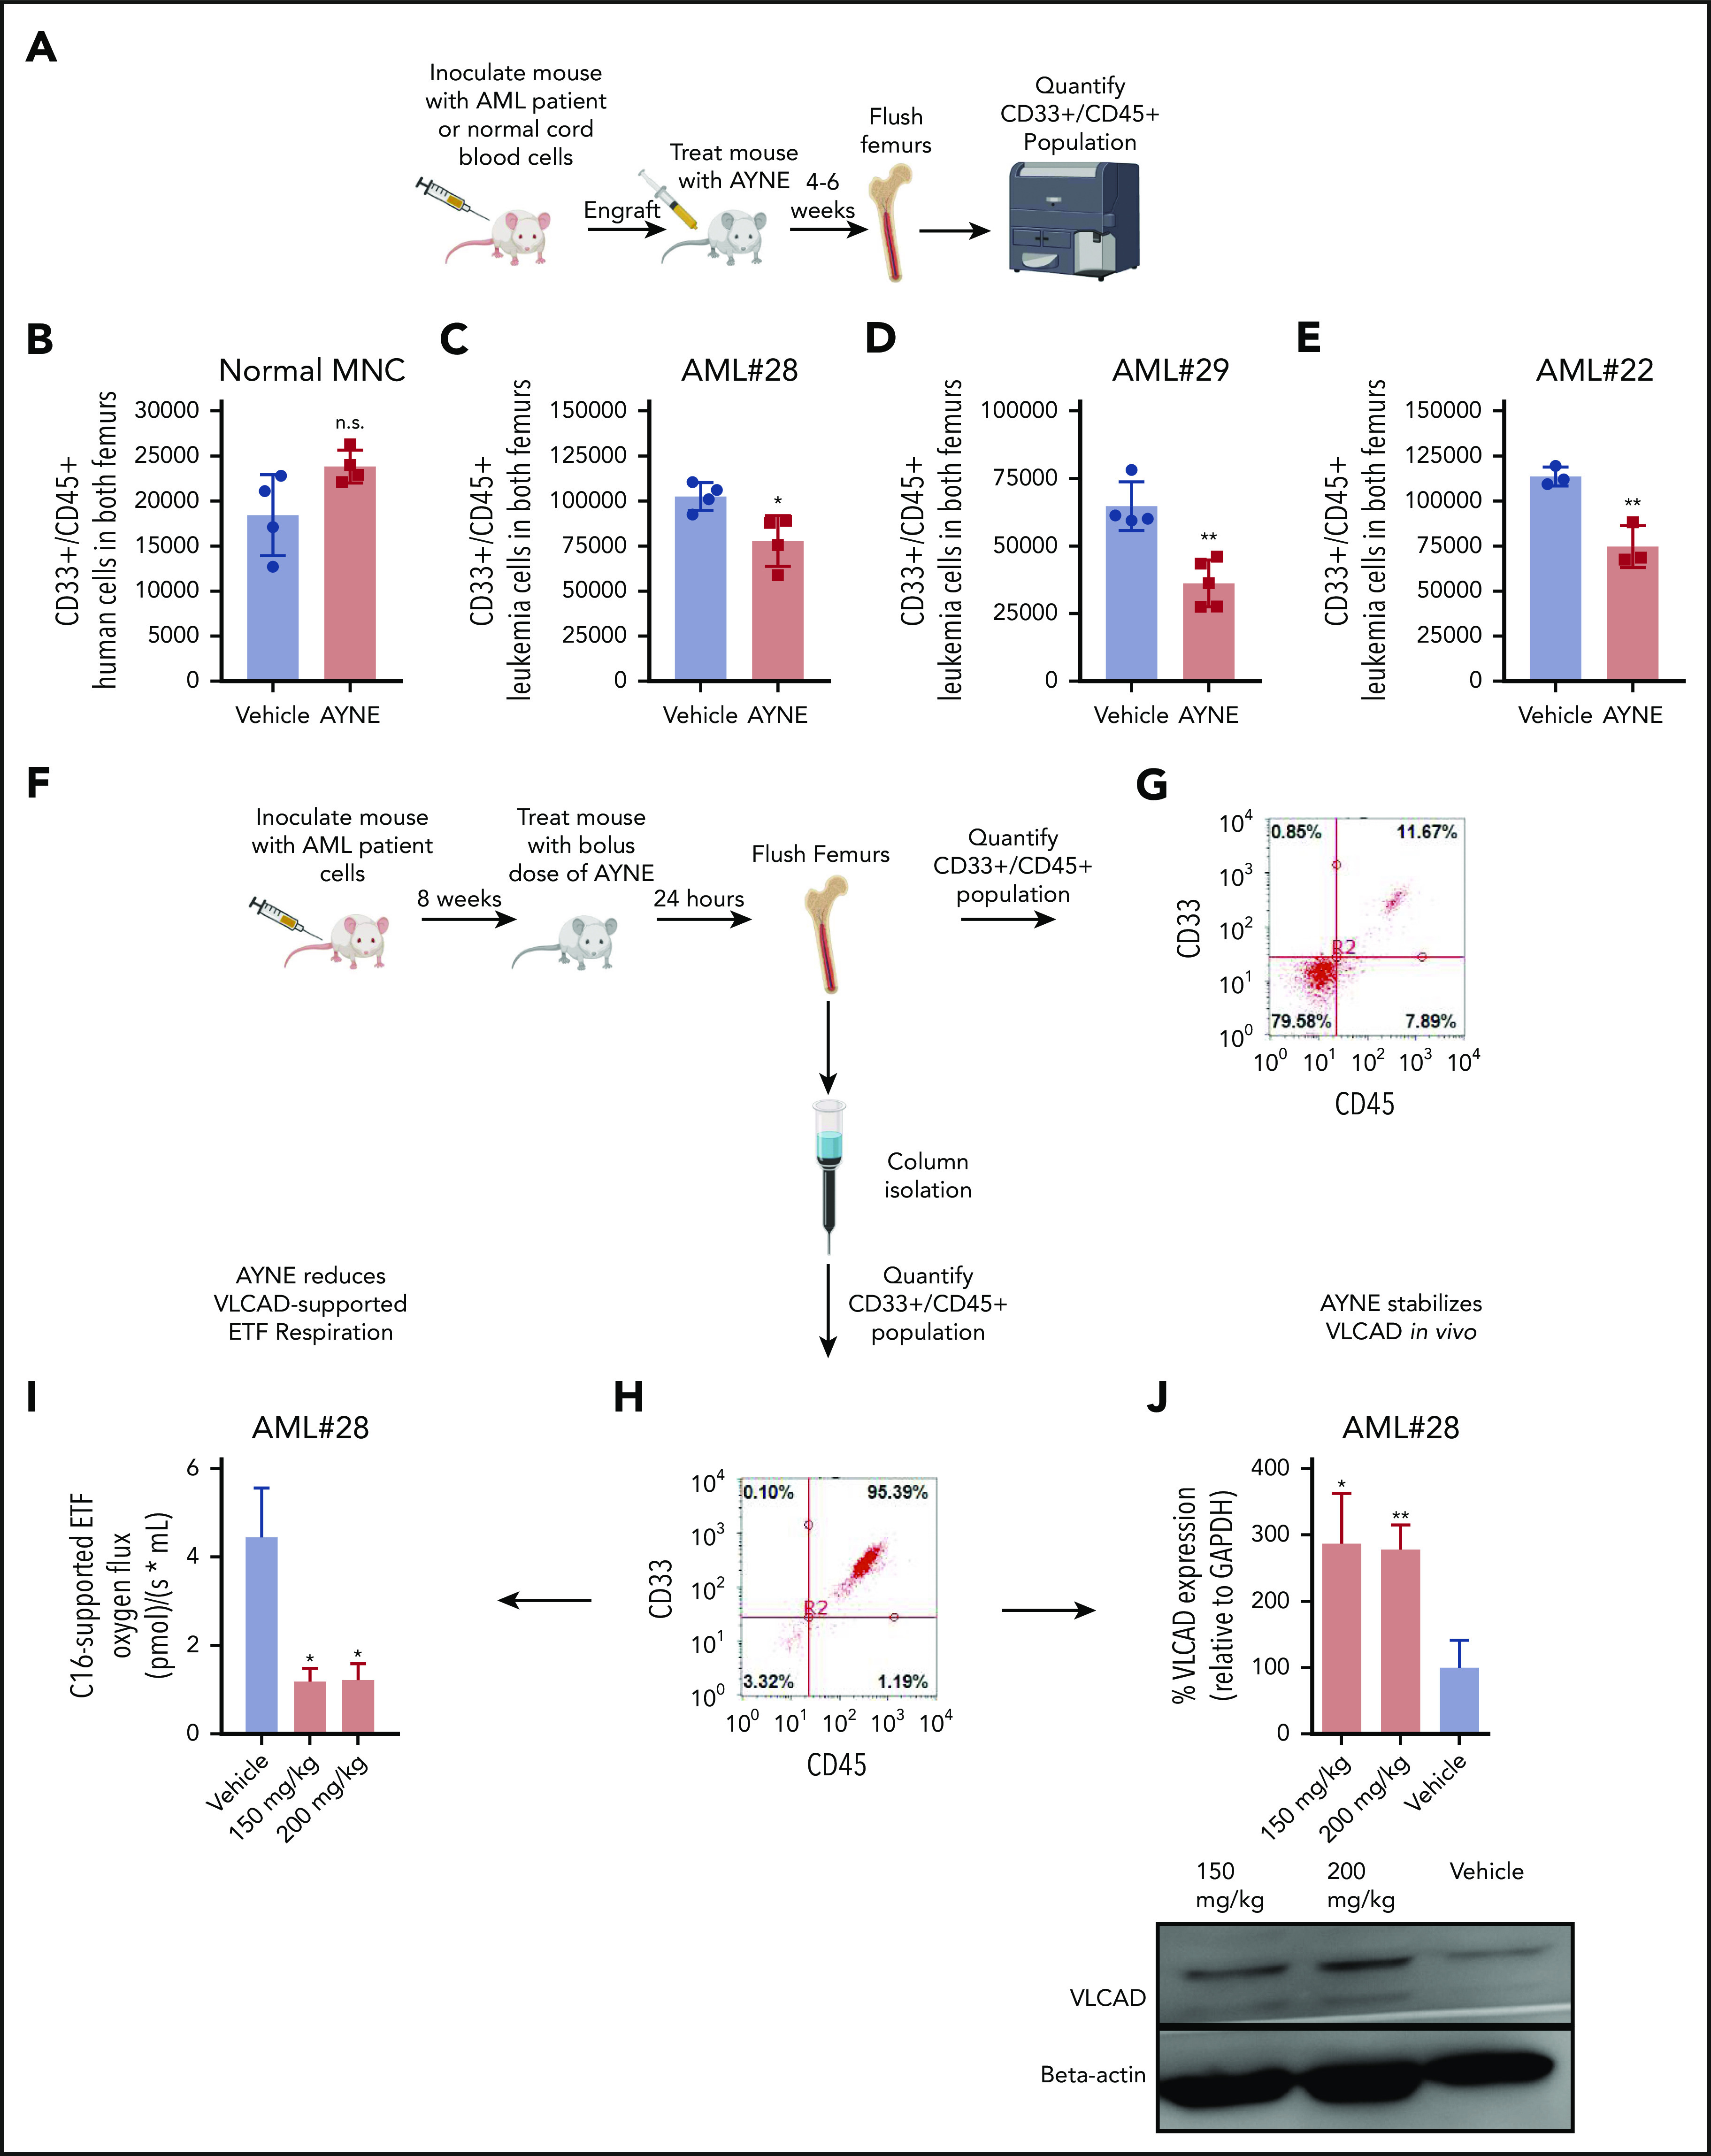
Acute myeloid leukemia (AML) cells have an atypical metabolic phenotype characterized by increased mitochondrial mass, as well as a greater reliance on oxidative phosphorylation and fatty acid oxidation (FAO) for survival. To exploit this altered metabolism, we assessed publicly available databases to identify FAO enzyme overexpression. Very long chain acyl-CoA dehydrogenase (VLCAD; ACADVL) was found to be overexpressed and critical to leukemia cell mitochondrial metabolism. Genetic attenuation or pharmacological inhibition of VLCAD hindered mitochondrial respiration and FAO contribution to the tricarboxylic acid cycle, resulting in decreased viability, proliferation, clonogenic growth, and AML cell engraftment. Suppression of FAO at VLCAD triggered an increase in pyruvate dehydrogenase activity that was insufficient to increase glycolysis but resulted in adenosine triphosphate depletion and AML cell death, with no effect on normal hematopoietic cells. Together, these results demonstrate the importance of VLCAD in AML cell biology and highlight a novel metabolic vulnerability for this devastating disease.


Conflict of interest statement

Conflict-of-interest disclosure: A.D.S. has received honoraria or consulting fees from Novartis, Jazz Pharmaceuticals, Otsuka, and Takeda Pharmaceuticals and research support from Medivir AB and Takeda. A.D.S. owns stock in AbbVie Pharmaceuticals. A.D.S. and P.A.S. are named on a patent application for the use of avocado compounds for the treatment of leukemia; however, this patent was not pursued passed the jurisdictional phase. P.A.S. has received honoraria from the Hass Avocado Board. The remaining authors declare no competing financial interests.

Figures

None
Graphical abstract
Figure 1.
Figure 1.
ACADVL is overexpressed in human AML. (A) Schematic diagram of the FAO pathway highlighting enzymes associated with the carnitine shuttle; long, medium, and short chain FAO; and ACAD electron transfer with the protein VLCAD, coded by the gene ACADVL (in red). Enzyme names are in roman type; corresponding gene names (beneath the protein name) are italicized. Each enzyme’s full name, short form name, and encoding gene are shown in supplemental Figure 1A. UQ, I, II, III, and IV are abbreviations for ubiquinone and complexes 1, 2, 3, and 4 of the ETC. Created using BioRender. (B) Volcano plots comparing the fold change in the expression of various intramitochondrial FAO genes between AML patient and healthy BM populations in the GSE9476, GSE13204, and GSE1159 data sets. (C) ACADVL gene overexpression between AML patient and healthy BM populations in GSE9476, GSE13204, and GSE1159. AML populations were stratified into quartiles, labeled Q1 through Q4. In (B) and (C), comparisons between genes are presented as a scatter plot with the x-axis as log2 of the fold change and the y-axis as a negative log10 of the P value for AML vs healthy BM populations. (D) Immunoblot showing VLCAD protein levels across patient-derived AML cells (#1-#8, where the number after # denotes the patient ID), isolated from peripheral blood, and normal MNCs. Patient cytogenetics are in supplemental Figure 10. **P ≤ .002, ***P ≤ .001, 2-tailed unpaired Student t test. n.s., not significant.
Figure 2.
Figure 2.
Knockdown of VLCAD decreases leukemic proliferation, clonogenic growth, and intact cellular and palmitate (C16)-supported ETF respiration. (A) Western blot showing knockdown of VLCAD in TEX cells, where D6 and D8 are knockdown constructs. (B) Densitometry of VLCAD knockdown in TEX cells. Proliferation counts after 1, 3, and 5 days (C) and colony count after 2 weeks (D) for TEX wild-type and VLCAD-knockdown cells. (E) Representative oxygraph quantifying basal and maximal respiration of intact leukemia cells (left panel). In brief, following injection into the high-resolution respirometer, cells demonstrate a basal rate of respiration. ATP synthesis is uncoupled by addition of oligomycin (OLI). Maximal respiration is stimulated with an injection of a chemical uncoupler (FCCP) and pyruvate (PYR). All mitochondrial respiration is inhibited by addition of antimycin A (ANTIA). Intact cell basal and maximal respiration of TEX wild-type and VLCAD knockdown cells (right panel). (F) Schematic diagram showing the flow of electrons following the oxidation of fats of different carbon lengths to support respiration of the ETC. Electrons supplied by VLCAD (for very long fats; 14-18 carbons long), medium chain acyl-CoA dehydrogenase (MCAD; for medium-length fats; 6-12 carbons long), and short chain acyl-CoA dehydrogenase (SCAD; for short-length fats; 4 carbons long) reduce the FAD cofactor attached to the ETF (ETF-FAD). Reduced ETF-FADH2 is oxidized by ETF dehydrogenase (ETFDH), passing electrons to ubiquinone (UQ) and then complex III (III). Malonate (MALON) and rotenone (ROT) inhibit electron flow from complexes I (I) and II (II), respectively; residual oxygen flux measured by the respirometer is exclusively ETF supported respiration, an indirect measure of VLCAD activity when palmitate is supplied. (G) Representative oxygraph quantifying C16-supported ETF respiration (left panel). In brief, permeabilized cells are injected into the respirometer. C16 in the form of palmitoyl-carnitine (PC), malate (MAL), and adenosine diphosphate (ADP) stimulate C16-supported FAO respiration. MALON and ROT inhibit any contribution of electrons from complexes I and II, allowing ETF respiration to be exclusively assessed. C16-supported (middle panel) and C8-supported (right panel) ETF respiration of TEX wild-type and VLCAD-knockdown cells. Data in (B-D, E [right panel] and G [middle and right panels]) are mean ± standard deviation. Panel F created in Biorender. *P ≤ .05, **P ≤ .002, ***P ≤ .001, 1-way ANOVA with Tukey’s post-hoc test.
Figure 3.
Figure 3.
Knockdown of VLCAD alters mitochondrial metabolism and reduces leukemia cell engraftment. Quantification of PDH activity (A), ATP levels (B), and (C) mitochondrial mass of TEX wild-type and VLCAD-knockdown cells. (D) Schematic diagram of the study, highlighting injection of an equal number of TEX wild-type or D6 cells into the tail vein of NSG mice. Engraftment levels were quantified at an intermediate time point of 5 weeks, via BM, and at the planned end point at day 101. Created using BioRender. (E) Engraftment levels of TEX wild-type and VLCAD-knockdown cells at the end point. (F) Overall survival of mice engrafted with TEX wild-type or D6 cells. *P = .0134, log-rank (Mantel-Cox) test. *P ≤ .05, **P ≤ .002, ***P ≤ .001, 1-way ANOVA with Tukey’s post hoc test (A-C); Mann-Whitney U test (E). With the exception of (D), all data are mean ± standard deviation.
Figure 4.
Figure 4.
A high-resolution respirometer (HRR)-based screen identifies AYNE as a pharmacological inhibitor of VLCAD. (A) An HRR screen identified AYNE as an inhibitor of C16-supported ETF respiration. AML2 cells were incubated with a screen compound (10 µM) or a solvent vehicle for 1 hour, and C16-supported ETF respiration was assessed. AYNE (compound 151) is highlighted by a red arrow. Structure of AYNE is to the right. (B) Schematic diagram highlighting the pull-down of VLCAD in AYNE-treated AML2 cells. In brief, following a 3-hour treatment, AYNE-treated AML2 cells were lysed and exposed to an anti-VLCAD antibody coupled to magnetic beads. Magnetic separation produces 2 fractions from the lysate: the flow-through fraction (containing all lysate components except VLCAD) and the VLCAD-enriched fraction (containing only VLCAD). Both fractions underwent immunoblotting to confirm VLCAD pull-down or MS analysis to quantify AYNE. Created using BioRender. (C) Immunoblot showing isolation of VLCAD from the flow-through fractions (lanes 1 and 2) into VLCAD-enriched fractions (lanes 3 and 4) by magnetic co-IP. (D) Identification of AYNE in VLCAD-enriched fractions: chromatograms showing elution of a commercial AYNE standard (top panel) and a VLCAD-enriched fraction (bottom panel). The red arrows indicate AYNE elutes at 5.6 minutes. (E) MS quantification of AYNE in VLCAD-enriched fractions from AYNE-treated AML2 cells. Data in (E) are mean ± standard deviation; n.d., not detected.
Figure 5.
Figure 5.
AYNE eliminates the leukemic population and hinders clonogenic growth by targeting long chain FAO at the site of VLCAD. (A) Death of leukemia cell lines TEX (left panel) and AML2 (right panel) following 72-hour treatment with AYNE. (B) Clonogenic growth of primary AML cells (#9-#13) and normal MNCs (n = 5) following a 2-week treatment with solvent vehicle or 10 µM AYNE. (C) Intact leukemia cell basal respiration (left panel) and maximal respiration (right panel) following 1-hour treatment with a solvent vehicle or 10 µM AYNE or 100 µM ETO. (D) Rates of complete FAO, using radiolabeled palmitate, in AML cell lines following 3-hour treatment with a solvent vehicle, AYNE (10 or 50 µM), ETO (100 µM; positive control for FAO inhibition), or cytarabine (Ara-C; 1 µM, negative control for FAO inhibition). (E) Following 12-hour treatment with a solvent vehicle or AYNE (10 or 25 µM), ACAD activity in AML2 cells was directly quantified with a fluorescence-based assay and palmitoyl-CoA (C16-CoA) or octanoyl-CoA (C8-CoA) to assess VLCAD or MCAD activity, respectively. (F) Following 1-hour treatment with a solvent vehicle or AYNE (10 or 25 µM), ACAD activity in AML2 cells was indirectly quantified via ETF respiration with palmitoyl-carnitine or octanoyl-carnitine to assess VLCAD or MCAD activity, respectively. (G) AC profiling after 96 hours in spent media of human nontransformed fibroblasts treated with a solvent vehicle or AYNE (25 or 50 µM). Viability of TEX cells (H) and AML2 cells (I) following 72-hour treatment with sodium heptanoate (C7) and AYNE. In (A,H-I), the 7-aminoactinomycin D exclusion assay was used for all viability experiments in which cells were treated for 72 hours. Data in (B-G) are mean ± standard deviation (SD). *P ≤ .05, **P ≤ .002, ***P ≤ .001, 2-tailed paired Student t test (B); 1-way ANOVA with Tukey’s post hoc test (C-G). In (H-I), 50% inhibitory concentrations were calculated using the dose response–inhibition equation using GraphPad Prism 7.0 and then compared as mean ± SD using a 2-tailed unpaired Student t test.
Figure 6.
Figure 6.
AYNE inhibits palmitate contribution to the TCA cycle, resulting in primary AML cell death while sparing normal cells. (A) Viability of primary bulk AML cells (#14-#18), primary CD34+ AML cells (#2, #3, #15, #19), and normal CD34+ cells (n = 3) treated for 24 hours. (B) Quantification of ATP levels in primary CD34+ AML and CD34+ normal cells after 12-hour treatment. (C) Levels of 13C-labeled ACs in primary AML cells (#4, #22, #23, #24, #27) after 12 hours. (D) Enrichment of 13C atoms into FAO and TCA metabolites following 12-hour treatment with a uniformly labeled 13C16 palmitate tracer in primary AML cells (#4, #22, #23, #24, #27) and normal MNCs (n = 3). Created using BioRender. (E) Levels of 13C3 lactate, 13C3 pyruvate, 13C2 citrate following 12-hour treatment with a 13C6 glucose tracer in primary AML cells (#3, #15, #16, #19, #25, #26) and normal MNCs (n = 5). In all experiments, primary AML cells and normal MNCs were treated with a solvent vehicle or 50 µM AYNE. In (A-E), data are mean ± standard deviation. Summary of patient cytogenetics are shown in supplemental Figure 10. Summary of statistics for (C-E) are shown in supplemental Figure 11. *P ≤ .05, **P ≤ .002, ***P ≤ .001, 2-tailed unpaired Student t test. shRNA, short hairpin RNA.
Figure 7.
Figure 7.
AYNE selectively eliminates the AML population and targets VLCAD in vivo. (A) Schematic diagram of the study highlighting the injection of patient-derived AML or normal cord blood MNC into tail veins of NSG mice. After an engraftment period during which human cells localize to BM, mice were divided into 2 groups (vehicle or AYNE) and then treated 3 times weekly for 4 or 6 weeks. Mice were then euthanized, femurs were flushed, and human CD33+/CD45+ cells were quantified via flow cytometry. Created using BioRender. Human cells were given 1 week (B-D) or 4 weeks (E) to engraft prior to starting treatment. (B) Engraftment of healthy cord cells following treatment with 300 mg/kg per week of AYNE or vehicle control for 6 weeks. Engraftment of patient-derived AML cells following treatment with vehicle or AYNE [225 mg/kg per week (C) or 300 mg/kg per week (D)] for 6 weeks. (E) Engraftment of patient-derived AML cells following treatment with vehicle or AYNE (200 mg/kg per week) for 4 weeks. (F) Schematic diagram of the study highlighting injection of patient-derived AML cells into the tail vein of NSG mice. After 8 weeks, mice were divided into 2 groups (vehicle or AYNE) and treated with a bolus dose of AYNE (150 or 200 mg/kg) or a vehicle control. Twenty-four hours later, mice were euthanized, femurs were flushed, and cells were recovered for downstream applications. The mix of human and mice cells recovered from the femurs was quantified via flow cytometry before (G) and after (H) column purification. C16-supported ETF respiration (I) and thermostabilization of VLCAD (J) were assessed in human cells recovered from mice that received vehicle or AYNE (150 or 200 mg/kg). In (B-E,I-J), data are mean ± standard deviation. *P ≤ .05, **P ≤ .002, ***P ≤ .001, Mann-Whitney U test (B-E); 1-way ANOVA with Tukey’s post hoc test (I-J).

Comment in

  • Break the lifeline of AML cells.
    Tabe Y, Konopleva M. Tabe Y, et al. Blood. 2021 Jun 24;137(25):3465-3467. doi: 10.1182/blood.2021011475. Blood. 2021. PMID: 34165546 Free PMC article. No abstract available.

References

    1. Škrtić M, Sriskanthadevan S, Jhas B, et al. . Inhibition of mitochondrial translation as a therapeutic strategy for human acute myeloid leukemia. Cancer Cell. 2011;20(5):674-688. - PMC - PubMed
    1. Farge T, Saland E, de Toni F, et al. . Chemotherapy-resistant human acute myeloid leukemia cells are not enriched for leukemic stem cells but require oxidative metabolism. Cancer Discov. 2017;7(7):716-735. - PMC - PubMed
    1. Samudio I, Harmancey R, Fiegl M, et al. . Pharmacologic inhibition of fatty acid oxidation sensitizes human leukemia cells to apoptosis induction. J Clin Invest. 2010;120(1):142-156. - PMC - PubMed
    1. Sriskanthadevan S, Jeyaraju DV, Chung TE, et al. . AML cells have low spare reserve capacity in their respiratory chain that renders them susceptible to oxidative metabolic stress. Blood. 2015;125(13):2120-2130. - PMC - PubMed
    1. Ye H, Adane B, Khan N, et al. . Leukemic stem cells evade chemotherapy by metabolic adaptation to an adipose tissue niche. Cell Stem Cell. 2016;19(1):23-37. - PMC - PubMed

Publication types

MeSH terms