

Topographical reorganization of brain functional connectivity during an early period of epileptogenesis
- PMID: 33720411
- PMCID: PMC8302261
- DOI: 10.1111/epi.16863
Topographical reorganization of brain functional connectivity during an early period of epileptogenesis
Abstract
Objective: The current study aims to investigate functional brain network representations during the early period of epileptogenesis.
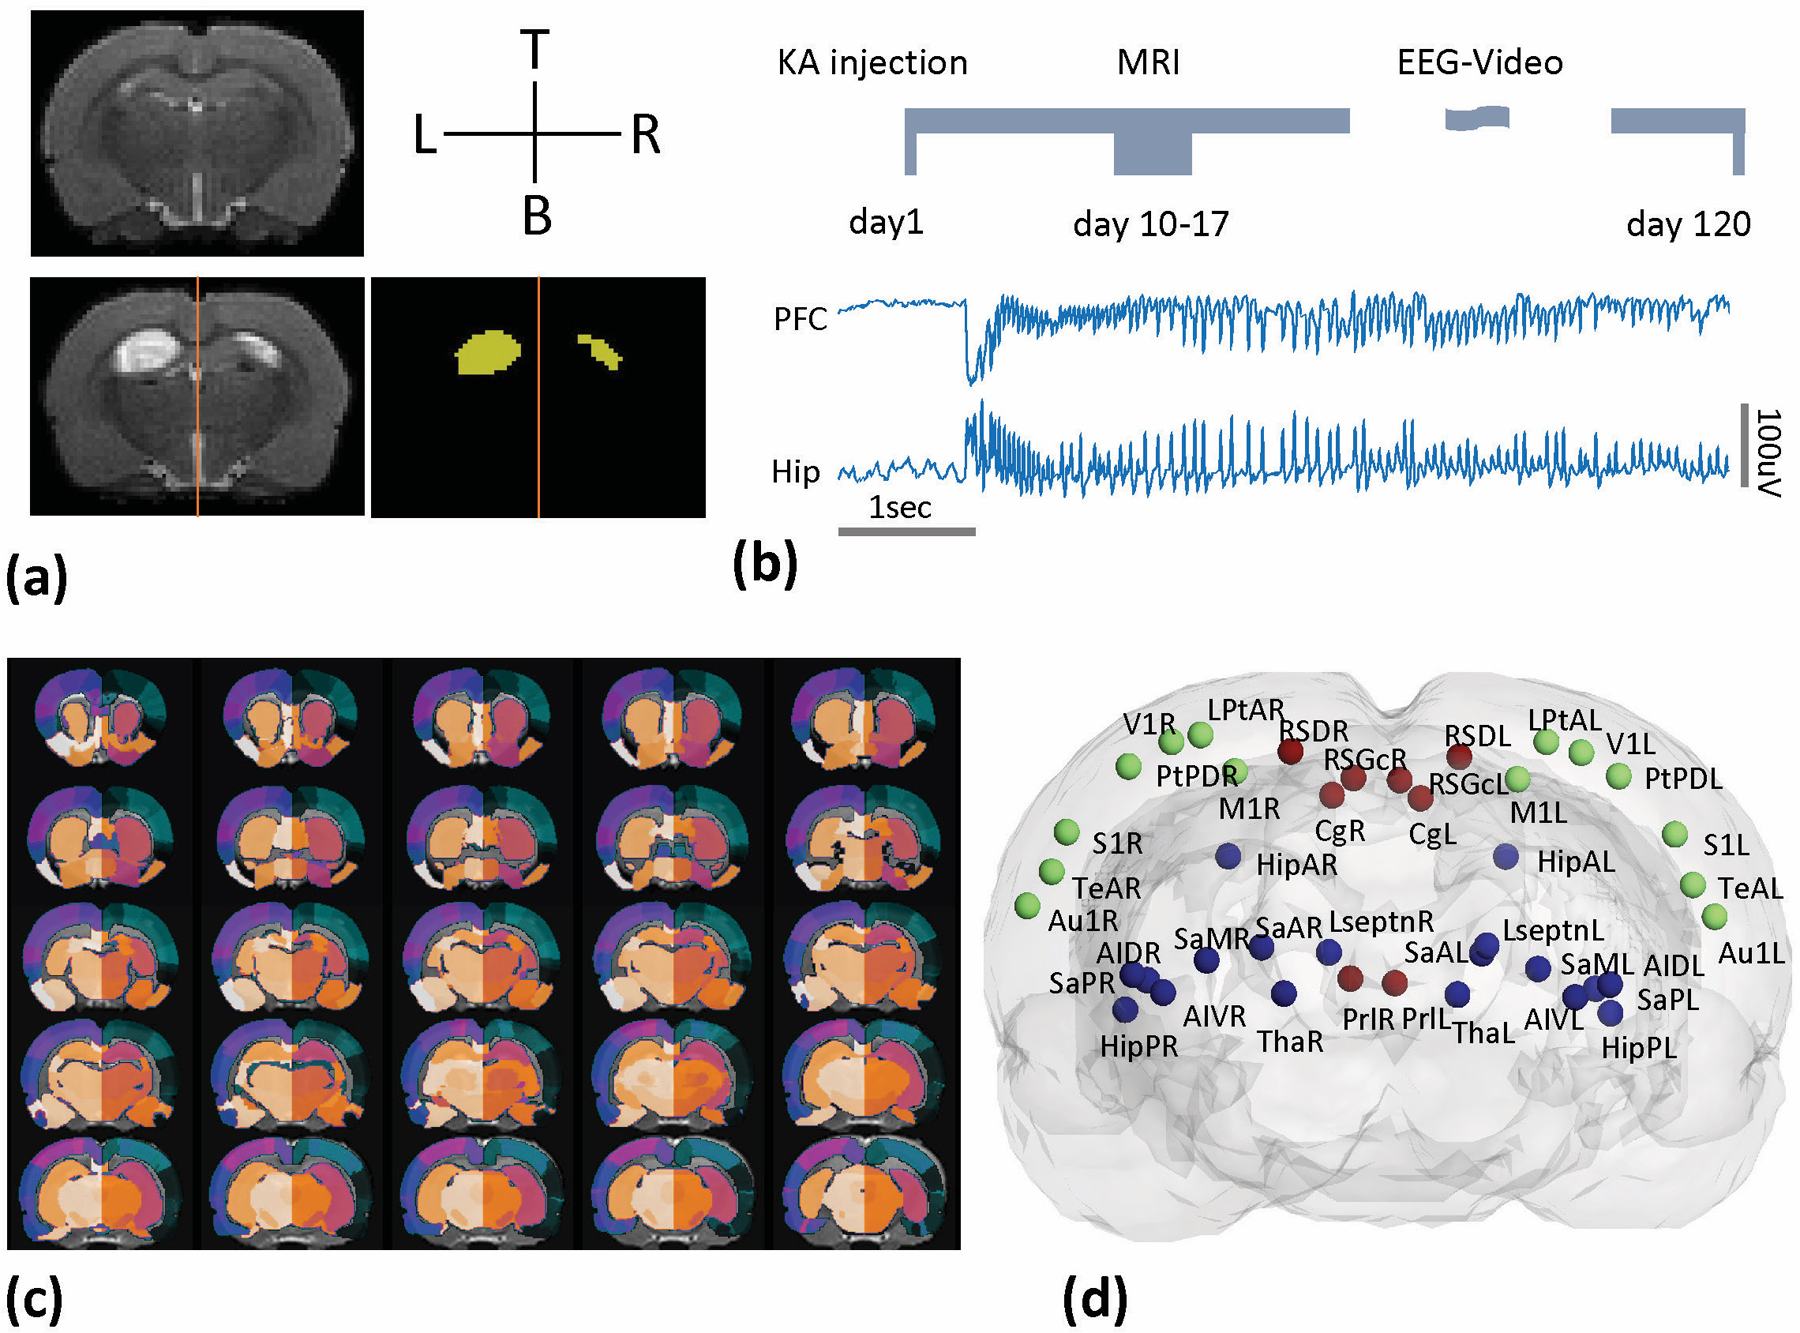
Methods: Eighteen rats with the intrahippocampal kainate model of mesial temporal lobe epilepsy were used for this experiment. Functional magnetic resonance imaging (fMRI) measurements were made 1 week after status epilepticus, followed by 2-4-month electrophysiological and video monitoring. Animals were identified as having (1) developed epilepsy (E+, n = 9) or (2) not developed epilepsy (E-, n = 6). Nine additional animals served as controls. Graph theory analysis was performed on the fMRI data to quantify the functional brain networks in all animals prior to the development of epilepsy. Spectrum clustering with the network features was performed to estimate their predictability in epileptogenesis.
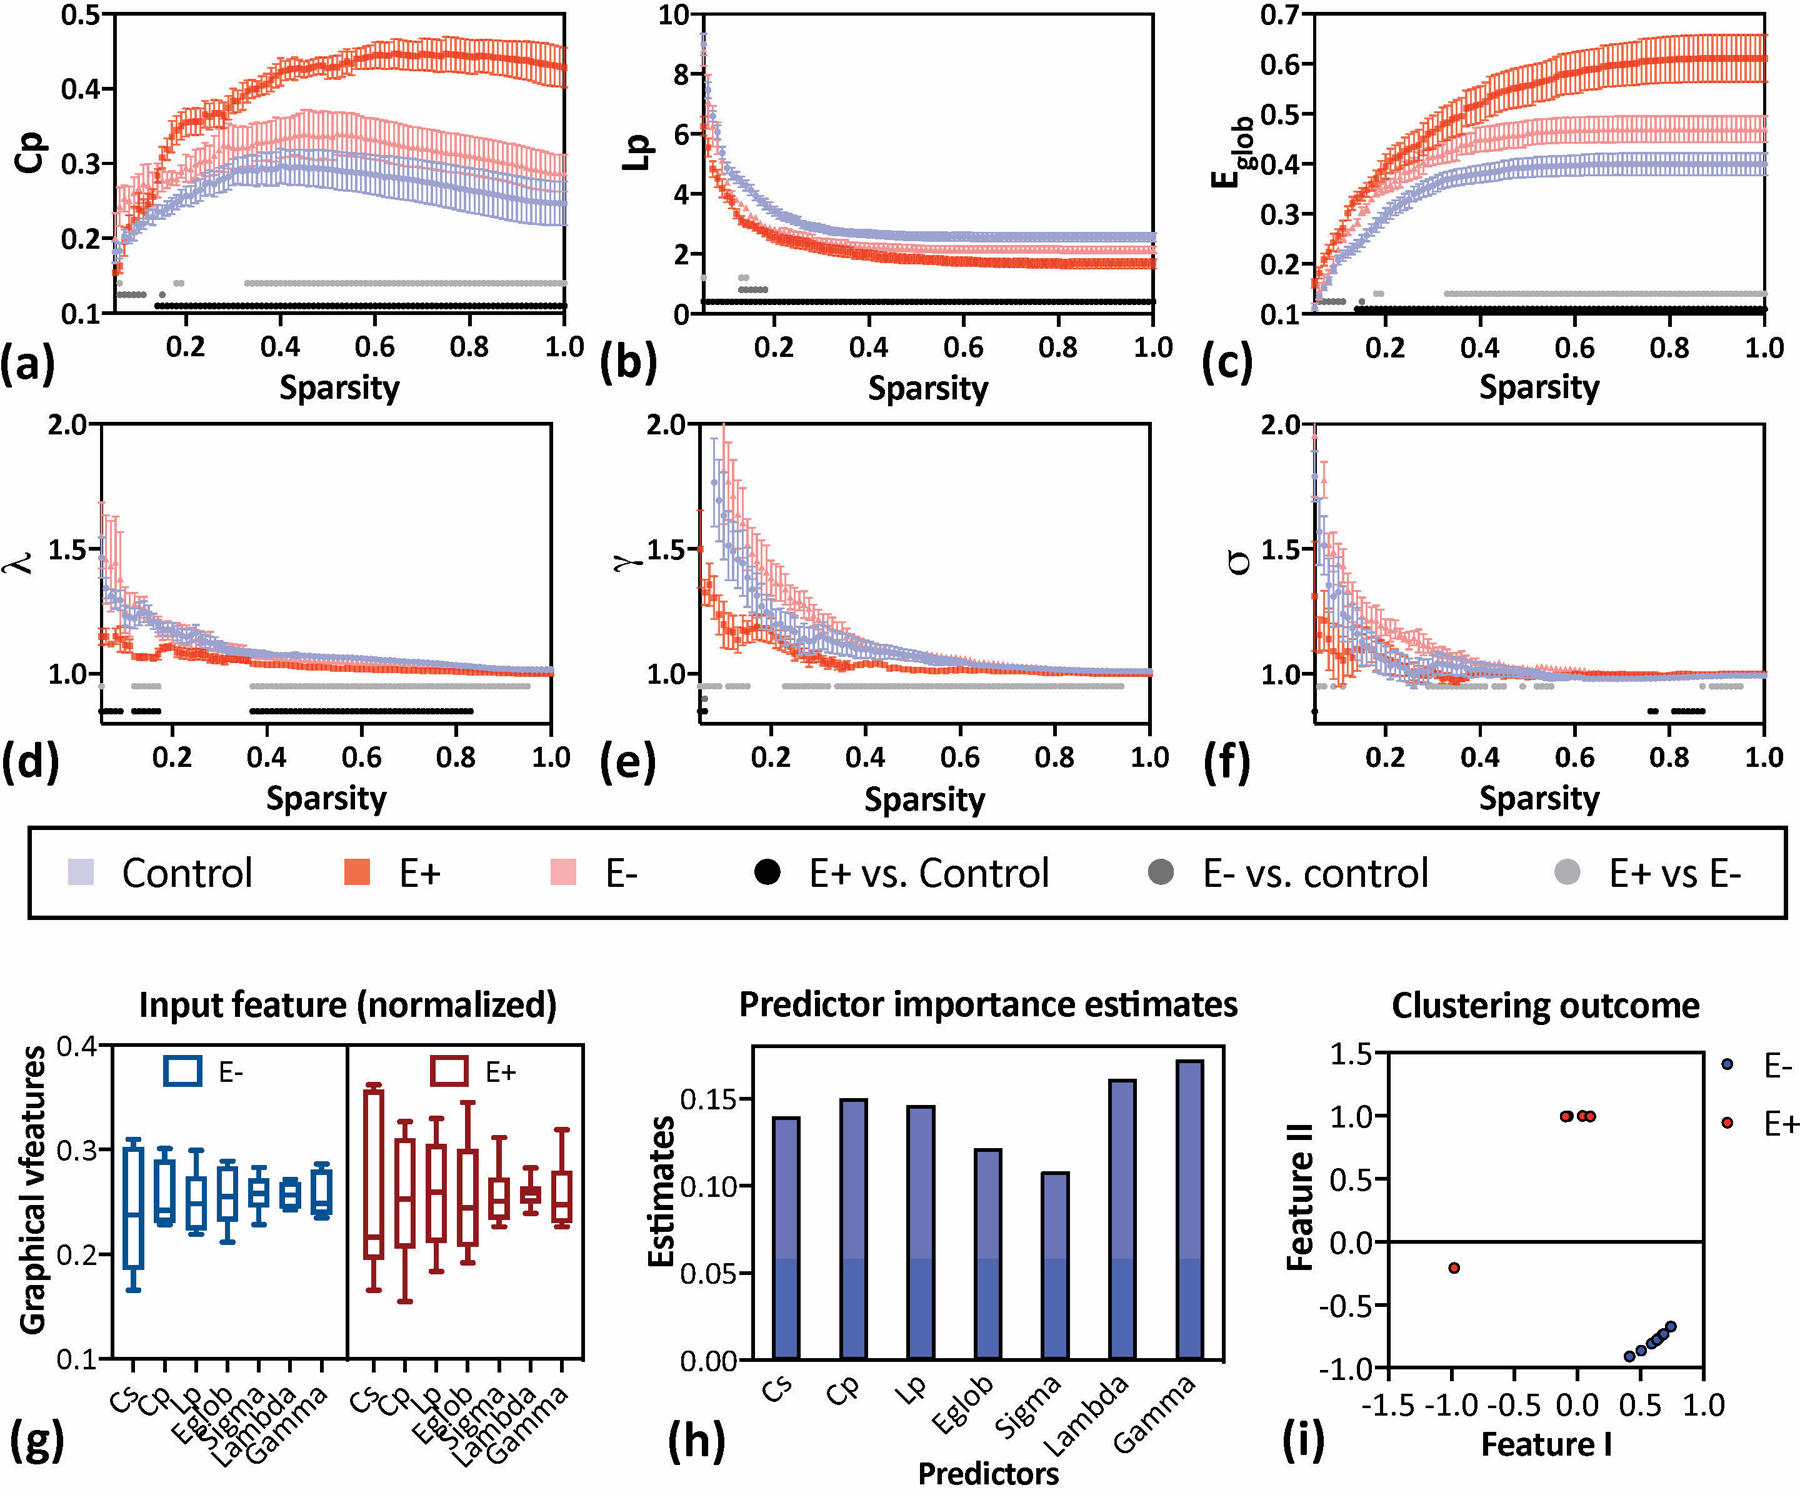
Results: Our data indicated that E+ animals showed an overall increase in functional connectivity strength compared to E- and control animals. Global network features and small-worldness of E- rats were similar to controls, whereas E+ rats demonstrated increased small-worldness, including increased reorganization degree, clustering coefficient, and global efficiency, with reduced shortest pathlength. A notable classification of the combined brain network parameters was found in E+ and E- animals. For the local network parameters, the E- rats showed increased hubs in sensorimotor cortex, and decreased hubness in hippocampus. The E+ rats showed a complete loss of hippocampal hubs, and the appearance of new hubs in the prefrontal cortex. We also observed that lesion severity was not related to epileptogenesis.
Significance: Our data provide a view of the reorganization of topographical functional brain networks in the early period of epileptogenesis and how it can significantly predict the development of epilepsy. The differences from E- animals offer a potential means for applying noninvasive neuroimaging tools for the early prediction of epilepsy.
Keywords: brain networks; epileptogenesis; fMRI; graph theory; self-cured.
© 2021 International League Against Epilepsy.
Figures


Similar articles
-
Intrinsic brain network stability during kainic acid-induced epileptogenesis.Epilepsia Open. 2025 Apr;10(2):508-520. doi: 10.1002/epi4.70002. Epub 2025 Feb 20. Epilepsia Open. 2025. PMID: 39976075 Free PMC article.
-
Alterations in the functional brain network in a rat model of epileptogenesis: A longitudinal resting state fMRI study.Neuroimage. 2019 Nov 15;202:116144. doi: 10.1016/j.neuroimage.2019.116144. Epub 2019 Aug 29. Neuroimage. 2019. PMID: 31473355
-
Dynamic functional connectivity and graph theory metrics in a rat model of temporal lobe epilepsy reveal a preference for brain states with a lower functional connectivity, segregation and integration.Neurobiol Dis. 2020 Jun;139:104808. doi: 10.1016/j.nbd.2020.104808. Epub 2020 Feb 19. Neurobiol Dis. 2020. PMID: 32087287
-
Neuroimaging correlates of language network impairment and reorganization in temporal lobe epilepsy.Brain Lang. 2019 Jun;193:31-44. doi: 10.1016/j.bandl.2016.06.002. Epub 2016 Jul 5. Brain Lang. 2019. PMID: 27393391 Free PMC article. Review.
-
Network analysis for a network disorder: The emerging role of graph theory in the study of epilepsy.Epilepsy Behav. 2015 Sep;50:162-70. doi: 10.1016/j.yebeh.2015.06.005. Epub 2015 Jul 6. Epilepsy Behav. 2015. PMID: 26159729 Review.
Cited by
-
Spatial and temporal profile of high-frequency oscillations in posttraumatic epileptogenesis.Neurobiol Dis. 2021 Dec;161:105544. doi: 10.1016/j.nbd.2021.105544. Epub 2021 Nov 3. Neurobiol Dis. 2021. PMID: 34742877 Free PMC article.
-
Epilepsy-related functional brain network alterations are already present at an early age in the GAERS rat model of genetic absence epilepsy.Front Neurol. 2024 Mar 11;15:1355862. doi: 10.3389/fneur.2024.1355862. eCollection 2024. Front Neurol. 2024. PMID: 38529038 Free PMC article.
-
Intrinsic brain network stability during kainic acid-induced epileptogenesis.Epilepsia Open. 2025 Apr;10(2):508-520. doi: 10.1002/epi4.70002. Epub 2025 Feb 20. Epilepsia Open. 2025. PMID: 39976075 Free PMC article.
-
Brain networks and epilepsy development in patients with Alzheimer disease.Brain Behav. 2023 Aug;13(8):e3152. doi: 10.1002/brb3.3152. Epub 2023 Jul 7. Brain Behav. 2023. PMID: 37416994 Free PMC article.
-
Small loci of astroglial glutamine synthetase deficiency in the postnatal brain cause epileptic seizures and impaired functional connectivity.Epilepsia. 2021 Nov;62(11):2858-2870. doi: 10.1111/epi.17072. Epub 2021 Sep 18. Epilepsia. 2021. PMID: 34536233 Free PMC article.
References
-
- Blumcke I. Neuropathology of focal epilepsies: a critical review. Epilepsy Behav 2009;15:34–39. - PubMed
-
- Engel J Jr. Mesial temporal lobe epilepsy: what have we learned? Neuroscientist 2001;7:340–352. - PubMed
-
- Tracy JI, Doucet GE. Resting-state functional connectivity in epilepsy: growing relevance for clinical decision making. Curr Opin Neurol 2015;28:158–165. - PubMed
Publication types
MeSH terms
Grants and funding
LinkOut - more resources
Full Text Sources
Other Literature Sources
