. 2021 Mar 15;17(3):e1008013.
doi: 10.1371/journal.pcbi.1008013. eCollection 2021 Mar.

Linear-nonlinear cascades capture synaptic dynamics

Affiliations

Linear-nonlinear cascades capture synaptic dynamics

Julian Rossbroich et al. PLoS Comput Biol. .

Abstract

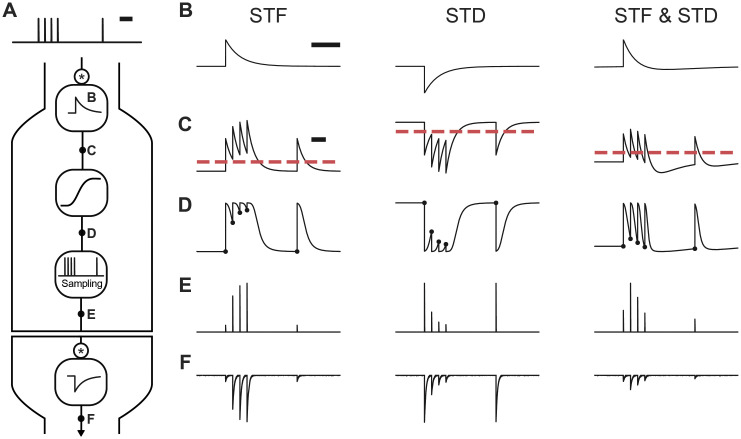
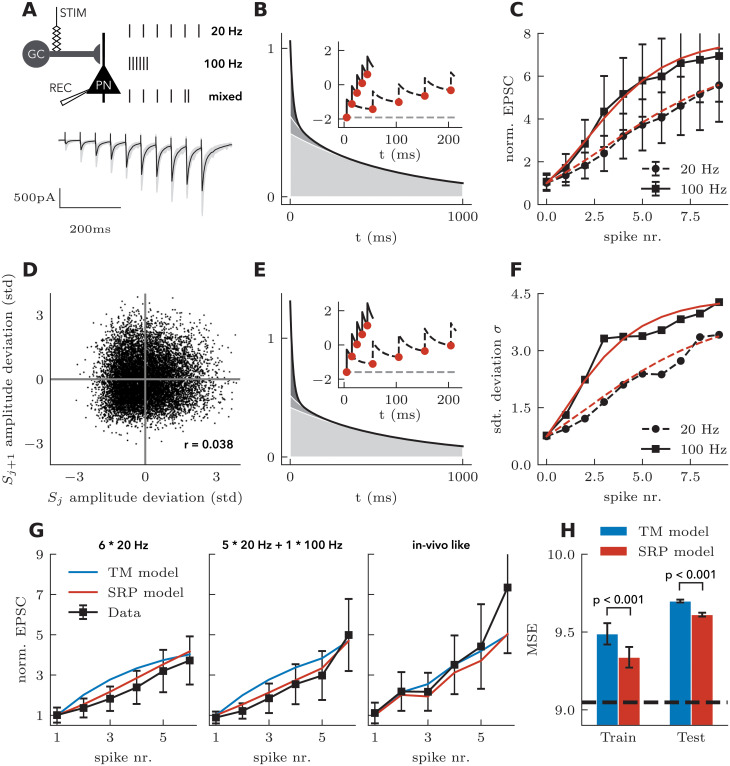
Short-term synaptic dynamics differ markedly across connections and strongly regulate how action potentials communicate information. To model the range of synaptic dynamics observed in experiments, we have developed a flexible mathematical framework based on a linear-nonlinear operation. This model can capture various experimentally observed features of synaptic dynamics and different types of heteroskedasticity. Despite its conceptual simplicity, we show that it is more adaptable than previous models. Combined with a standard maximum likelihood approach, synaptic dynamics can be accurately and efficiently characterized using naturalistic stimulation patterns. These results make explicit that synaptic processing bears algorithmic similarities with information processing in convolutional neural networks.


Conflict of interest statement

The authors have declared that no competing interests exist.

Figures

Fig 1
Fig 1. The SRP model captures different types of short-term plasticity.
(A) The model first passes a pre-synaptic spike train through a convolution with the efficacy kernel. We illustrate three choices of this efficacy kernel: (B), a positive kernel for STF (left), a negative kernel for STD (middle) and one for STF followed by STD (right). After the convolution and combination with a baseline (C; dashed line indicates zero), a nonlinear readout is applied, leading to the time-dependent efficacy μ(t) (D). This time-dependent signal is then sampled at the spike times, leading to the efficacy train (E) and thus to the post-synaptic current trace (F). Scale bars correspond to 100 ms.
Fig 2
Fig 2. Effects of extracellular calcium concentration on STP dynamics at hippocampal mossy fiber synapses.
A Mossy fiber short-term facilitation in 1.2 mM (red) and 2.5 mM (blue) extracellular [Ca2+]. PSCs recorded from CA3 pyramidal cells in response to stimulation of presynaptic mossy fibers (50 Hz, 5 stimuli). B PSC peak amplitudes as a function of stimulus number. The time course of facilitation varies dependent on the initial release probability. C The coefficient of variation (CV), measured as the standard deviation of PSCs divided by the mean, is increased in 1.2 mM extracellular [Ca2+]. Data redrawn from Chamberland et al. (2014) [22].
Fig 3
Fig 3. Modeling sublinear and supralinear facilitation through changes in the baseline parameter.
A Mechanism of the classic TM model [–26], illustrated in response to 5 spikes at 50 Hz for different values of the baseline parameter U. B Synaptic efficacy uR at each spike according to the classic TM model. Facilitation is always restricted to sublinear dynamics. C Mechanism and D Synaptic efficacy uR at each spike according to the extended TM model (see Methods). Choosing the baseline parameter U sufficiently small allows for supralinear facilitation. E Mechanism of the SRP model, illustrated for two different values of the baseline parameter b, with the same synaptic efficacy kernel kμ (left). Changing the baseline parameter b leads to a linear displacement of the filtered spike train kμ * S + b (middle), which causes a shift from sub- to supralinear dynamics after the nonlinear readout f(kμ * S + b). F Resulting synaptic efficacy at each spike according to the SRP model. Changing the baseline parameter causes a switch from sublinear to supralinear facilitation, as observed experimentally in response to varying extracellular [Ca2+] (see Fig 2).
Fig 4
Fig 4. Post-burst facilitation captured by a delayed facilitation kernel.
A Experimental setup and B measurement of post-burst facilitation in CA3 interneurons (redrawn from Ref. [6]). C Synaptic plasticity model. A delayed facilitation kernel was chosen as the sum of three normalized Gaussians with amplitudes {125, 620, 1300}, means {1.0, 2.5, 6.0} s and standard deviation {0.6, 1.3, 2.8} s. The spike train (8 spikes at 100 Hz followed by a test spike) is convolved with the delayed facilitation kernel. A nonlinear (sigmoidal) readout of the filtered spike train leads to synaptic efficacies. Dashed lines indicate zero. D Efficacies of test spikes in the synaptic plasticity model as a function of the number of action potentials in the preceding burst. E Synaptic efficacy of test spikes (3 s after a single burst at 160 Hz) as a function of the number of action potentials (APs). Data redrawn from Ref. [6].
Fig 5
Fig 5. Capturing heteroskedasticity with a two-kernel approach.
A The μ-kernel regulating the dynamics of the mean amplitude is paired with a σ-kernel regulating the dynamics of the variance. Three σ-kernels are shown: a variance increasing (teal), a variance invariant (orange) and a variance decreasing (blue) kernel. B Sample PSC responses to a spike train generated from the three σ-kernels (gray lines) along with the associated mean (full lines). C Probability density function of the amplitude of the first (left) and last (right) pulse. D The mean amplitude is unaffected by different σ-kernels. E The standard deviation is either increasing (teal), invariant (orange) or decreasing (blue), consistent with the polarity of the σ-kernel. F The coefficient of variation results from a combination of μ and σ kernel properties.
Fig 6
Fig 6. Capturing effect of external calcium concentration on coefficient of variation through baseline of μ-kernel.
A Comparing facilitating μ-kernels with high (blue) and low (red) baseline but fixed, σ-kernel. B-F as in Fig 5. The coefficient of variation increases with pulse number for the low baseline case, but decreases with pulse number for the high baseline case.
Fig 7
Fig 7. Statistical inference of kinetic properties on surrogate data.
A Simulated Poisson spike trains mark pre-synaptic stimulation. B Simulated post-synaptic currents of the spike train in A for independent sampling (thin black lines) and mean efficacy (thick black line) of the true parameter set (top) and of the inferred parameter set (bottom). C-F Negative log-likelihood landscape, true parameters (black stars) and function minima (red stars) as a function of C μ- and σ-kernel amplitudes, D σ baseline and scaling factor, E μ and σ baseline and F σ scaling and amplitude. G Average σ parameter errors as function training size. H average μ parameter errors as a function of training size (right). I Mean square error (MSE) of the inferred and model on an independent test set as a function of training size. Dashed line is MSE between independent samples of the true parameter set.
Fig 8
Fig 8. Experimental validation of the SRP model.
A Experimental schematic (top) and representative PSCs recorded from CA3 pyramidal cells in response to stimulation of mossy fibers (bottom). B Optimal efficacy kernel (black line) is made of the combination of three exponentially decaying functions (shades of gray) with time constants τ = [15, 100, 650] ms. Inset shows the quantity kμ * S + bμ in response to 100 Hz (full black line) and 20 Hz (dashed black line) train. Circles indicate times where the nonlinear readout is taken and the dashed gray line indicates the baseline. C Normed PSC for SRP model (red lines) and data (black lines) for the regular 20 Hz (dashed lines) and 100 Hz (full lines) protocols. D Experimental PSC amplitude deviation (difference between an observation and its trial average) against the previous PSC amplitude deviation. E Optimal σ-kernel and illustration of kσ * S + bσ. F As in C but showing the standard deviation. G Predictions of stimulation protocols held out from training. TM model (blue) and SRP model (red) predictions are shown with data (black) for the 20 Hz stimulation (left), 5x20 Hz+1x100 Hz stimulation (center) and in-vivo like stimulation (right). H Mean squared error (MSE) of models (bars) and variance of the data (dashed line), averaged across stimulation protocols.
Fig 9
Fig 9. A synaptic contribution to the hierarchy of linear-nonlinear computations.
A Synapses distributed on primary (orange, blue and green) and secondary (yellow and red) dendrites may have different synaptic properties (different color tints). B Each synapse is characterized by two kernels separated by a nonlinear sampling operation. 1) A pre-synaptic convolution kernel regulates synaptic dynamics. 2) A post-synaptic convolution kernel regulates the shape of the post-synaptic potential locally. The post-synaptic potentials from different synapses are summed within each dendritic compartment, forming a processing hierarchy converging to the soma.

Similar articles

Cited by

References

    1. Feng T. Studies on the neuromuscular junction. XXVI. The changes of the end-plate potential during and after prolonged stimulation. Chinese Journal of Physiology. 1941;16:341–372.
    1. Eccles JC, Katz B, Kuffler SW. Nature of the “endplate potential” in curarized muscle. Journal of Neurophysiology. 1941;4(5):362–387. 10.1152/jn.1941.4.5.362 - DOI
    1. Magleby K, Zengel JE. A dual effect of repetitive stimulation on post-tetanic potentiation of transmitter release at the frog neuromuscular junction. The Journal of Physiology. 1975;245(1):163–182. 10.1113/jphysiol.1975.sp010839 - DOI - PMC - PubMed
    1. Varela JA, Sen K, Gibson J, Fost J, Abbott L, Nelson SB. A quantitative description of short-term plasticity at excitatory synapses in layer 2/3 of rat primary visual cortex. Journal of Neuroscience. 1997;17(20):7926–7940. 10.1523/JNEUROSCI.17-20-07926.1997 - DOI - PMC - PubMed
    1. Zucker RS, Regehr WG. Short-term synaptic plasticity. Annual Review of Physiology. 2002;64(1):355–405. 10.1146/annurev.physiol.64.092501.114547 - DOI - PubMed

Publication types

Grants and funding

LinkOut - more resources