. 2021 Mar 15;17(3):e1009363.
doi: 10.1371/journal.ppat.1009363. eCollection 2021 Mar.

Innate immune signatures to a partially-efficacious HIV vaccine predict correlates of HIV-1 infection risk

Affiliations

Innate immune signatures to a partially-efficacious HIV vaccine predict correlates of HIV-1 infection risk

Erica Andersen-Nissen et al. PLoS Pathog. .

Abstract

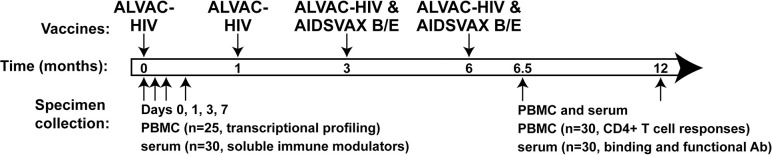
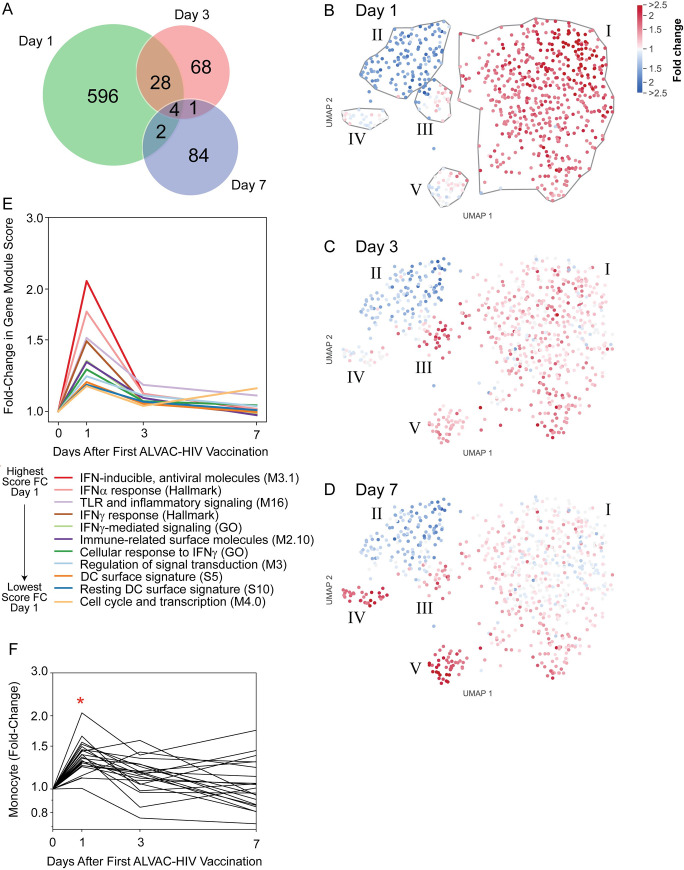
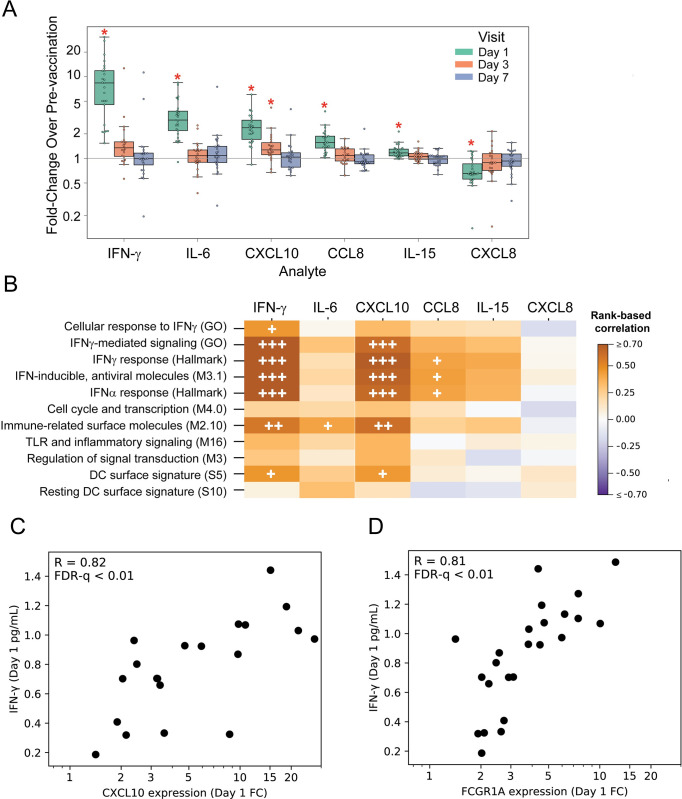
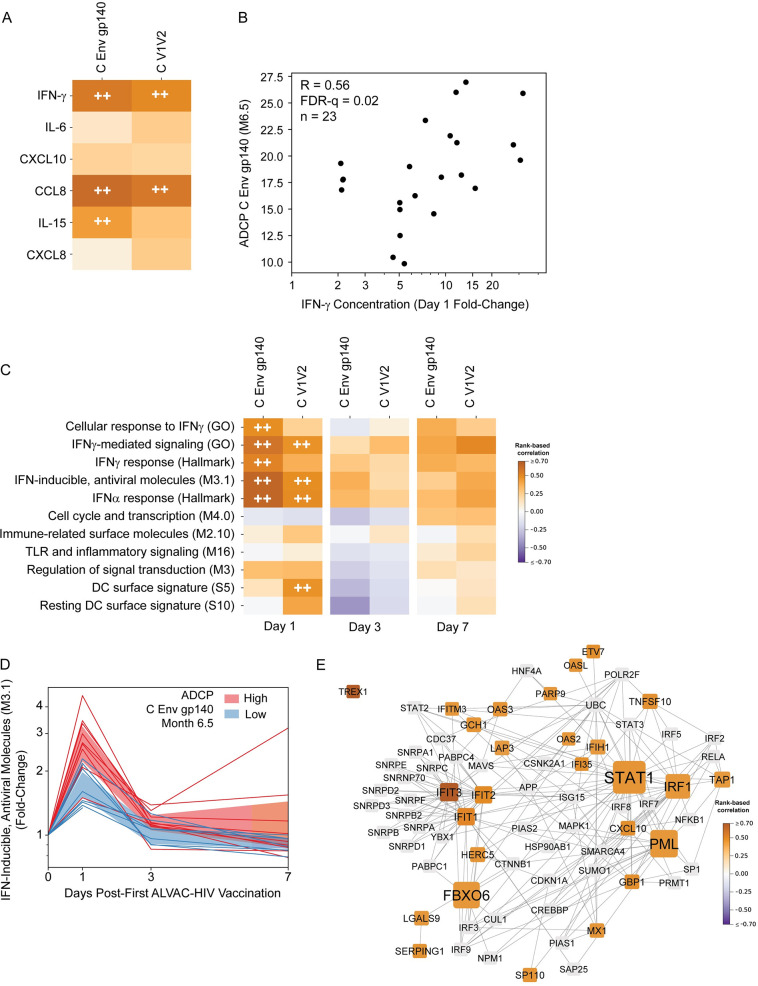
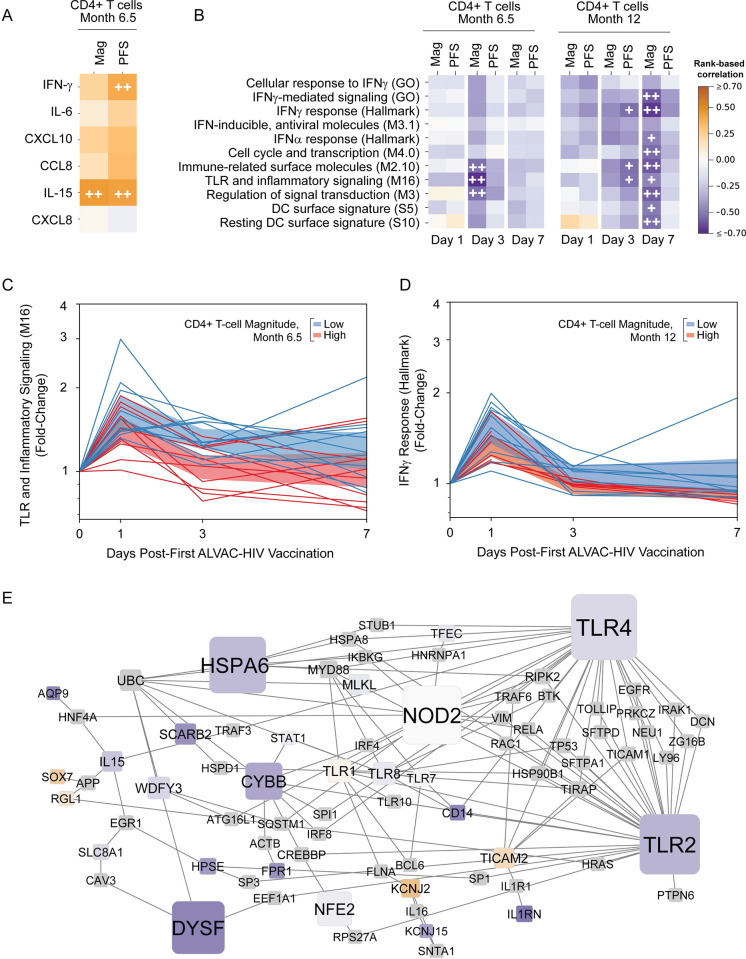
The pox-protein regimen tested in the RV144 trial is the only vaccine strategy demonstrated to prevent HIV-1 infection. Subsequent analyses identified antibody and cellular immune responses as correlates of risk (CoRs) for HIV infection. Early predictors of these CoRs could provide insight into vaccine-induced protection and guide efforts to enhance vaccine efficacy. Using specimens from a phase 1b trial of the RV144 regimen in HIV-1-uninfected South Africans (HVTN 097), we profiled innate responses to the first ALVAC-HIV immunization. PBMC transcriptional responses peaked 1 day post-vaccination. Type I and II interferon signaling pathways were activated, as were innate pathways critical for adaptive immune priming. We then identified two innate immune transcriptional signatures strongly associated with adaptive immune CoR after completion of the 4-dose regimen. Day 1 signatures were positively associated with antibody-dependent cellular cytotoxicity and phagocytosis activity at Month 6.5. Conversely, a signature present on Days 3 and 7 was inversely associated with Env-specific CD4+ T cell responses at Months 6.5 and 12; rapid resolution of this signature was associated with higher Env-specific CD4+ T-cell responses. These are the first-reported early immune biomarkers of vaccine-induced responses associated with HIV-1 acquisition risk in humans and suggest hypotheses to improve HIV-1 vaccine regimens.


Conflict of interest statement

The authors have declared that no competing interests exist.

Figures

Fig 1
Fig 1. Specimen collection for immune response evaluation in the active groups in the HVTN 097 trial.
South African study participants received ALVAC-HIV at Months 0 and 1 followed by ALVAC-HIV and AIDSVAX B/E at Months 3 and 6. PBMC and serum/plasma were collected pre-vaccination and at Days 1, 3 and 7 after the first ALVAC-HIV vaccination for evaluation of innate immune responses and at 2 weeks and 6 months after the fourth vaccination for evaluation of adaptive immune responses.
Fig 2
Fig 2. PBMC transcriptional changes after ALVAC-HIV vaccination in 25 vaccine recipients peak at Day 1 and comprise a signature of 11 functional gene modules.
A) Numbers of differentially-expressed genes (DEGs) on Days 1, 3, and 7 post-vaccination and their overlap. B-D) Two-dimensional UMAP embedding of genes (circles) at Day 1 (B), Day 3 (C), and Day 7 (D); genes closer together are more highly correlated across participants and over time. Color intensity indicates log fold-change in expression relative to baseline. Gray lines encircle groups of coordinately expressed genes. E) Eleven transcriptional modules were significantly enriched with Day 1 DEGs (FDR-q<0.2). No modules were significantly enriched with Day 3 or Day 7 DEGs. F) Cellular enrichment analysis of RNA-seq data using immunoStates [22] showing Day 1 enrichment of monocytes. Each line represents one participant. *significant enrichment versus baseline (FWER < 0.05).
Fig 3
Fig 3. ALVAC-HIV vaccination rapidly induces alterations in serum cytokines and chemokines that are temporally associated with several PBMC gene expression modules (n = 24).
A) Fold-change serum soluble factors after vaccination. Boxes extend through the interquartile range (IQR), with whiskers extending to the lowest and highest points within 1.5 times the IQR. Asterisks denote significant fold-changes in concentration relative to baseline (FWER-p<0.05, Wilcoxon signed-rank test). B) Correlations between fold-change in gene expression at Day 1 for each GSEA gene module with significant Day 1 fold-change in serum factor concentration. FDR-q: <0.2 (+), <0.1 (++), or <0.01 (+++). C, D) Scatterplots of Day 1 fold-change in expression of 2 example genes vs. serum IFN-γ concentrations. Each dot represents a single participant; R values represent the strength of the rank-based correlations.
Fig 4
Fig 4. Strong associations between Day 1 changes in gene expression and Month 6.5 Env-specific antibody-dependent cellular phagocytosis (ADCP) responses.
A) Heatmaps represent the strength of rank-based correlations of fold-change in serum cytokine concentrations with Month 6.5 ADCP responses. HIV-1 Env ADCP antigens are shown in columns. For detailed antigen names, see Materials and Methods. FDR-q <0.1 (++). B) Scatterplot of Day 1 fold-change of serum IFN-γ concentration vs. Month 6.5 ADCP C Env gp140 activity. Each dot represents a single participant response; R values in the upper left of the panel represent the strength of the rank-based correlations. C) Heatmaps represent the strength of rank-based correlations of fold-change in gene module scores with Month 6.5 ADCP responses. HIV-1 Env antigens are shown in columns. For detailed antigen names, see Materials and Methods. FDR-q <0.1 (++). D) “IFN-inducible, antiviral molecules (M3.1)” average module scores at Days 1, 3, and 7. Each line represents the module score for 1 participant. Individual trajectories are colored by Month 6.5 median-split ADCP C Env gp140 activity (blue = low and red = high); shaded region shows 95% CI of mean. E) Protein-protein interaction (PPI) network generated from DEGs whose Day 1 log2 fold-change showed a significant correlation with Month 6.5 C Env gp140 ADCP responses and that were also present in one of the five gene modules whose Day 1 log2 fold-change correlated significantly with Month 6.5 C Env gp140 ADCP responses. Edges represent protein-protein interactions. Nodes are sized according to degree; only nodes that had degree ≥3 in the original network generated from all the genes from the above modules are shown. Nodes are colored according to correlation of Day 1 log2 fold-change with C Env gp140 ADCP response magnitude at Month 6.5; only significant correlations are colored. Nodes with non-significant correlations are shown in gray.
Fig 5
Fig 5. Rapid resolution of the early innate response is associated with higher CD4+ T-cell responses to HIV-1 Env at Months 6.5 and 12.
A) Heatmaps representing correlations between Month 6.5 Env-specific CD4+ T-cell magnitude (“Mag”) or polyfunctionality score (“PFS”) and Day 1 cytokine fold-change compared to baseline. FDR-q< 0.2 (+) or < 0.1 (++). B) Heatmaps representing correlations between average module scores and Month 12 Env-specific CD4+ T-cell Mag and PBS. FDR-q< 0.2 (+) or < 0.1 (++). C, D) “TLR and inflammatory signaling (M16)” (C) and “IFNγ response (Hallmark)” (D) module scores at Days 1, 3, and 7. Each line represents the module score for 1 participant. Individual trajectories colored by Month 6.5 median-split Env-specific CD4+ T-cell response magnitude (blue = low and red = high CD4+ T-cell response); shaded region shows 95% CI of mean. E) Protein-protein interaction subnetwork generated from DEGs present in the “Immune-related surface molecules (M2.10)”, “TLR and inflammatory signaling (M16)”, and “Regulation of signal transduction (M3)” modules. Edges represent protein-protein interactions. Nodes are sized according to degree; only nodes that had degree ≥2 in the original network generated from all the genes from the above modules are shown. Nodes are colored according to correlation of Day 3 log fold-change with CD4+ T-cell response magnitude at Month 6.5 (same key as in A). Non-DEGs are shown in gray.

Comment in

References

    1. UNAIDS. Global HIV & AIDS statistics—2019 fact sheet. https://www.unaids.org/en/resources/fact-sheet.
    1. Meyer-Rath G, van Rensburg C, Chiu C, Leuner R, Jamieson L, Cohen S. The per-patient costs of HIV services in South Africa: Systematic review and application in the South African HIV Investment Case. PLoS One 2019;14(2):e0210497. 10.1371/journal.pone.0210497 - DOI - PMC - PubMed
    1. Tomaras GD, Plotkin SA. Complex immune correlates of protection in HIV-1 vaccine efficacy trials. Immunol Rev. 2017;275(1):245–61. 10.1111/imr.12514 - DOI - PMC - PubMed
    1. Slomski A, Leading HIV. Vaccine Trial Stopped for Ineffectiveness. JAMA. 2020;323(12):1124. 10.1001/jama.2020.2813 - DOI - PubMed
    1. Rerks-Ngarm S, Pitisuttithum P, Nitayaphan S, Kaewkungwal J, Chiu J, Paris R, et al.. Vaccination with ALVAC and AIDSVAX to prevent HIV-1 infection in Thailand. N Engl J Med. 2009;361(23):2209–20. 10.1056/NEJMoa0908492 - DOI - PubMed

Publication types

MeSH terms