. 2021 Mar 15;17(3):e1008866.
doi: 10.1371/journal.ppat.1008866. eCollection 2021 Mar.

Aerobic glycolysis supports hepatitis B virus protein synthesis through interaction between viral surface antigen and pyruvate kinase isoform M2

Affiliations

Aerobic glycolysis supports hepatitis B virus protein synthesis through interaction between viral surface antigen and pyruvate kinase isoform M2

Yi-Hsuan Wu et al. PLoS Pathog. .

Abstract

As an intracellular pathogen, the reproduction of the hepatitis B virus (HBV) depends on the occupancy of host metabolism machinery. Here we test a hypothesis if HBV may govern intracellular biosynthesis to achieve a productive reproduction. To test this hypothesis, we set up an affinity purification screen for host factors that interact with large viral surface antigens (LHBS). This identified pyruvate kinase isoform M2 (PKM2), a key regulator of glucose metabolism, as a binding partner of viral surface antigens. We showed that the expression of viral LHBS affected oligomerization of PKM2 in hepatocytes, thereby increasing glucose consumption and lactate production, a phenomenon known as aerobic glycolysis. Reduction of PKM2 activity was also validated in several different models, including HBV-infected HepG2-NTCP-C4 cells, adenovirus mediated HBV gene transduction and transfection with a plasmid containing complete HBV genome on HuH-7 cells. We found the recovery of PKM2 activity in hepatocytes by chemical activators, TEPP-46 or DASA-58, reduced expressions of viral surface and core antigens. In addition, reduction of glycolysis by culturing in low-glucose condition or treatment with 2-deoxyglucose also decreased expressions of viral surface antigen, without affecting general host proteins. Finally, TEPP-46 largely suppressed proliferation of LHBS-positive cells on 3-dimensional agarose plates, but showed no effect on the traditional 2-dimensional cell culture. Taken together, these results indicate that HBV-induced metabolic switch may support its own translation in hepatocytes. In addition, aerobic glycolysis is likely essential for LHBS-mediated oncogenesis. Accordingly, restriction of glucose metabolism may be considered as a novel strategy to restrain viral protein synthesis and subsequent oncogenesis during chronic HBV infection.


Conflict of interest statement

The authors have declared that no competing interests exist.

Figures
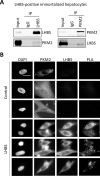
Fig 1
Fig 1. PKM2 is a binding partner of viral LHBS.
(A) Reciprocal immunoprecipitations using control IgG, anti-LHBS (anti-PreS1, clone 7H11), and anti-PKM2 antibodies were carried out using total cell lysates prepared from an immortalized hepatocyte line stably expressing LHBS. Representative immunoblots from three independent experiments are shown. (B) Visualization of PKM2-LHBS interactions in immortalized hepatocytes by proximity ligation assay (PLA). Control and LHBS-positive cells were stained with primary antibodies against LHBS/PreS1 and PKM2, followed by incubation with Duolink PLA probes detecting LHBS/PKM2 interactions and fluorescent labeled secondary antibodies. The cell nuclei were stained with DAPI. Three representative images were shown for each category. Scale bar denotes 10 μm.
Fig 2
Fig 2. Identifying the minimal binding region of LHBS and PKM2.
(A) Total cell lysates of HuH-7 cells transfected with pHBV3.6 plasmid were harvested for affinity immunoprecipitations using control immunoglobulin (IgG), monoclonal (mAb, clone 86H6) and polyclonal (pAb, Abnova) anti-HBS antibodies. The resulted immunoprecipitants were probed with anti-HBS mAb (86H6) and anti-PKM2 antibodies. Representative immunoblots were shown. (B) 293T cells were transiently transfected with expression constructs of HA-PKM2 and SNAP-tagged-LHBS, -MHBS, -SHBS, and -PreS, as indicated, for 2 days, and total cell lysates were harvested for affinity immunoprecipitation using a mouse anti-HA antibody. Representative immunoblots using anti-PKM2 and anti-SNAP antibodies were shown. (C) Immortalized hepatocytes stably expressing LHBS were transfected with expression constructs of HA-PKM2 encoding different truncation fragments as indicated. Total cell lysates were harvested at 2 days post transfection and subjected to affinity immunoprecipitation using anti-HA antibody. Representative immunoblots of HA-PKM2 and LHBS detected by anti-HA and anti-LHBS/PreS1 antibodies were shown. *denotes the high exposure image of the low molecular weight protein HA-367-476.
Fig 3
Fig 3. HBV reduces PKM2 kinase activity and provokes aerobic glycolysis.
(A) HepG2-NTCP-C4 cells were infected with HBV virions at 1000 MOI in the presence of 4% PEG8000 and 2.5% DMSO. Secretions of viral HBsAg and HBeAg were measured in culture supernatants harvested at indicated time. Signal-to-cutoff (s/co) values of HBsAg and HBeAg were shown. (B) HepG2-NTCP-C4 cells were infected with HBV at 1000 MOI for 9 days and total cell lysates were harvested for the detection of LHBS, SHBS and PKM2 by western blotting. GAPDH expression was detected as an internal control. (C) HepG2-NTCP-C4 cells were infected with or without HBV at 1000 MOI for 9 days. Total cell lysates were collected for measuring PKM2 kinase activity. Relative PKM2 activities were shown after normalization with that of non-infected cells. (D) PKM2 activities measured in immortalized hepatocytes with or without LHBS expression. Relative PKM2 activities were shown after normalization with that of control cells. (E) Representative western blots showing expressions of LHBS and PKM2 on immortalized hepatocytes. The right panel showed relative quantitation of PKM2 after normalization with PKM2 intensity of control cells. GAPDH was detected as a loading control. (F) Total cell lysates of immortalized hepatocytes were treated with or without 0.1% glutaraldehyde (GA) for 20 min crosslinking before denatured for SDS gel electrophoresis and western blotting. Representative blot of PKM2 is shown. The right panel indicates relative signals of PKM2 dimer detected in the white box area on the blot, after normalization with total PKM2. (G) Glycerol density gradient centrifugations of PKM2 in control and LHBS-expressing immortalized hepatocytes. Total cell lysates were loaded on top of the 15–35% glycerol gradient and the samples were centrifuged at 50000 rpm for 16 hours at 4°C. Fractions were collected and subjected to western blotting with anti-PKM2 antibody. PKM2 density was calculated and plotted the graph against each fraction in the lower panel. (H) Glucose consumption and lactate production in the culture media of control and LHBS-expressing immortalized hepatocytes were measured. All quantitative results were a summary of three repeats and data were displayed as mean ± standard error. *p<0.05, **p<0.01, and ***p<0.001 were calculated using Student’s t test.
Fig 4
Fig 4. Infection of Ad-HBV-WT increases PKM2 dimerization.
(A) HuH-7 cells were infected with either Ad-HBV-KO or Ad-HBV-WT at indicated MOI for 2 days. Representative blots of viral LHBS and tubulin were shown. (B) Total cell lysates of HuH-7 cells infected with Ad-HBV were collected and treated with or without glutaraldehyde (GA) crosslinking for 20 minutes. Representative blot of PKM2 is shown. The left panel showed relative PKM2 dimer in each treatment group. The quantity of dimeric PKM2 was defined by signal detected in white rectangular region of each sample, after normalization with total PKM2 detected in the non-crosslinking samples. (C) HepG2 cells were infected with either Ad-HBV-KO or Ad-HBV-WT at indicated MOI for 2 days. Representative blots of viral LHBS, PKM2, and tubulin were shown. (D) PKM2 dimerization in Ad-HBV infected HepG2 cells was measured by western blot shown on the left panel and quantitation results shown on the right panel. (E) HuH-7 cells were infected with Ad-HBV-KO or Ad-HBV-WT for 2 days and lysates were collected for measuring PKM2 activity. Relative PKM2 activities in Ad-HBV-WT infected cells were shown after normalization with that of Ad-HBV-KO infected cells. All quantitative results were displayed as mean ± standard error from three replicates. *p<0.05, **p<0.01, and ***p<0.001 were calculated using Student’s t test.
Fig 5
Fig 5. TEPP-46 reduces protein synthesis of HBV in HuH-7 cells.
HuH-7 cells were transfected with pHBV3.6 for 24 hours and then treated with DMSO or 20 μΜ TEPP-46 for additional 24 hours. (A) The culture media of DMSO or TEPP-46 treatment were collected and subjected for measurement of HBsAg and HBeAg level. (B) Protein expressions of HBV viral products (left panel) and host proteins (right panel) upon treatment of DMSO or TEPP-46 were shown in western blotting. (C) Quantitative results of viral and host protein expressions were shown, with actin as an internal control. All quantitative results were a summary of three repeats and data were displayed as mean ± standard error. *p<0.05, **p<0.01, and ***p<0.001 were calculated using Student’s t test.
Fig 6
Fig 6. Activators of PKM2 diminished HBV reproduction.
(A) LHBS-positive immortalized hepatocytes were treated with DMSO or 50 μΜ DASA-58 for 2 days. Total cell lysates were collected for measuring PKM2 activity. Relative PKM2 kinase activity of LHBS-positive cells was shown after normalization with that of DMSO treatment cells. (B) HuH-7 cells were transfected with pHBV3.6 for 24 hours and then treated with DMSO or 50 μΜ DASA-58 for additional 24 hours. Production of HBsAg and HBeAg in the culture supernatants were measured. Relative extracellular HBsAg and HBeAg were shown with DMSO-treated group as an internal control. (C) HuH-7 cells were transfected with pHBV3.6 for 24 hours and then treated with DMSO or 50 μΜ DASA-58 for additional 24 hours. Representative western blots of HBV viral products were shown on the left panels. The right panel showed changes of indicated viral products after DASA-58 treatment in comparison to DMSO-treated cells as the control. (D) Intracellular abundance of 6-PGA was measured in pHBV3.6-transfected HuH-7 cells following treatments of DMSO, 20 μM TEPP-46 or 50 μΜ DASA-58 for 24 hours. Quantitative results of 6-PGA relative abundance were shown. (E) The production of virions in HBV-infected HepG2-NTCP-C4 cells, with or without treatments of chemical PKM2 activators were measured by detecting HBV DNA in the culture supernatant using quantitative PCR. All quantitative results were a summary of three repeats and data were displayed as mean ± standard error. *p<0.05, **p<0.01, and ***p<0.001 were calculated using Student’s t test.
Fig 7
Fig 7. Reduction of glucose support suppresses protein synthesis of HBV.
(A) HuH-7 cells were infected with Ad-HBV-WT at 200 MOI for 24 hours and then changed the medium containing high (4.5g/L) or low (1g/L) glucose for additional 24 hours. Extracellular levels of HBsAg and HBeAg were measured by the Cobas assay. The bar charts showed quantitative results after normalization with results obtained from the high-glucose condition. (B) General cell viabilities measured in high- and low-glucose conditions were shown. (C) Representative blots of LHBS, HBcAg, and GAPDH in Ad-HBV infected HuH-7 cells under different glucose supply were shown. All quantitative results were a summary of at least three repeats and data were displayed as mean ± standard error. **p<0.01, and ***p<0.001 were calculated using Student’s t test.
Fig 8
Fig 8. HBV protein synthesis is suppressed by 2-DG.
HuH-7 cells were infected with Ad-HBV-WT for 24 hours and then treated with 0, 0.5, 1, 5 and 10mM of 2-DG for another 24 hours. The culture media were collected for measuring glucose consumption and lactate production (A), and the secretion of HBsAg and HBeAg (B). (C) Total protein lysates of each treatment were collected for the detection of intracellular LHBS and HBcAg by Western blotting. Representative blots were shown on the left panels. Quantitative results showing relative expressions of LHBS and HBcAg were shown, using non-treated groups (0 mM) as an internal control. All quantitative results were a summary of at least three repeats and data were displayed as mean ± standard error. *p<0.05, ** p<0.01, and ***p<0.001 were calculated using Student’s t test.
Fig 9
Fig 9. PKM2 activators suppressed LHBS-mediated oncogenesis on immortalized hepatocytes.
(A) Colony formation assay was performed with control and LHBS-positive immortalized hepatocytes for 3 weeks in soft agar plates. Representative plate images are shown. No colony formation was detected in control cells. Quantitation of colony numbers were provided in the right panel. (B) LHBS-positive hepatocytes were treated with DMSO or 20 μΜ TEPP-46 for 24 hours and cell lysates were harvested for measuring PKM2 activity. (C) Cell viability was measured in LHBS-positive hepatocytes 48 hours after treatments with DMSO or 20 μΜ TEPP-46. (D) Representative colony formation images of control, and LHBS-positive hepatocytes treated with DMSO or 20 μΜ TEPP-46 were shown. Quantitation results of colony numbers were shown on the right panel. (E) Representative colony formation images of control, and LHBS-positive hepatocytes treated with DMSO or 50 μΜ DASA-58 were shown. Quantitation results of colony numbers were shown on the right panel. All quantitative results were a summary of three repeats and data were displayed as mean ± standard error. *p<0.05 was calculated using Student’s t test.

Similar articles

Cited by

References

    1. Polaris Observatory C. Global prevalence, treatment, and prevention of hepatitis B virus infection in 2016: a modelling study. Lancet Gastroenterol Hepatol. 2018;3(6):383–403. Epub 2018/03/31. 10.1016/S2468-1253(18)30056-6 . - DOI - PubMed
    1. Nassal M. HBV cccDNA: viral persistence reservoir and key obstacle for a cure of chronic hepatitis B. Gut. 2015;64(12):1972–84. Epub 2015/06/07. 10.1136/gutjnl-2015-309809 . - DOI - PubMed
    1. Bock CT, Schwinn S, Locarnini S, Fyfe J, Manns MP, Trautwein C, et al.. Structural organization of the hepatitis B virus minichromosome. J Mol Biol. 2001;307(1):183–96. Epub 2001/03/13. 10.1006/jmbi.2000.4481 . - DOI - PubMed
    1. Chen MT, Billaud JN, Sallberg M, Guidotti LG, Chisari FV, Jones J, et al.. A function of the hepatitis B virus precore protein is to regulate the immune response to the core antigen. Proc Natl Acad Sci U S A. 2004;101(41):14913–8. Epub 2004/10/08. 10.1073/pnas.0406282101 - DOI - PMC - PubMed
    1. Bertoletti A, Ferrari C. Innate and adaptive immune responses in chronic hepatitis B virus infections: towards restoration of immune control of viral infection. Gut. 2012;61(12):1754–64. Epub 2011/12/14. 10.1136/gutjnl-2011-301073 . - DOI - PubMed

Publication types

MeSH terms