. 2021 Jan;20(1):1-67.
doi: 10.1007/s43630-020-00001-x. Epub 2021 Jan 20.

Environmental effects of stratospheric ozone depletion, UV radiation, and interactions with climate change: UNEP Environmental Effects Assessment Panel, Update 2020

Affiliations

Environmental effects of stratospheric ozone depletion, UV radiation, and interactions with climate change: UNEP Environmental Effects Assessment Panel, Update 2020

R E Neale et al. Photochem Photobiol Sci. 2021 Jan.

Abstract

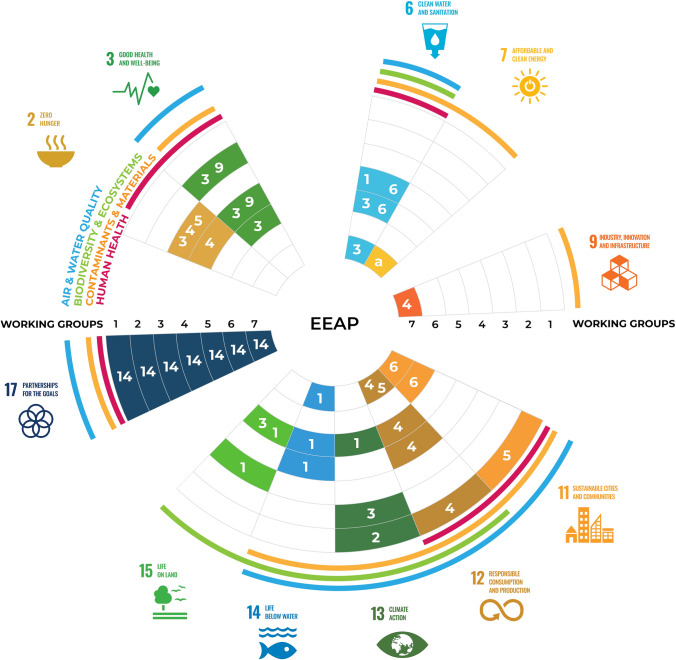
This assessment by the Environmental Effects Assessment Panel (EEAP) of the United Nations Environment Programme (UNEP) provides the latest scientific update since our most recent comprehensive assessment (Photochemical and Photobiological Sciences, 2019, 18, 595-828). The interactive effects between the stratospheric ozone layer, solar ultraviolet (UV) radiation, and climate change are presented within the framework of the Montreal Protocol and the United Nations Sustainable Development Goals. We address how these global environmental changes affect the atmosphere and air quality; human health; terrestrial and aquatic ecosystems; biogeochemical cycles; and materials used in outdoor construction, solar energy technologies, and fabrics. In many cases, there is a growing influence from changes in seasonality and extreme events due to climate change. Additionally, we assess the transmission and environmental effects of the severe acute respiratory syndrome coronavirus 2 (SARS-CoV-2), which is responsible for the COVID-19 pandemic, in the context of linkages with solar UV radiation and the Montreal Protocol.


Conflict of interest statement

The authors have no conflicts of interest.

Figures

Fig. 1
Fig. 1
The Sustainable Development Goals (SDG) relevant to this assessment are shown outside the circle with specific targets (numbers in white) linked to EEAP Working Groups (1–7, numbers in black) in concentric circles. These SDG targets include: 2.3 increase productivity of small-scale food producers; 2.4 ensure sustainable food production systems; 2.5 maintain genetic diversity of agricultural plants and animals; 3.3 end epidemics of communicable diseases; 3.9 reduce deaths caused by air; soil and water contamination; 6.1 achieve access to safe drinking water; 6.3 reduce water pollution; 6.6 protect water-related ecosystems; 7.A enhance international cooperation around clean energy; 9.4 upgrade industries to be sustainable; 11.5 reduce deaths caused by disasters; 11.6 reduce the environmental impact of cities; 12.4 achieve environmentally sound management of chemicals and wastes; 12.5 reduce waste generation; 13.1 Strengthen resilience to climate-related hazards and disasters; 13.2 integrate climate change measures into policy; strategy and planning; 13.3 improve education on climate-change mitigation; 14.1 reduce marine pollution; 14.3  minimise impacts of ocean acidification; 15.1 ensure the conservation of terrestrial ecosystems; 15.3 combat desertification; and 17.14 enhance policy coherence for sustainable development. Topics covered by the EEAP Working Groups 1–7 are: (1) Stratospheric ozone, UV radiation and climate interactions; (2) human health; (3) terrestrial ecosystems and biodiversity; (4) aquatic ecosystems; (5) biogeochemistry in a changing environment; (6) air quality; and (7) material damage (figure created by Emma Leslie, Global Challenges Program, Univ. of Wollongong, Australia)
Fig. 2
Fig. 2
Daily maximum UV indices measured at the South Pole (a) and Arrival Heights (b) in 2019 (red line) compared with the average (white line) and the range (grey shading) of daily maximum observations of the years 1991 to 2018. The UV indices were calculated from spectra measured by SUV-100 spectroradiometers. Up to 2009, the instruments were part of the NSF UV monitoring network [25] and they are now a node in the NOAA Antarctic UV Monitoring Network (https://www.esrl.noaa.gov/gmd/grad/antuv/). Consistent data processing methods were applied for all years [26, 27]
Fig. 3
Fig. 3
Age-standardised melanoma incidence from 1982 through 2015 and annual percentage change in eight populations: a United States whites; b Canada; c Australia; d New Zealand; e United Kingdom; f Denmark; g Sweden; and f Norway. APC annual percentage change; ASR age-standardised rate (US 2000). *The APC is significantly different from zero at α = 0.05. Reproduced with permission from [76]
Fig. 4
Fig. 4
Trends in melanoma mortality in Australia from 1982 to 2018 with projections to 2020. a number of deaths; b age-standardised mortality rate. Data from the Australian Institute of Health and Welfare National Mortality Database [80]. Figure produced by S. Byrne
Fig. 5
Fig. 5
Exposing the skin to UV radiation affects the local and systemic immune system. (1) UV is absorbed by skin chromophores including DNA, urocanic acid, and tryptophan metabolites. UV radiation-induced changes in cutaneous lipids can also affect the local and systemic immune systems. (2) Epidermal keratinocytes and Langerhans cells (LC), as well as dermal dendritic cells (DC) and mast cells (MC), respond to nitric oxide (NO) and UV radiation by releasing immune-modulatory cytokines including tumour necrosis factor (TNF) and interleukin 10 (IL-10). These events lead to the recruitment from blood of innate immune cells including IL-4-producing neutrophils (neut) and macrophages (MΦ). This recruitment and activation of the innate immune system is reinforced by (3) local production of vitamin D3 and its metabolites which, together with UV radiation, can induce the production of antimicrobial peptides (AMPs). These events are likely to influence the cutaneous microbiome which may increase skin irritation and rashes, and also alter immune responses to pathogens. Exposure to UV radiation also increases the diversity of the gut microbiome which has potential benefits for health. (4) In response to high and prolonged doses of UV radiation, regulatory T and B cells (TReg and BReg, respectively) are activated in lymph nodes that drain from local skin. The subsequent suppression of adaptive immune responses increases the risk of skin cancer but may explain why exposure to UV radiation may reduce the risk of autoimmune disease such as multiple sclerosis. Figure designed by S. Byrne
Fig. 6
Fig. 6
In recent decades, Antarctica has been shielded from some of the effects of global warming by shifts in the climate of the Southern Hemisphere that are related to stratospheric ozone depletion. The Antarctic summer of 2019/20 provides a recent example where the moderating effect of stratospheric ozone depletion on regional climate was likely diminished. An anomalously high total column ozone in the austral spring of 2019 (linked primarily to meteorological factors and not to significantly reduced stratospheric ODS concentrations) resulted from a weak and strongly disturbed polar vortex. Throughout the 2019/20 summer, high temperatures were recorded across Antarctica, which led to melting of ice and exposure of new ice-free areas. a Images of Eagle Island showing extensive melt associated with surface warming on 4th and 13th February 2020 (https://earthobservatory.nasa.gov/images/146322/antarctica-melts-under-its-hottest-days-on-record. b Monthly mean anomaly (the difference from climatological monthly mean) of 2 m air temperature from NCEP/NCAR Reanalysis 1 data [154] for February 2020. The climatology spans 1979 to 2019 (see S. A. Robinson et al. [43] for other summer months)
Fig. 7
Fig. 7
Phenotypic plasticity to spectral regions of solar radiation for shade-tolerant and shade-intolerant species. Light blue and orange bars indicate shade-tolerant (Mean ± 1SE, n = 9–11) and -intolerant (Mean ± 1SE, n = 3–12) plants growing in a filter experiment. Multiple spectral regions are UV radiation, blue-green light (BG), and UV and blue-green light (UV-BG). Plasticity index was calculated based on the response of 25 functional traits categorised into five groups: biochemistry, physiology, leaf morphology, the whole-plant morphology, and growth and allocation. Figure modified from Q–W. Wang et al. [175]
Fig. 8
Fig. 8
Effect of UV irradiation on mortality of the mixotrophic ciliate, Pelagodileptus trachelioides. Laboratory exposures to a UV-B + UV-A lamp, either unfiltered (UVR) or filtered to block wavelengths shorter than indicated. Data points: average mortality ± standard deviation (n = 12). Line: predicted mortality as a function of spectral irradiance weighted by the Daphnia survivorship biological weighting function (inset, [257]). Only treatments with UV-B radiation caused significant mortality. Redrawn from [253] using author-provided spectral irradiance data
Fig. 9
Fig. 9
Effect of ultraviolet radiation on the life stages of fish. RBA, respiratory burst activity; NCC, non-specific cytotoxic cells. From Alves and Agusti 2020 [263]
Fig. 10
Fig. 10
Potential effects of solar radiation and climate change on photodegradation of organic matter, greenhouse gas emissions, and carbon cycling in terrestrial ecosystems. Symbols: grey arrows indicate interactions between changes in stratospheric ozone, solar radiation, and climate changes on litter decomposition in mesic and dry ecosystems. Purple (solar UV-B radiation) and yellow (UV-A and visible radiation) arrows indicate direct effects on litter degradation (photomineralisation) and photoinhibition of decomposer organisms (dashed outline). Blue arrows indicate the process of photo-facilitation. Red arrows indicate the microbial contribution to litter decomposition. The symbols + and – indicate increased or decreased effect on a change or process, and thickness, its importance. Figure designed by Qing-Wei Wang
Fig. 11
Fig. 11
a Mean weighting function for photodegradation to CO2 from all litter types, with 95% CI, along with average solar noon spectral irradiance; b weighted solar noon irradiance, along with the total percentage effectiveness of the solar UV-B, UV-A and visible wavebands. Adapted from Day and Bliss [296]
Fig. 12
Fig. 12
Central role of UV-driven oxidation processes in the chemistry of the troposphere. Besides controlling the amount of UV radiation reaching the troposphere, stratospheric ozone (O3) is also a major source of tropospheric ozone via Stratosphere–Troposphere Exchange (STE). The rate of removal of many tropospheric pollutants [including volatile organic compounds (VOCs)] is determined by reaction with OH
Fig. 13
Fig. 13
Calculated mass of ozone transported from the stratosphere to the troposphere (STE) 1980–2010 in Tg/year. The blue curve is based on an estimate of the actual state of the atmosphere. The red curve is what would have happened if halogenated ODS emissions remained at 1979 levels. The numbers quoted are the slopes of the trend lines. Figure kindly supplied by M. Shin [361]
Fig. 14
Fig. 14
Physical, chemical and biological processes associated with plastics in the ocean environment. Courtesy of source [435]

Similar articles

Cited by

References

    1. Bernhard GH, Neale RE, Barnes PW, Neale PJ, Zepp RG, Wilson SR, et al. Environmental effects of stratospheric ozone depletion, UV radiation and interactions with climate change: UNEP Environmental Effects Assessment Panel, update 2019. Photochemical & Photobiological Sciences. 2020;19(5):542–584. doi: 10.1039/d0pp90011g. - DOI - PMC - PubMed
    1. Bais AF, Bernhard G, McKenzie RL, Aucamp PJ, Young PJ, Ilyas M, et al. Ozone-climate interactions and effects on solar ultraviolet radiation. Photochemical & Photobiological Sciences. 2019;18:602–640. doi: 10.1039/C8PP90059K. - DOI - PubMed
    1. Polvani LM, Previdi M, England MR, Chiodo G, Smith KL. Substantial twentieth-century Arctic warming caused by ozone-depleting substances. Nature Climate Change. 2020;10(2):130–133. doi: 10.1038/s41558-019-0677-4. - DOI
    1. Wigley TML. Future CFC concentrations under the Montreal Protocol and their greenhouse-effect implications. Nature. 1988;335(6188):333–335. doi: 10.1038/335333a0. - DOI
    1. Myhre G, Shindell D, Bréon FM, Collins W, Fuglestvedt J, Huang J, et al. Anthropogenic and natural radiative forcing. In: Stocker TF, Qin D, Plattner GK, Tignor M, Allen SK, Doschung J, et al., editors. Climate change 2013: The physical science basis. Contribution of Working Group I to the fifth assessment report of the Intergovernmental Panel on Climate Change. Cambridge: Cambridge University Press; 2013. pp. 659–740.

LinkOut - more resources