

Sugar modulation of anaerobic-response networks in maize root tips
- PMID: 33721892
- PMCID: PMC8133576
- DOI: 10.1093/plphys/kiaa029
Sugar modulation of anaerobic-response networks in maize root tips
Abstract
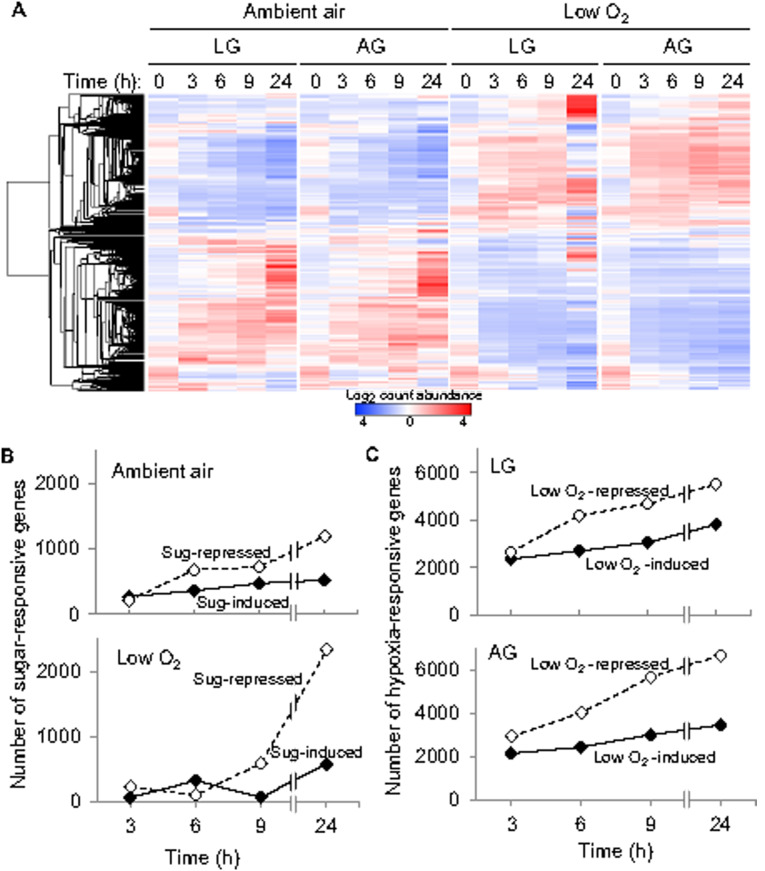
Sugar supply is a key component of hypoxia tolerance and acclimation in plants. However, a striking gap remains in our understanding of mechanisms governing sugar impacts on low-oxygen responses. Here, we used a maize (Zea mays) root-tip system for precise control of sugar and oxygen levels. We compared responses to oxygen (21 and 0.2%) in the presence of abundant versus limited glucose supplies (2.0 and 0.2%). Low-oxygen reconfigured the transcriptome with glucose deprivation enhancing the speed and magnitude of gene induction for core anaerobic proteins (ANPs). Sugar supply also altered profiles of hypoxia-responsive genes carrying G4 motifs (sources of regulatory quadruplex structures), revealing a fast, sugar-independent class followed more slowly by feast-or-famine-regulated G4 genes. Metabolite analysis showed that endogenous sugar levels were maintained by exogenous glucose under aerobic conditions and demonstrated a prominent capacity for sucrose re-synthesis that was undetectable under hypoxia. Glucose abundance had distinctive impacts on co-expression networks associated with ANPs, altering network partners and aiding persistence of interacting networks under prolonged hypoxia. Among the ANP networks, two highly interconnected clusters of genes formed around Pyruvate decarboxylase 3 and Glyceraldehyde-3-phosphate dehydrogenase 4. Genes in these clusters shared a small set of cis-regulatory elements, two of which typified glucose induction. Collective results demonstrate specific, previously unrecognized roles of sugars in low-oxygen responses, extending from accelerated onset of initial adaptive phases by starvation stress to maintenance and modulation of co-expression relationships by carbohydrate availability.
© American Society of Plant Biologists 2020. All rights reserved. For permissions, please email: journals.permissions@oup.com.
Figures


Comment in
-
Averting a sweet demise: sugars change the transcriptional hypoxia response in maize roots.Plant Physiol. 2021 Mar 15;185(2):280-281. doi: 10.1093/plphys/kiaa053. Plant Physiol. 2021. PMID: 33721906 Free PMC article. No abstract available.
Similar articles
-
G-quadruplex (G4) motifs in the maize (Zea mays L.) genome are enriched at specific locations in thousands of genes coupled to energy status, hypoxia, low sugar, and nutrient deprivation.J Genet Genomics. 2014 Dec 20;41(12):627-47. doi: 10.1016/j.jgg.2014.10.004. Epub 2014 Nov 4. J Genet Genomics. 2014. PMID: 25527104
-
Transcriptome analysis for identifying possible gene regulations during maize root emergence and formation at the initial growth stage.Genes Genomics. 2018 Jul;40(7):755-766. doi: 10.1007/s13258-018-0687-z. Epub 2018 Apr 7. Genes Genomics. 2018. PMID: 29934814
-
Comparative proteome analyses of phosphorus responses in maize (Zea mays L.) roots of wild-type and a low-P-tolerant mutant reveal root characteristics associated with phosphorus efficiency.Plant J. 2008 Sep;55(6):927-39. doi: 10.1111/j.1365-313X.2008.03561.x. Epub 2008 May 19. Plant J. 2008. PMID: 18489707
-
Multiple paths of sugar-sensing and a sugar/oxygen overlap for genes of sucrose and ethanol metabolism.J Exp Bot. 2000 Feb;51 Spec No:417-27. doi: 10.1093/jexbot/51.suppl_1.417. J Exp Bot. 2000. PMID: 10938850 Review.
-
Genetic Control of Root System Development in Maize.Trends Plant Sci. 2018 Jan;23(1):79-88. doi: 10.1016/j.tplants.2017.10.004. Epub 2017 Nov 20. Trends Plant Sci. 2018. PMID: 29170008 Review.
Cited by
-
Comprehensive genomic characterization of the soybean G3PDH gene family and its role in virus resistance.BMC Plant Biol. 2025 Sep 1;25(1):1171. doi: 10.1186/s12870-025-06579-7. BMC Plant Biol. 2025. PMID: 40890585 Free PMC article.
-
Plant Life with and without Oxygen: A Metabolomics Approach.Int J Mol Sci. 2023 Nov 12;24(22):16222. doi: 10.3390/ijms242216222. Int J Mol Sci. 2023. PMID: 38003412 Free PMC article. Review.
-
Averting a sweet demise: sugars change the transcriptional hypoxia response in maize roots.Plant Physiol. 2021 Mar 15;185(2):280-281. doi: 10.1093/plphys/kiaa053. Plant Physiol. 2021. PMID: 33721906 Free PMC article. No abstract available.
-
The Characterization of G-Quadruplexes in Tobacco Genome and Their Function under Abiotic Stress.Int J Mol Sci. 2024 Apr 14;25(8):4331. doi: 10.3390/ijms25084331. Int J Mol Sci. 2024. PMID: 38673916 Free PMC article.
-
Transcriptome and Metabolome Analysis of Low-Pressure Regulation in Saussurea involucrata Leaves.Genes (Basel). 2025 Mar 11;16(3):328. doi: 10.3390/genes16030328. Genes (Basel). 2025. PMID: 40149479 Free PMC article.
References
-
- Afgan E, Baker D, Batut Bvan den Beek M, Bouvier D, Čech M, Chilton J, Clements D, Coraor N, Grüning BA, Guerler A, Hillman-Jackson J, Hiltemann S, Jalili V, Rasche H, Soranzo N, Goecks J, Taylor J, Nekrutenko A, Blankenberg D (2018) The Galaxy platform for accessible, reproducible and collaborative biomedical analyses: 2018 update. Nucleic Acids Res 46: W537–W544 - PMC - PubMed
-
- Andorf CM, Kopylov M, Dobbs D, Koch KE, Stroupe ME, Lawrence CJ, Bass HW (2014) G-Quadruplex (G4) motifs in the maize (Zea mays L.) genome are enriched at specific locations in thousands of genes coupled to energy status, hypoxia, low sugar, and nutrient depravation. J Genet Genomics 41: 627–647 - PubMed
-
- Alonso AP, Val DL, Shachar-Hill Y (2011) Central metabolic fluxes in the endosperm of developing maize seeds and their implications for metabolic engineering. Metab Eng 13: 96–107 - PubMed
Publication types
MeSH terms
Substances
LinkOut - more resources
Full Text Sources
Research Materials
Miscellaneous
