

Differential effects of intense exercise and pollution on the airways in a murine model
- PMID: 33722268
- PMCID: PMC7962283
- DOI: 10.1186/s12989-021-00401-6
Differential effects of intense exercise and pollution on the airways in a murine model
Abstract
Background: Exercise-induced bronchoconstriction (EIB) is a transient airway narrowing, occurring during or shortly after intensive exercise. It is highly prevalent in non-asthmatic outdoor endurance athletes suggesting an important contribution of air pollution in the development of EIB. Therefore, more research is necessary to investigate the combination of exercise and pollutants on the airways.
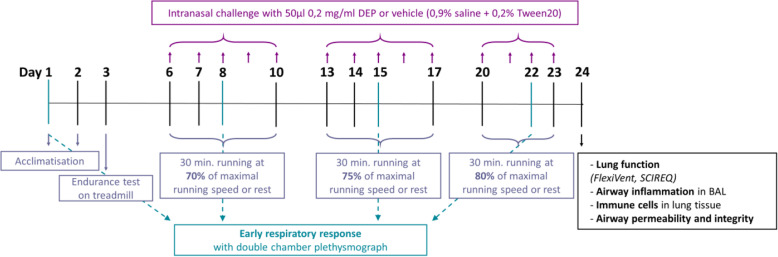
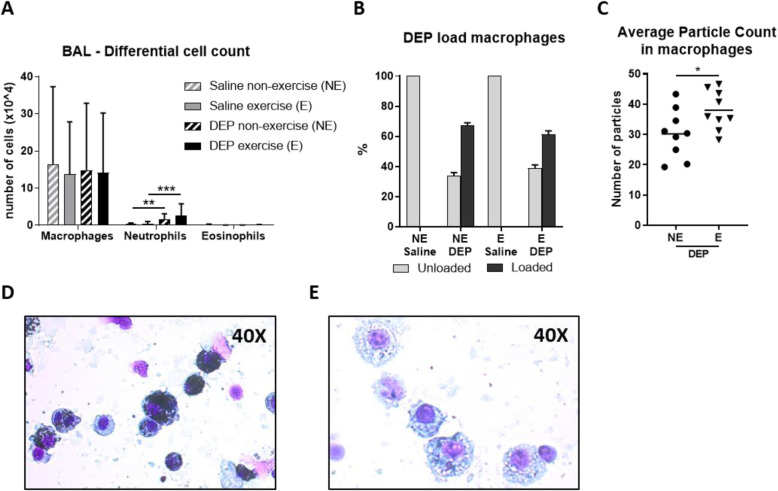
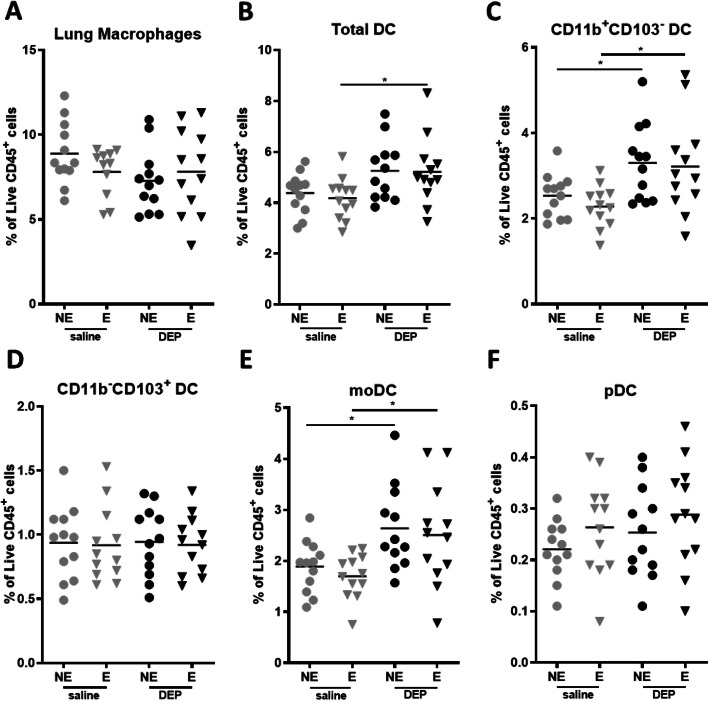
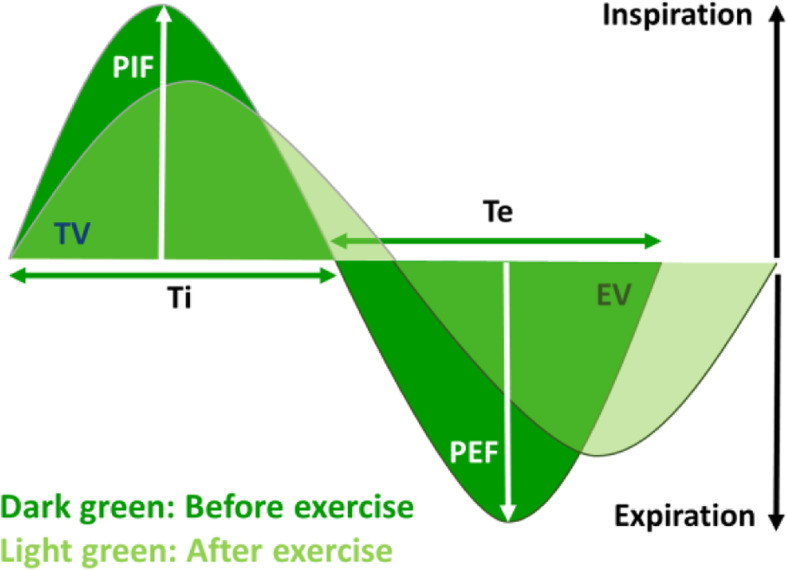
Methods: Balbc/ByJ mice were intranasally challenged 5 days a week for 3 weeks with saline or 0.2 mg/ml diesel exhaust particles (DEP), prior to a daily incremental running session or non-exercise session. Once a week, the early ventilatory response was measured and lung function was determined at day 24. Airway inflammation and cytokine levels were evaluated in bronchoalveolar lavage fluid. Furthermore, innate lymphoid cells, dendritic cells and tight junction mRNA expression were determined in lung tissue.
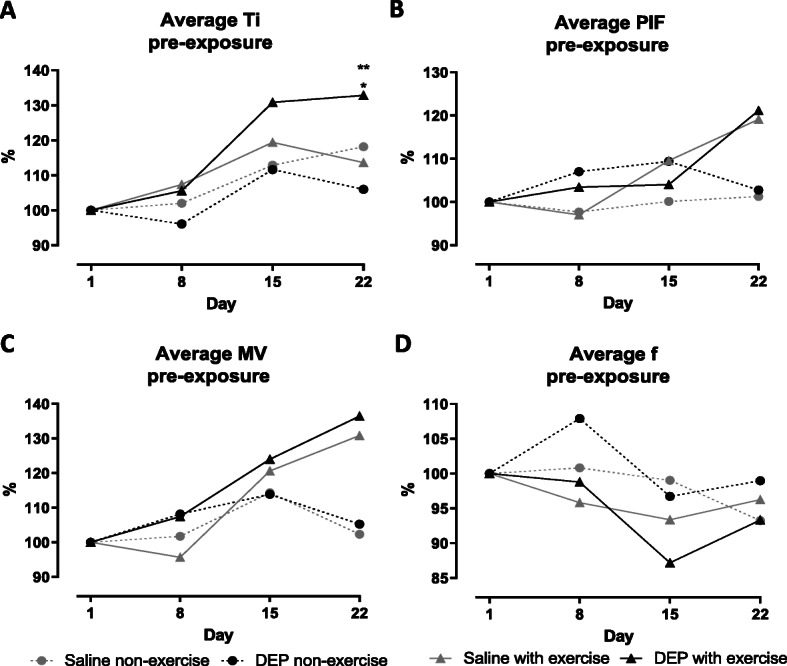
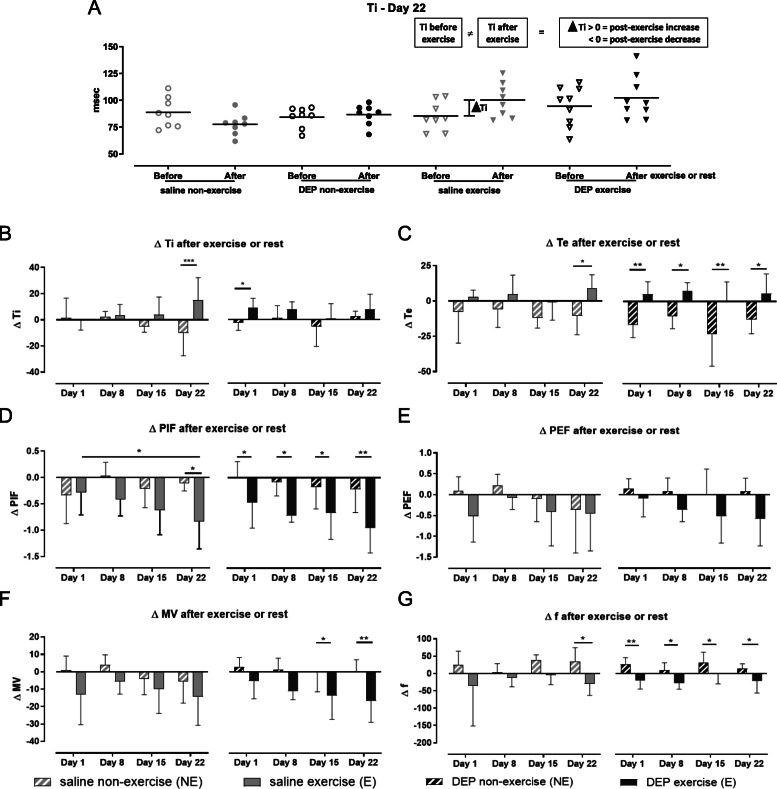
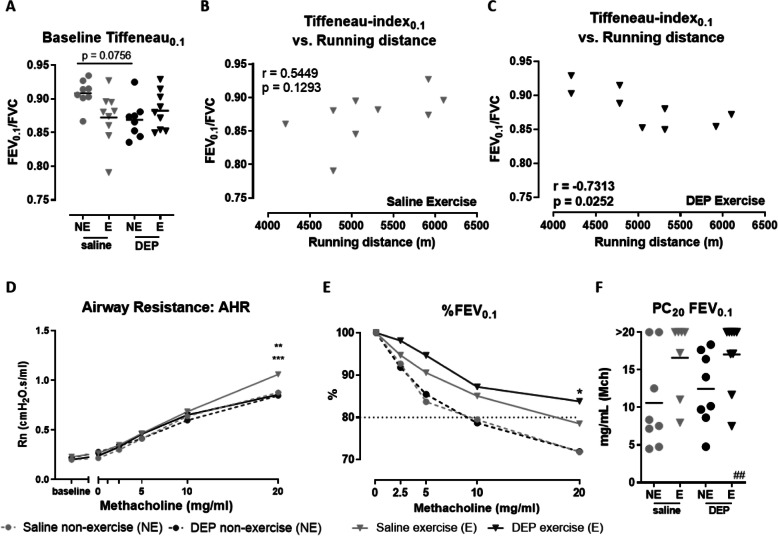
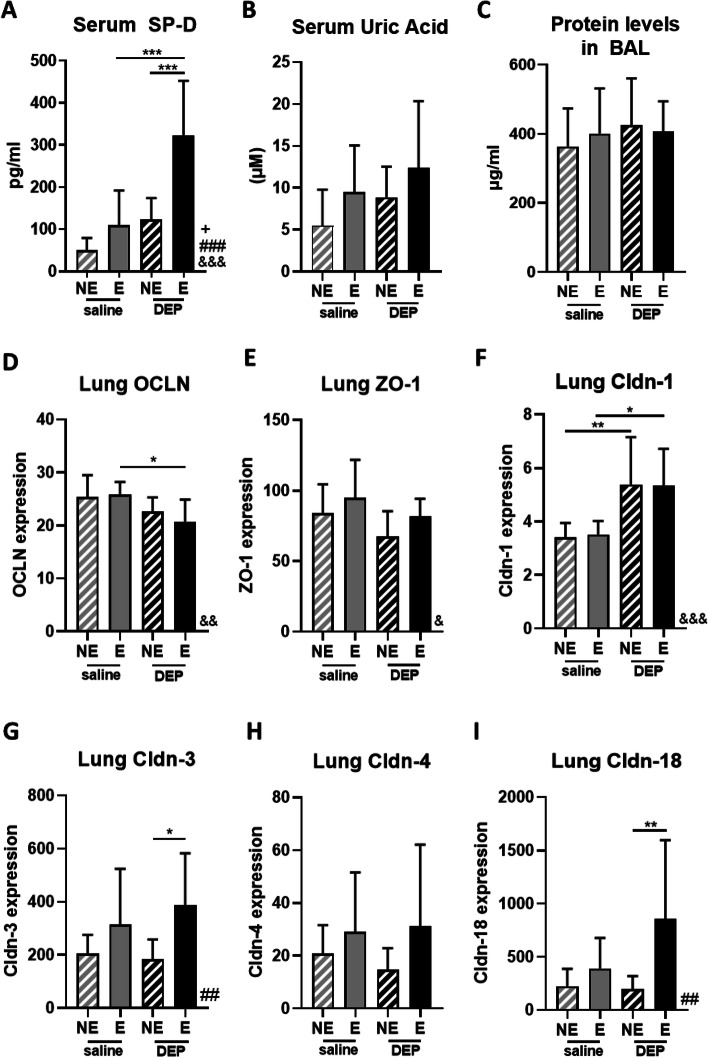
Results: Submaximal exercise resulted in acute alterations of the breathing pattern and significantly improved FEV0.1 at day 24. DEP exposure induced neutrophilic airway inflammation, accompanied with increased percentages of CD11b+ DC in lung tissue and pro-inflammatory cytokines, such as IL-13, MCP-1, GM-CSF and KC. Occludin and claudin-1(Cldn-1) expression were respectively increased and decreased by DEP exposure. Whereas, exercise increased Cldn-3 and Cldn-18 expression. Combining exercise and DEP exposure resulted in significantly increased SP-D levels in the airways.
Conclusion: DEP exposure induced typical airway neutrophilia, DC recruitment and pro-inflammatory cytokine production. Whereas, intensive exercise induced changes of the breathing pattern. The combination of both triggers resulted in a dysregulation of tight junction expression, suggesting that intensive exercise in polluted environments can induce important changes in the airway physiology and integrity.
Keywords: Dendritic cells; Diesel exhaust particles; Exercise-induced bronchoconstriction; Non-allergic; Tight junctions.
Conflict of interest statement
The authors declare that they have no competing interests.
Figures
Similar articles
-
Cold air and air pollution induce bronchial hyperresponsiveness and inflammation in a murine model.Sci Total Environ. 2025 Aug 10;989:179828. doi: 10.1016/j.scitotenv.2025.179828. Epub 2025 Jun 13. Sci Total Environ. 2025. PMID: 40516195
-
Health effects of acute exposure to air pollution. Part I: Healthy and asthmatic subjects exposed to diesel exhaust.Res Rep Health Eff Inst. 2003 Dec;(112):1-30; discussion 51-67. Res Rep Health Eff Inst. 2003. PMID: 14738208 Clinical Trial.
-
Vesicular acetylcholine transport deficiency potentiates some inflammatory responses induced by diesel exhaust particles.Ecotoxicol Environ Saf. 2019 Jan 15;167:494-504. doi: 10.1016/j.ecoenv.2018.10.005. Epub 2018 Oct 25. Ecotoxicol Environ Saf. 2019. PMID: 30368143
-
Diesel exhaust particles and airway inflammation.Curr Opin Pulm Med. 2012 Mar;18(2):144-50. doi: 10.1097/MCP.0b013e32834f0e2a. Curr Opin Pulm Med. 2012. PMID: 22234273 Review.
-
Diesel exhaust particles activate human bronchial epithelial cells to express inflammatory mediators in the airways: a review.Respirology. 2000 Jun;5(2):197-203. doi: 10.1046/j.1440-1843.2000.00245.x. Respirology. 2000. PMID: 10894110 Review.
Cited by
-
Physical activity and air pollution: context matters for cardiovascular health.Lancet Reg Health West Pac. 2025 Jun 23;60:101612. doi: 10.1016/j.lanwpc.2025.101612. eCollection 2025 Jul. Lancet Reg Health West Pac. 2025. PMID: 40636893 Free PMC article. No abstract available.
-
Combined Exercise and Diet Induce Airway Hyperreactivity While Reducing Liver Steatosis in Mice with Diet-Induced Obesity.Nutrients. 2024 Jul 3;16(13):2129. doi: 10.3390/nu16132129. Nutrients. 2024. PMID: 38999877 Free PMC article.
-
Exercise-Mediated Protection against Air Pollution-Induced Immune Damage: Mechanisms, Challenges, and Future Directions.Biology (Basel). 2024 Apr 8;13(4):247. doi: 10.3390/biology13040247. Biology (Basel). 2024. PMID: 38666859 Free PMC article. Review.
-
Bioinformatics analysis of G protein subunit gamma transduction protein 2-autophagy axis in CD11b+ dendritic cells as a potential regulator to skew airway neutrophilic inflammation in asthma endotypes.Immun Inflamm Dis. 2024 Oct;12(10):e70038. doi: 10.1002/iid3.70038. Immun Inflamm Dis. 2024. PMID: 39417697 Free PMC article.
-
Physical Activity in Polluted Air-Net Benefit or Harm to Cardiovascular Health? A Comprehensive Review.Antioxidants (Basel). 2021 Nov 8;10(11):1787. doi: 10.3390/antiox10111787. Antioxidants (Basel). 2021. PMID: 34829658 Free PMC article. Review.
References
Publication types
MeSH terms
Substances
LinkOut - more resources
Full Text Sources
Other Literature Sources
Research Materials
Miscellaneous
