. 2021 Mar 16:10:e64670.
doi: 10.7554/eLife.64670.

The global burden of yellow fever

Affiliations

The global burden of yellow fever

Katy Am Gaythorpe et al. Elife. .

Abstract

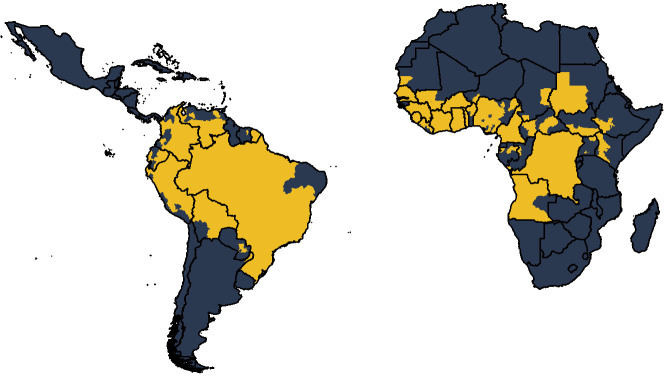
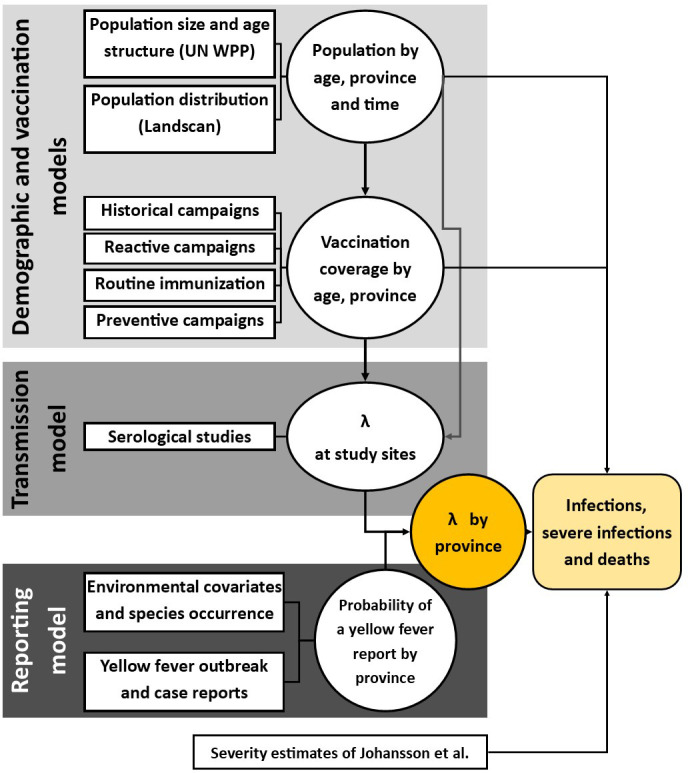
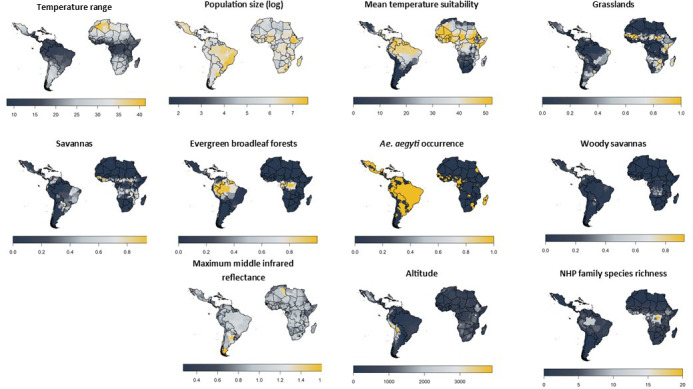
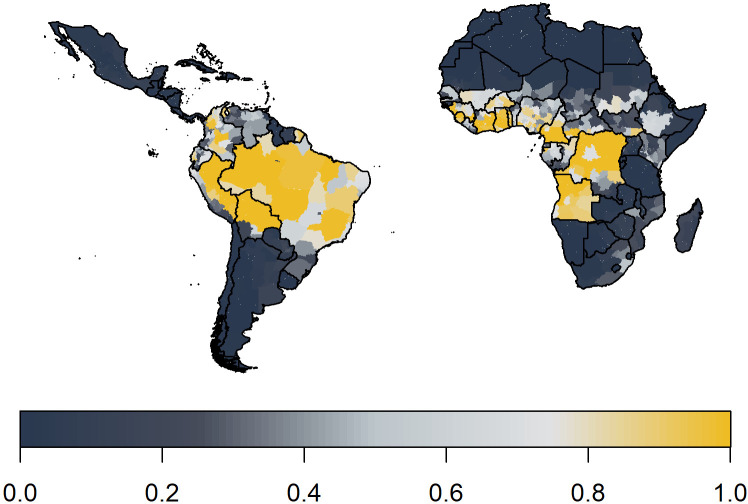
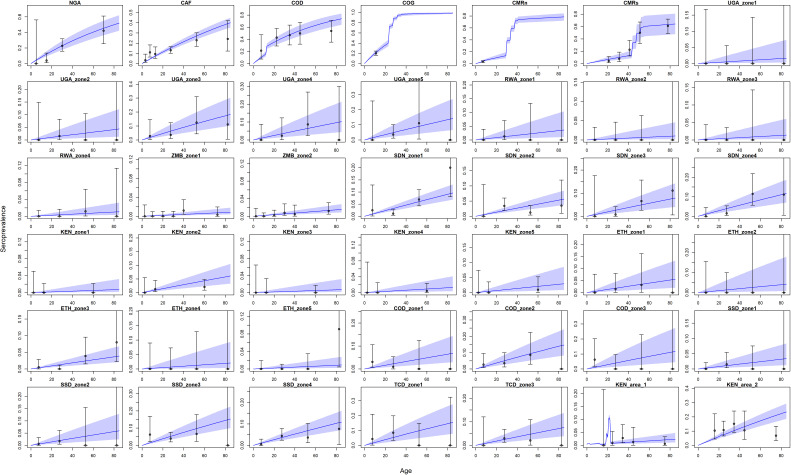
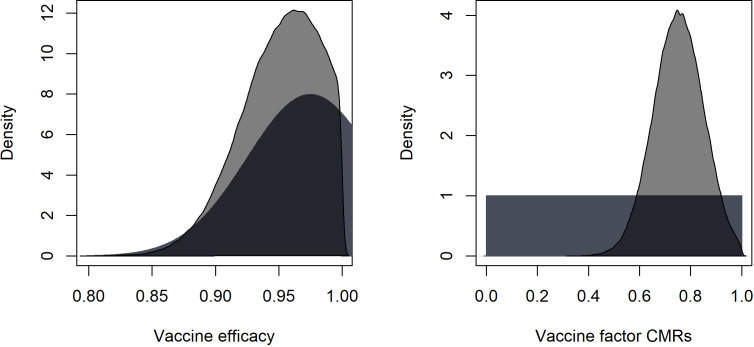
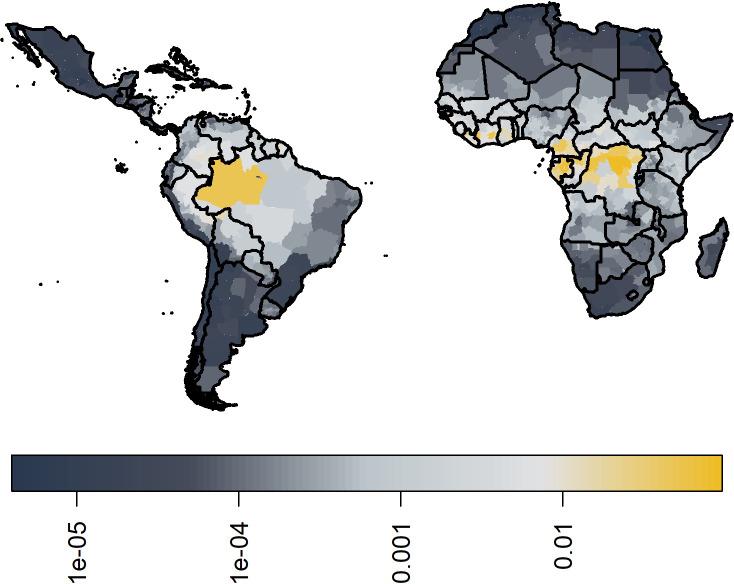
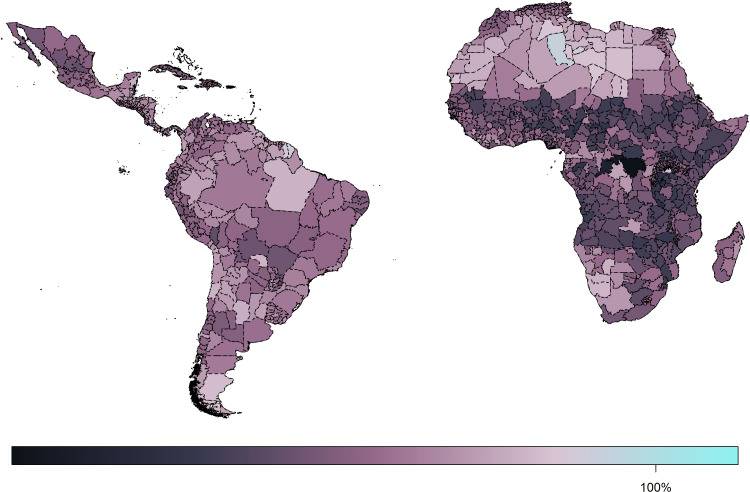
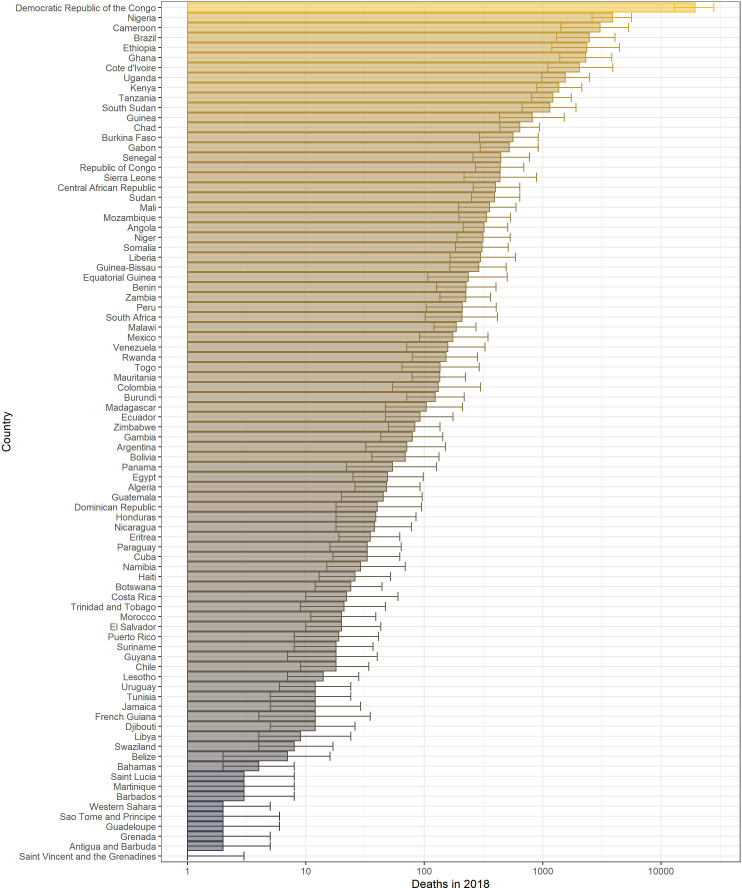
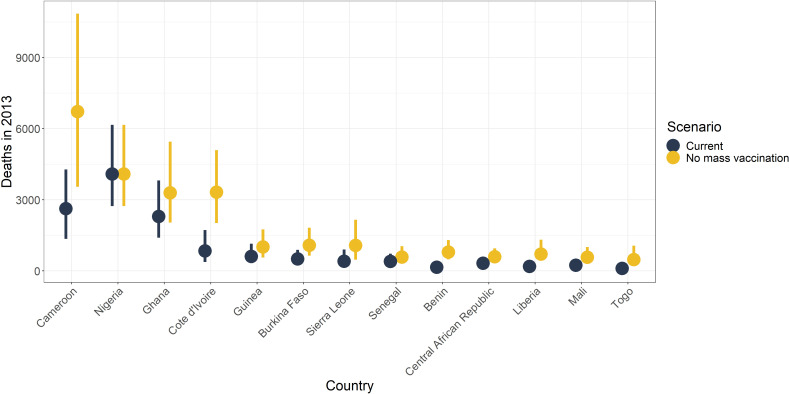
Yellow fever (YF) is a viral, vector-borne, haemorrhagic fever endemic in tropical regions of Africa and South America. The vaccine for YF is considered safe and effective, but intervention strategies need to be optimised; one of the tools for this is mathematical modelling. We refine and expand an existing modelling framework for Africa to account for transmission in South America. We fit to YF occurrence and serology data. We then estimate the subnational forces of infection for the entire endemic region. Finally, using demographic and vaccination data, we examine the impact of vaccination activities. We estimate that there were 109,000 (95% credible interval [CrI] [67,000-173,000]) severe infections and 51,000 (95% CrI [31,000-82,000]) deaths due to YF in Africa and South America in 2018. We find that mass vaccination activities in Africa reduced deaths by 47% (95% CrI [10%-77%]). This methodology allows us to evaluate the effectiveness of vaccination and illustrates the need for continued vigilance and surveillance of YF.

Keywords: epidemiology; global health; mathematical modelling; vaccine impact; vector-borne; virus; yellow fever.


Conflict of interest statement

KG, AH, KJ, DG, LC, TG, NF No competing interests declared

Figures

Figure 1.
Figure 1.. Global occurrence of yellow fever at province level.
Occurrence since 1984 is shown in yellow.
Figure 2.
Figure 2.. Diagram of models and data sources where λ denotes the force of infection.
Circles denote a product of calculation or inference; square boxes denote data sources. Adapted from Gaythorpe et al., 2019.
Figure 3.
Figure 3.. Included model covariates.
Species richness is the sum of all NHP species present per province from families listed in Table 1 and will vary as families are included/excluded. See Figure 3—figure supplement 1–4 for trace plots of all parameters.
Figure 3—figure supplement 1.
Figure 3—figure supplement 1.. Trace plots from estimation of model variant 17 as an example of convergence.
Figure 3—figure supplement 2.
Figure 3—figure supplement 2.. Trace plots from estimation of model variant 17 as an example of convergence.
Figure 3—figure supplement 3.
Figure 3—figure supplement 3.. Trace plots from estimation of model variant 17 as an example of convergence.
Figure 3—figure supplement 4.
Figure 3—figure supplement 4.. Trace plots from estimation of model variant 17 as an example of convergence.
Figure 4.
Figure 4.. Posterior predicted area under the curve (AUC) for all model variants.
The AUC are calculated for 500 samples from the posterior of each model variant.
Figure 5.
Figure 5.. Median posterior predicted probability of a yellow fever report from ensemble predictions of the 20 best GLMs.
This applies over the observation period 1984–2019.
Figure 6.
Figure 6.. Seroprevalence predictions for each serological survey.
Central blue line indicates median posterior predicted seroprevalence; blue area indicates 95% CrI. Dots indicate the data with error bar representing binomial confidence intervals. Countries are named by their ISO code with different ecological zones indexed ‘zone x’. See Figure 6—figure supplement 1 for posterior distribution of vaccine efficacy and vaccine factor for CMRs; see Figure 6—figure supplement 2 for comparison of force of infection estimates under different prior distributions.
Figure 6—figure supplement 1.
Figure 6—figure supplement 1.. Prior and posterior distributions for vaccine efficacy and vaccine factor for CMRs.
Figure 6—figure supplement 2.
Figure 6—figure supplement 2.. Comparison of force of infection estimates for the serological study sites using two prior formulations.
The first, used throughout the manuscript, is exponential with rate = 0.001. The comparitor is exponential with rate = 0.1.
Figure 7.
Figure 7.. Median posterior predicted force of infection from ensemble predictions of the 20 best GLMs.
Force of infections are assumed to be time invariant as such, these do not correspond to a particular year. See Figure 6—figure supplement 1 for coefficient of variation.
Figure 7—figure supplement 1.
Figure 7—figure supplement 1.. Coefficient of variation in the force of infection estimates between 100 samples of each of the 20 best models.
Figure 8.
Figure 8.. Posterior predicted potential deaths per country in 2018 from the ensemble model projections.
Figure 9.
Figure 9.. Median posterior predicted deaths averted for 2018 by country.
Yellow represents the number of deaths without mass vaccination campaigns since 2006, and black represents deaths with current vaccination coverage levels. The points denote median and the line shows the 95% credible interval. See Figure 9—figure supplement 1 for results in 2013.
Figure 9—figure supplement 1.
Figure 9—figure supplement 1.. Median posterior predicted deaths averted for 2013 by country.
Yellow represents the number of deaths without mass vaccination campaigns since 2006, and black represents deaths with current vaccination coverage levels. The mid line denotes median, and the box range shows the 95% credible interval.

References

    1. Barrett ADT. Yellow fever vaccine: the conundrum of 2 doses, one dose, or One-Fifth dose to induce and maintain protective immunity. The Journal of Infectious Diseases. 2020;221:1922–1924. doi: 10.1093/infdis/jiz379. - DOI - PubMed
    1. Brady OJ, Golding N, Pigott DM, Kraemer MU, Messina JP, Reiner RC, Scott TW, Smith DL, Gething PW, Hay SI. Global temperature constraints on aedes aegypti and ae. albopictus persistence and competence for dengue virus transmission. Parasites & Vectors. 2014;7:338. doi: 10.1186/1756-3305-7-338. - DOI - PMC - PubMed
    1. Câmara FP, Gomes ALBB, Carvalho L, Castello LGV. Dynamic behavior of sylvatic yellow fever in Brazil (1954-2008) Revista Da Sociedade Brasileira De Medicina Tropical. 2011;44:297–299. doi: 10.1590/S0037-86822011005000024. - DOI - PubMed
    1. Chen LH, Kozarsky PE, Visser LG. What’s Old Is New Again: The Re-emergence of Yellow Fever in Brazil and Vaccine Shortages. Clinical Infectious Diseases. 2019;68:1761–1762. doi: 10.1093/cid/ciy777. - DOI - PubMed
    1. Chepkorir E, Tchouassi DP, Konongoi SL, Lutomiah J, Tigoi C, Irura Z, Eyase F, Venter M, Sang R. Serological evidence of Flavivirus circulation in human populations in northern Kenya: an assessment of disease risk 2016-2017. Virology Journal. 2019;16:65. doi: 10.1186/s12985-019-1176-y. - DOI - PMC - PubMed

Publication types

Substances