Clinical Trial
. 2021 Jul;161(1):66-80.e8.
doi: 10.1053/j.gastro.2021.03.014. Epub 2021 Mar 17.

TAK-101 Nanoparticles Induce Gluten-Specific Tolerance in Celiac Disease: A Randomized, Double-Blind, Placebo-Controlled Study

Collaborators, Affiliations
Clinical Trial

TAK-101 Nanoparticles Induce Gluten-Specific Tolerance in Celiac Disease: A Randomized, Double-Blind, Placebo-Controlled Study

Ciarán P Kelly et al. Gastroenterology. 2021 Jul.

Abstract

Background & aims: In celiac disease (CeD), gluten induces immune activation, leading to enteropathy. TAK-101, gluten protein (gliadin) encapsulated in negatively charged poly(dl-lactide-co-glycolic acid) nanoparticles, is designed to induce gluten-specific tolerance.

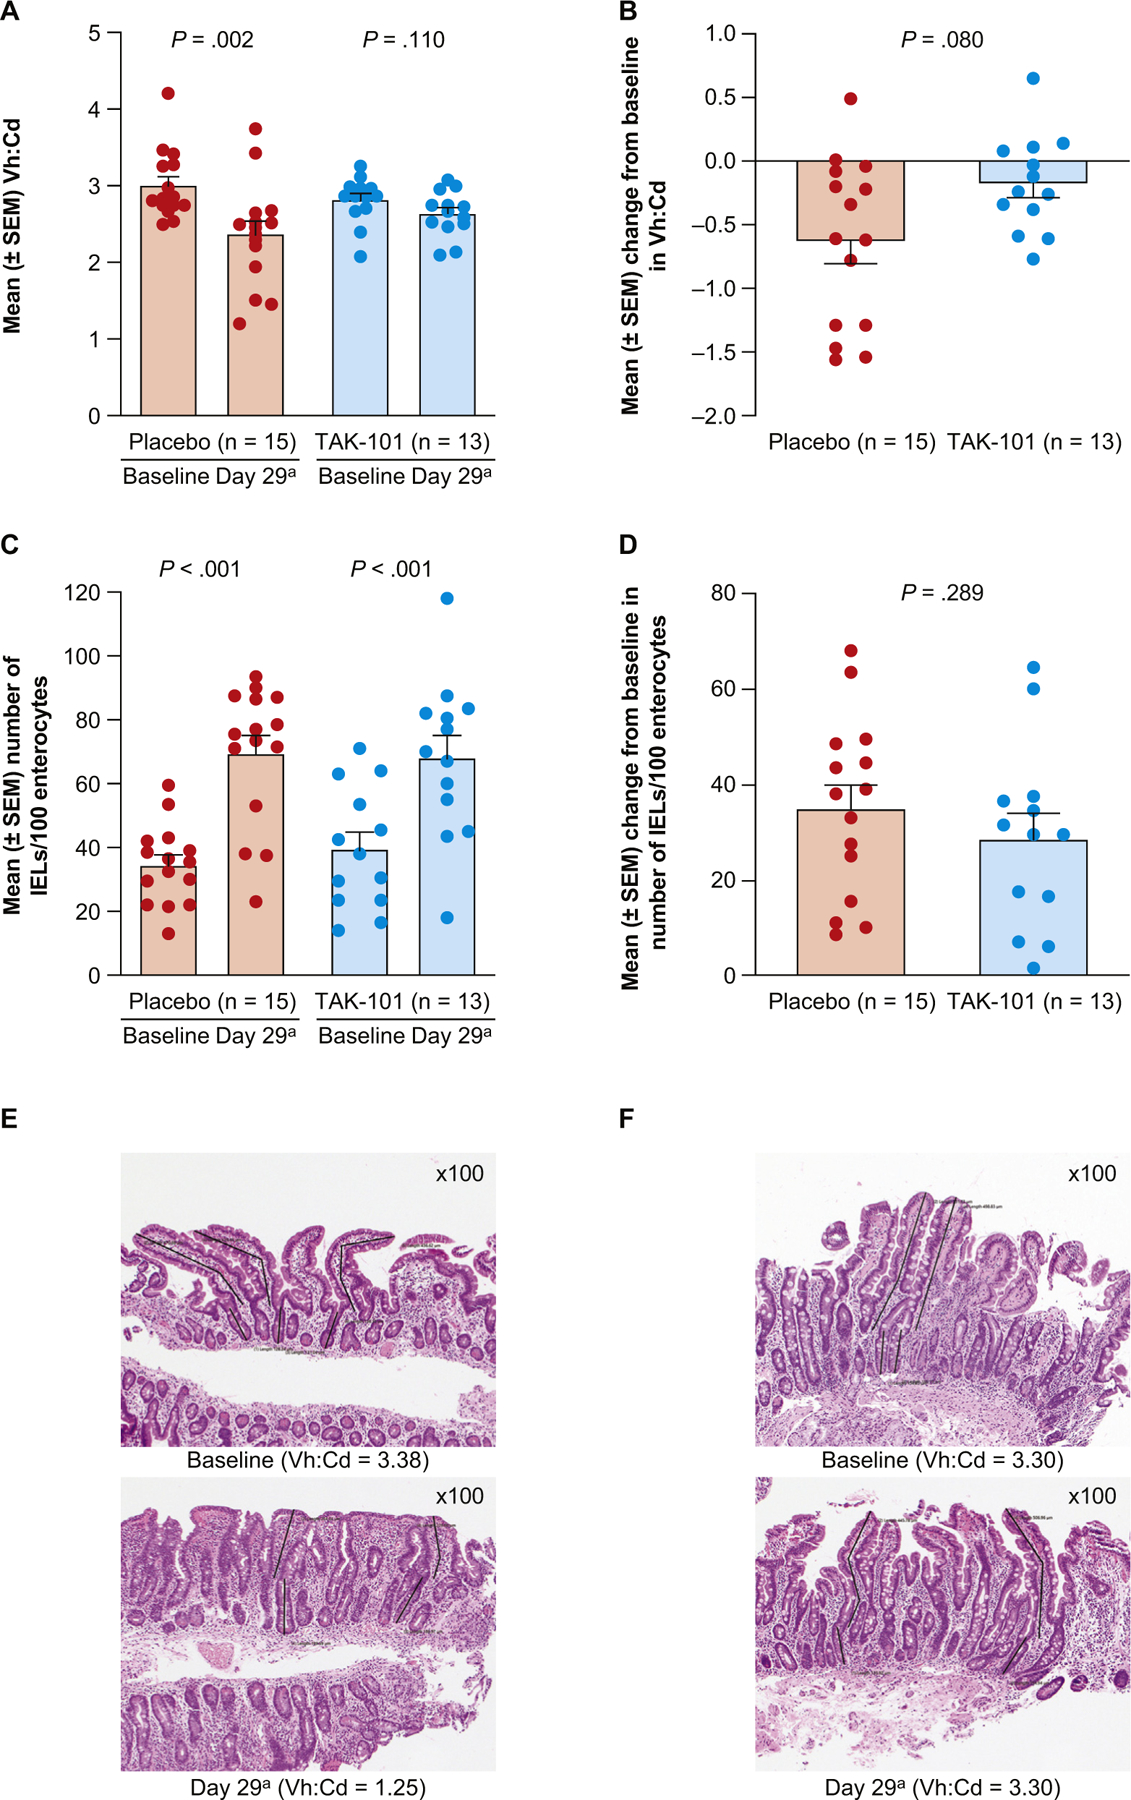
Methods: TAK-101 was evaluated in phase 1 dose escalation safety and phase 2a double-blind, randomized, placebo-controlled studies. Primary endpoints included pharmacokinetics, safety, and tolerability of TAK-101 (phase 1) and change from baseline in circulating gliadin-specific interferon-γ-producing cells at day 6 of gluten challenge, in patients with CeD (phase 2a). Secondary endpoints in the phase 2a study included changes from baseline in enteropathy (villus height to crypt depth ratio [Vh:Cd]), and frequency of intestinal intraepithelial lymphocytes and peripheral gut-homing T cells.

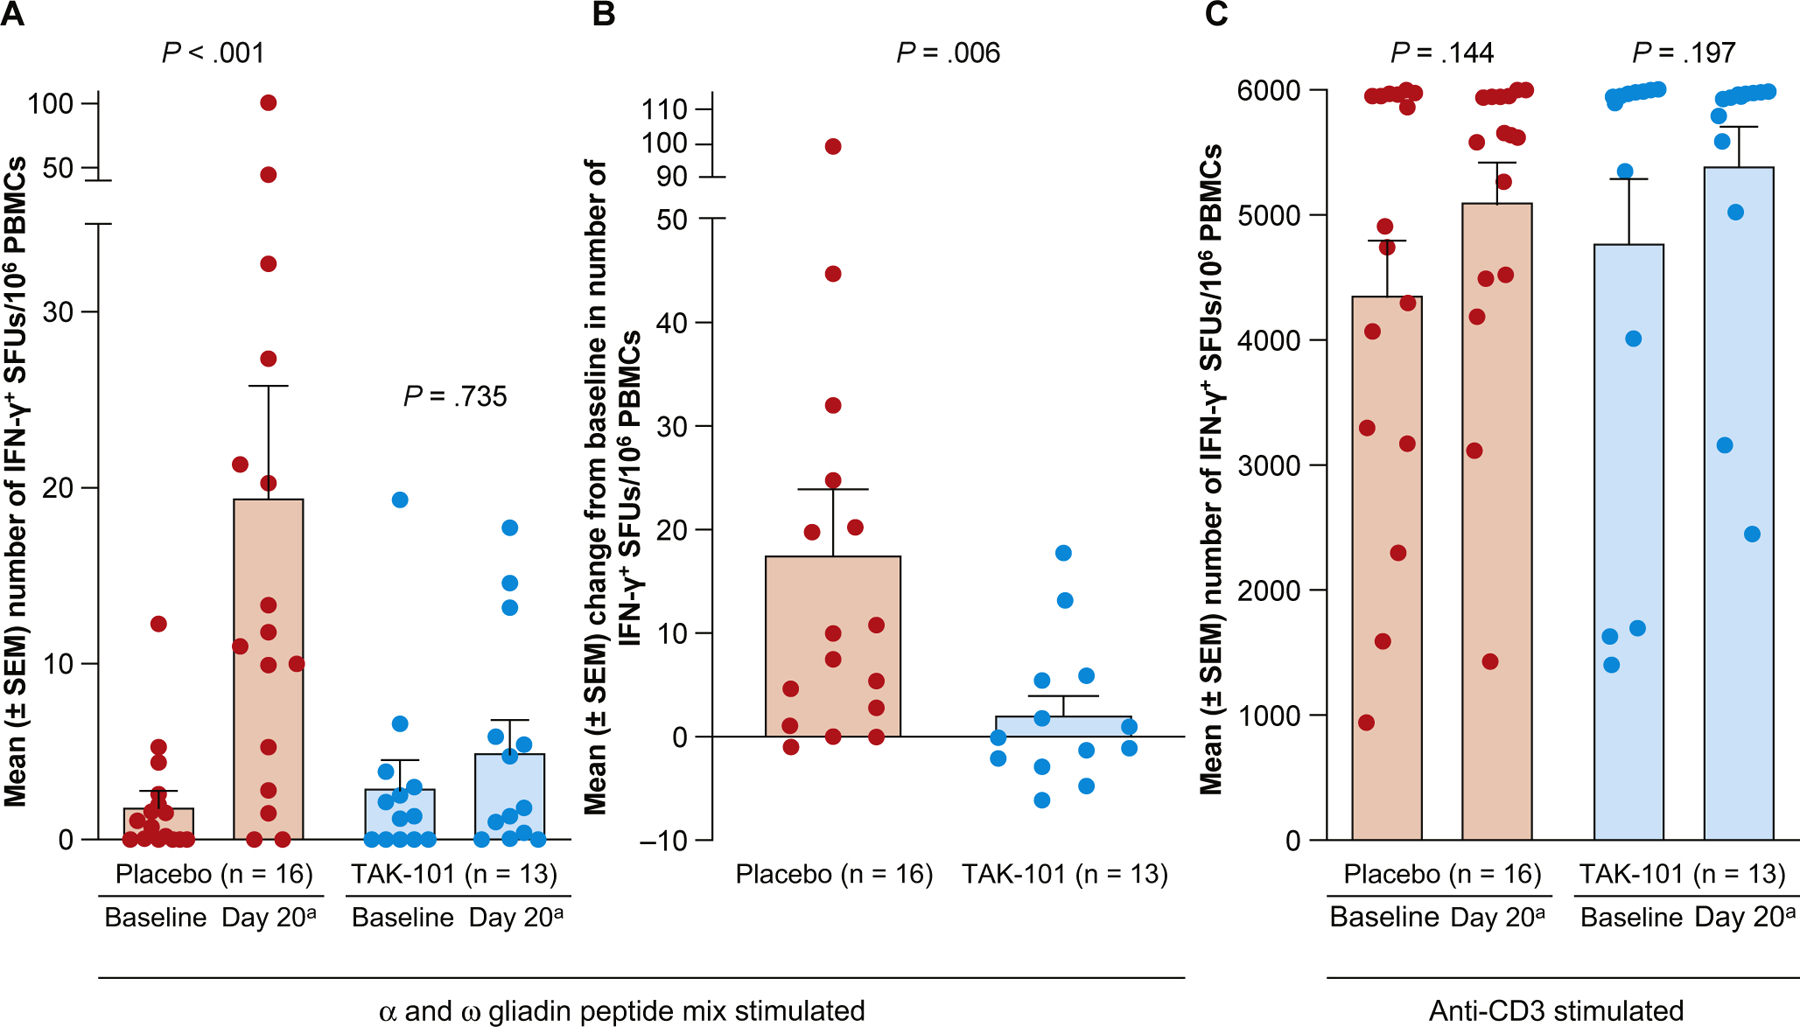
Results: In phase 2a, 33 randomized patients completed the 14-day gluten challenge. TAK-101 induced an 88% reduction in change from baseline in interferon-γ spot-forming units vs placebo (2.01 vs 17.58, P = .006). Vh:Cd deteriorated in the placebo group (-0.63, P = .002), but not in the TAK-101 group (-0.18, P = .110), although the intergroup change from baseline was not significant (P = .08). Intraepithelial lymphocyte numbers remained equal. TAK-101 reduced changes in circulating α4β7+CD4+ (0.26 vs 1.05, P = .032), αEβ7+CD8+ (0.69 vs 3.64, P = .003), and γδ (0.15 vs 1.59, P = .010) effector memory T cells. TAK-101 (up to 8 mg/kg) induced no clinically meaningful changes in vital signs or routine clinical laboratory evaluations. No serious adverse events occurred.

Conclusions: TAK-101 was well tolerated and prevented gluten-induced immune activation in CeD. The findings from the present clinical trial suggest that antigen-specific tolerance was induced and represent a novel approach translatable to other immune-mediated diseases. ClinicalTrials.gov identifiers: NCT03486990 and NCT03738475.

Keywords: Antigen-specific Immune Tolerance; Gliadin.


Figures

Figure 1.
Figure 1.
Phase 1 and phase 2a study designs. (A) Phase 1 safety study (n = 23): Part A (single ascending intravenous doses of TAK-101, n = 17) followed by Part B (2 ascending intravenous doses administered on days 1 and 8, n = 6) assessed the safety, tolerability, and pharmacokinetics of TAK-101 and established the dose to be used in the phase 2a study. (B) Phase 2a proof-of-concept study (n = 34) in patients infused with placebo or TAK-101, 8 mg/kg, on days 1 and 8. All patients underwent a 14-day oral GC beginning on day 15 consisting of 12 g/d for the first 3 days and 6 g/d for the following 11 days. BL, baseline; GC, gluten challenge. aDay 29 was equivalent to 1 day after the 14-day gluten challenge.
Figure 2.
Figure 2.
TAK-101 reduces gluten-specific activated T cells in peripheral blood in response to oral gluten challenge. (A) Number of IFN-γ+ SFUs after ex vivo stimulation of PBMCs with an HLA-DQ2-restricted deamidated α- and ω-gliadin peptide mix. (B) Change from baseline in the number of IFN-γ+ SFUs after ex vivo stimulation of PBMCs with a gliadin peptide mix. (C) Number of IFN-γ+ SFUs after ex vivo stimulation of PBMCs with anti-CD3. Induction of IFN-γ+ T cells in the peripheral blood of patients receiving placebo or TAK-101 after oral gluten challenge was examined by ELISpot assay. Patients received placebo (n = 16) or TAK-101 (n = 13) at days 1 and 8, followed by a 14-day oral gluten challenge beginning on day 15. Values for individual patients are shown as circles, and bars represent mean ± SEM. P values for (A) and (C) were calculated using the Wilcoxon signed rank test for the mean change from baseline within each treatment group. The P values for (B) were calculated using the Wilcoxon rank sum test for the mean change from baseline between treatment groups. aDay 20 was equivalent to day 6 of gluten challenge.
Figure 3.
Figure 3.
TAK-101 pre-treatment is associated with reduced gluten challenge–induced Vh:Cd deterioration. (A) Vh:Cd. (B) Change from baseline in Vh:Cd at day 29. (C) Number of IELs/100 enterocytes. (D) Change from baseline in number of IELs/100 enterocytes at day 29. (E) Representative baseline and post gluten challenge biopsies from a single patient treated with placebo, showing partial villous atrophy on day 29 compared with baseline or (F) treated with TAK-101, showing normal villous architecture without villous atrophy on day 29. Values for individual patients are shown as circles, and bars represent mean ± SEM. The P values for (A) and (C) were calculated using the Wilcoxon signed rank test for the mean change from baseline within each treatment group. The P values for (B) and (D) were calculated using the Wilcoxon rank sum test for the mean change from baseline between treatment groups (F). aDay 29 was equivalent to 1 day after the 14-day gluten challenge.
Figure 4.
Figure 4.
TAK-101 prevents the induction of activated T cells bearing gut-homing/retention integrins in response to oral gluten challenge. Percentage of activated (A) CD4+CD38+α4β7+ T cells, (B) CD8+CD38+αEβ7+ T cells, and (C) γδ+CD38+αEβ7+ T cells. Change from baseline in percentage of activated (D) CD4+CD38+α4β7+ T cells, (E) CD8+CD38+αEβ7+ T cells, and (F) γδ+CD38+αEβ7+ T cells. Percentages of activated CD4+, CD8+, and γδ+ T cells bearing gut-homing/retention integrins (α4β7 or αEβ7) in the peripheral blood of patients administered placebo or TAK-101, after 6 days of gluten challenge, were determined by CyTOF. Values for individual patients are shown as circles, and bars represent mean ± SEM. The P values for (AC) were calculated using the Wilcoxon signed rank test for the mean change from baseline within each treatment group. The P values for (DF) were calculated using the Wilcoxon rank sum test for the mean change from baseline between treatment groups. aDay 20 was equivalent to day 6 of gluten challenge.
Figure 5.
Figure 5.
Fold-change from baseline in number of immune cell types in peripheral blood in individual patients treated with TAK-101 (n = 13) or placebo (n = 16) post gluten challenge, determined via CyTOF analysis. CM, central memory (T cells); CSMB, class-switched memory B cells; EM, effector memory (T cells); mDC, myeloid dendritic cells; NCSMB, non–class-switched memory B cells; NK, natural killer cells; NKT, natural killer T cells; pDC, plasmacytoid dendritic cells; TCR, T-cell receptor; TEMRA, terminally differentiated effector memory cells reexpressing CD45RA.
Figure 6.
Figure 6.
Proposed mechanism of action of TAK-101 based on preclinical animal model and clinical studies. (A) Intravenously administered gliadin-encapsulating PLGA nanoparticles are taken up by tolerogenic APCs in the liver and splenic marginal zone expressing the MARCO scavenger receptor. (B) PLGA particle uptake by APCs induces the upregulation of PD-L1, the release of TGF-β and IL-10, and the processing and presentation of gliadin T-cell epitopes to gliadin epitope-specific T cells. (C) Tolerance is induced and maintained by multiple mechanisms, including T-cell anergy, and the activation of both induced FOXP3+ Tregs (iT-regs) and IL10-producing Tr1 cells. (D) Effective tolerance induction results in the inhibition of activation of and trafficking of gliadin-specific IFN-γ–producing T helper 1 effector cells to the small bowel, protecting the gut from immune-mediated damage. FOXP3, forkhead box P3; IL, interleukin; MHC, major histocompatibility complex; PD-1, programmed cell death protein 1; PD-L1, programmed death-ligand 1; PLGA, poly(dl-lactide-co-glycolic acid); TCR, T-cell receptor; TGF, transforming growth factor; Tr1, type 1 regulatory T cell.

References

    1. Green PH, Lebwohl B, Greywoode R. Celiac disease. J Allergy Clin Immunol 2015;135:1099–1106. - PubMed
    1. Singh P, Arora A, Strand TA, et al. Global prevalence of celiac disease: systematic review and meta-analysis. Clin Gastroenterol Hepatol 2018;16:823–836.e2. - PubMed
    1. Malamut G, El Machhour R, Montcuquet N, et al. IL-15 triggers an antiapoptotic pathway in human intraepithelial lymphocytes that is a potential new target in celiac disease-associated inflammation and lymphoma-genesis. J Clin Invest 2010;120:2131–2143. - PMC - PubMed
    1. Mazzarella G, Stefanile R, Camarca A, et al. Gliadin activates HLA class I-restricted CD8+ T cells in celiac disease intestinal mucosa and induces the enterocyte apoptosis. Gastroenterology 2008;134:1017–1027. - PMC - PubMed
    1. Han A, Newell EW, Glanville J, et al. Dietary gluten triggers concomitant activation of CD4+ and CD8+ αβ T cells and γδ T cells in celiac disease. Proc Natl Acad Sci U S A 2013;110:13073–13078. - PMC - PubMed

Publication types

MeSH terms

Associated data