. 2021 Jun:147:115913.
doi: 10.1016/j.bone.2021.115913. Epub 2021 Mar 16.

PPARG in osteocytes controls sclerostin expression, bone mass, marrow adiposity and mediates TZD-induced bone loss

Affiliations

PPARG in osteocytes controls sclerostin expression, bone mass, marrow adiposity and mediates TZD-induced bone loss

Sudipta Baroi et al. Bone. 2021 Jun.

Abstract

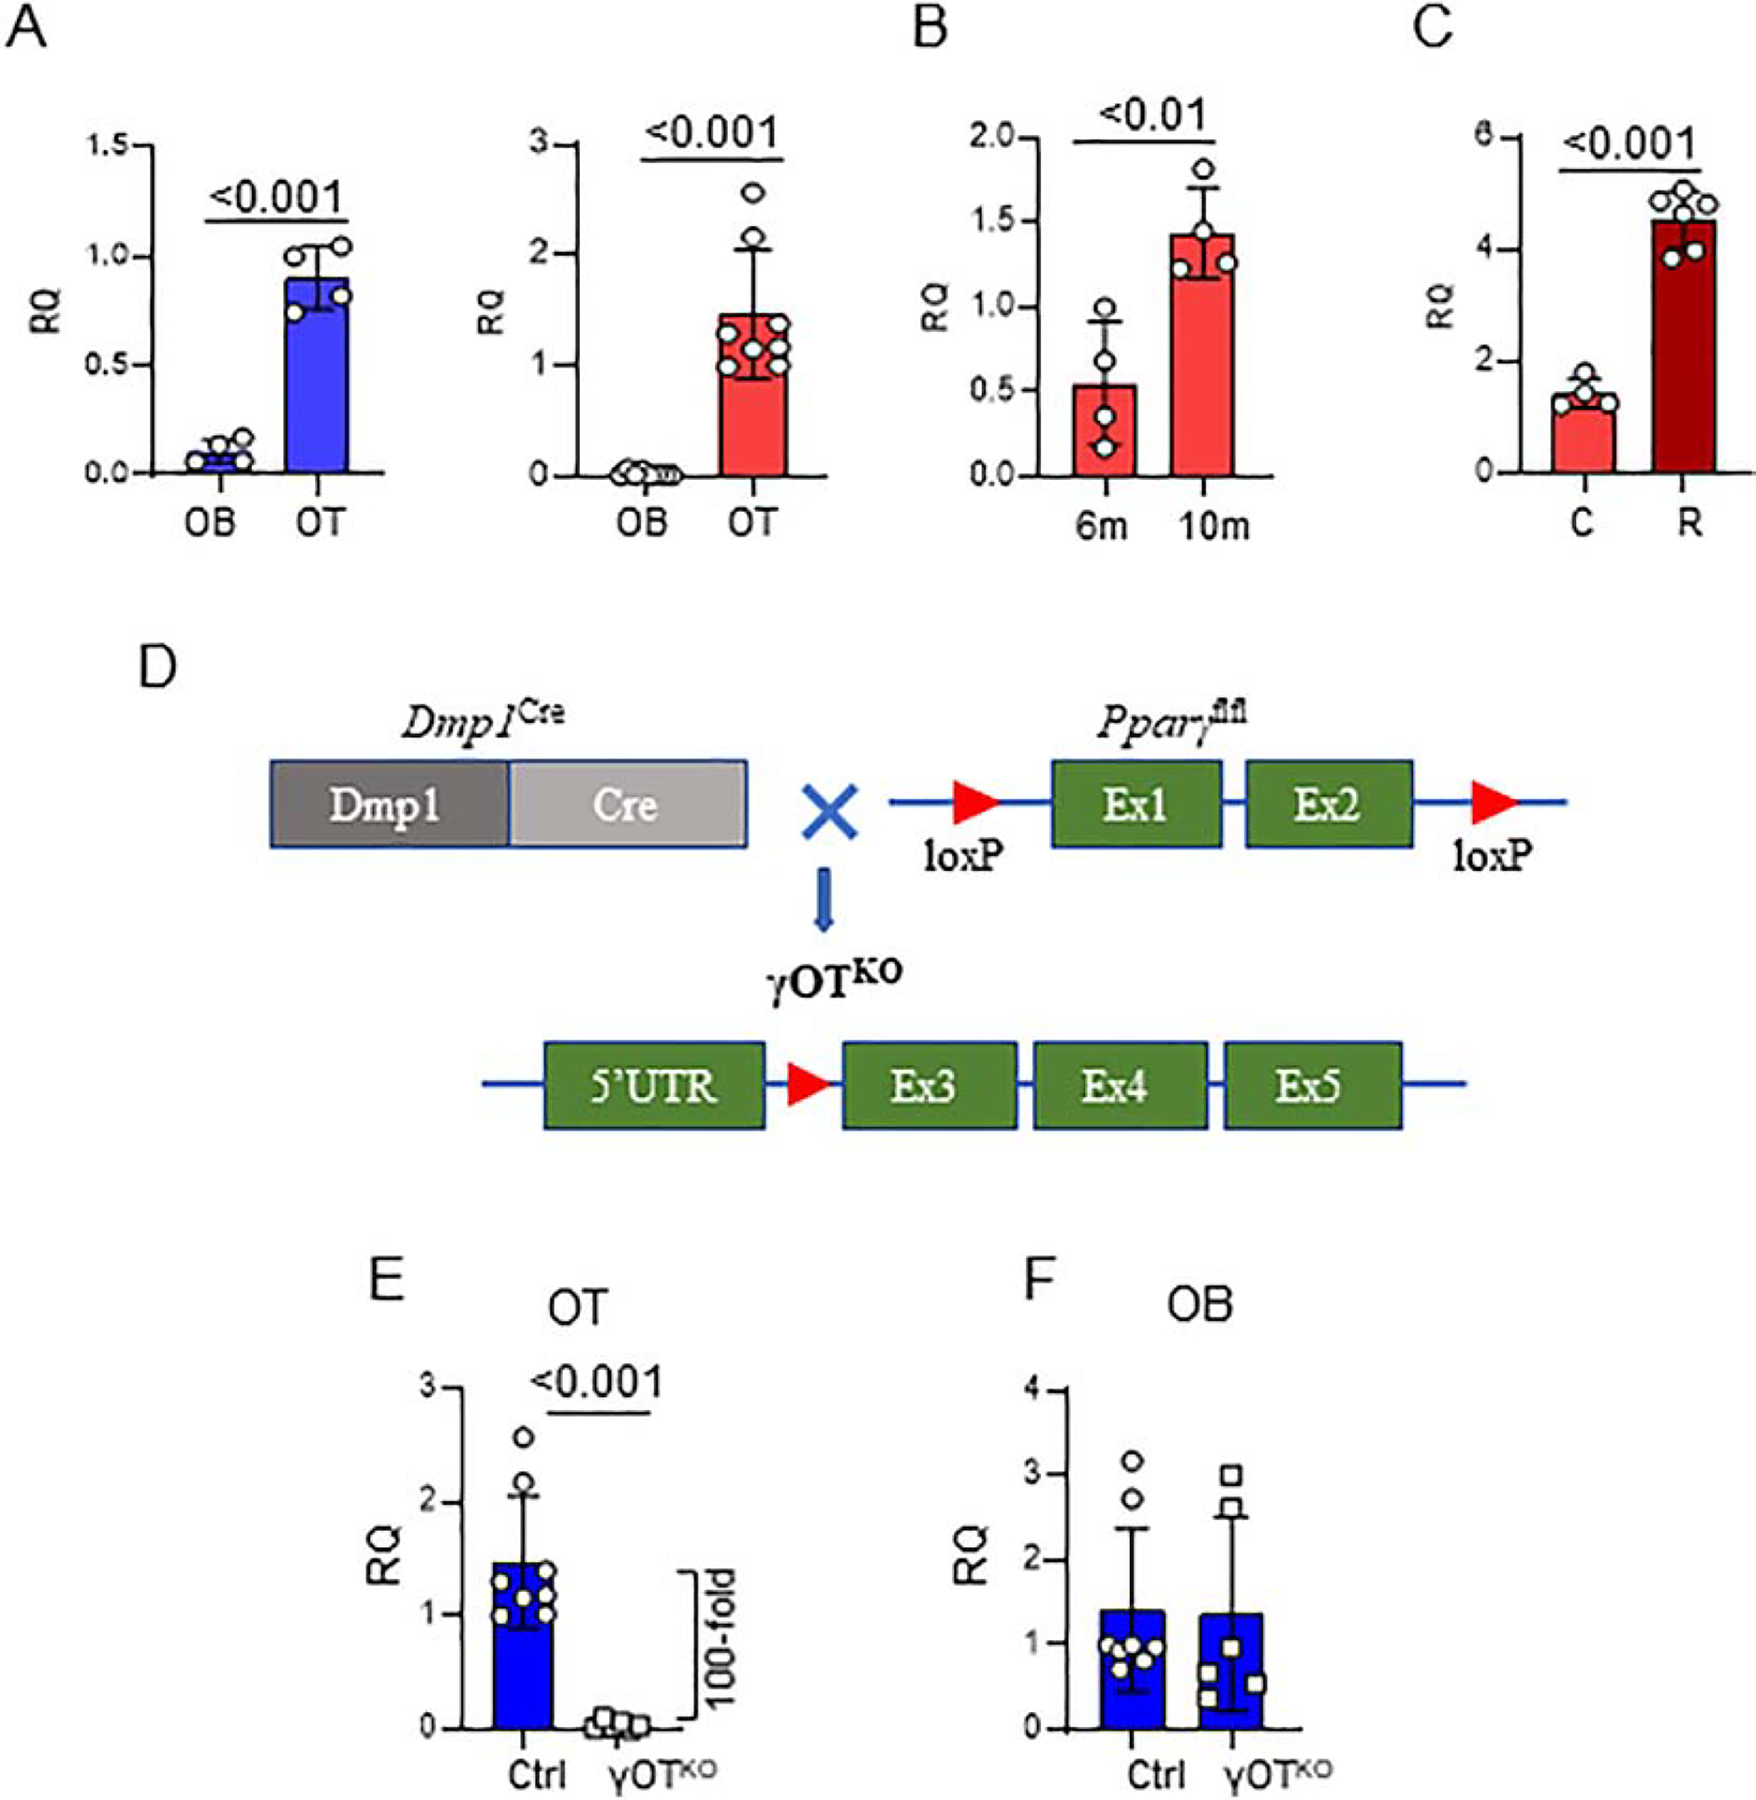
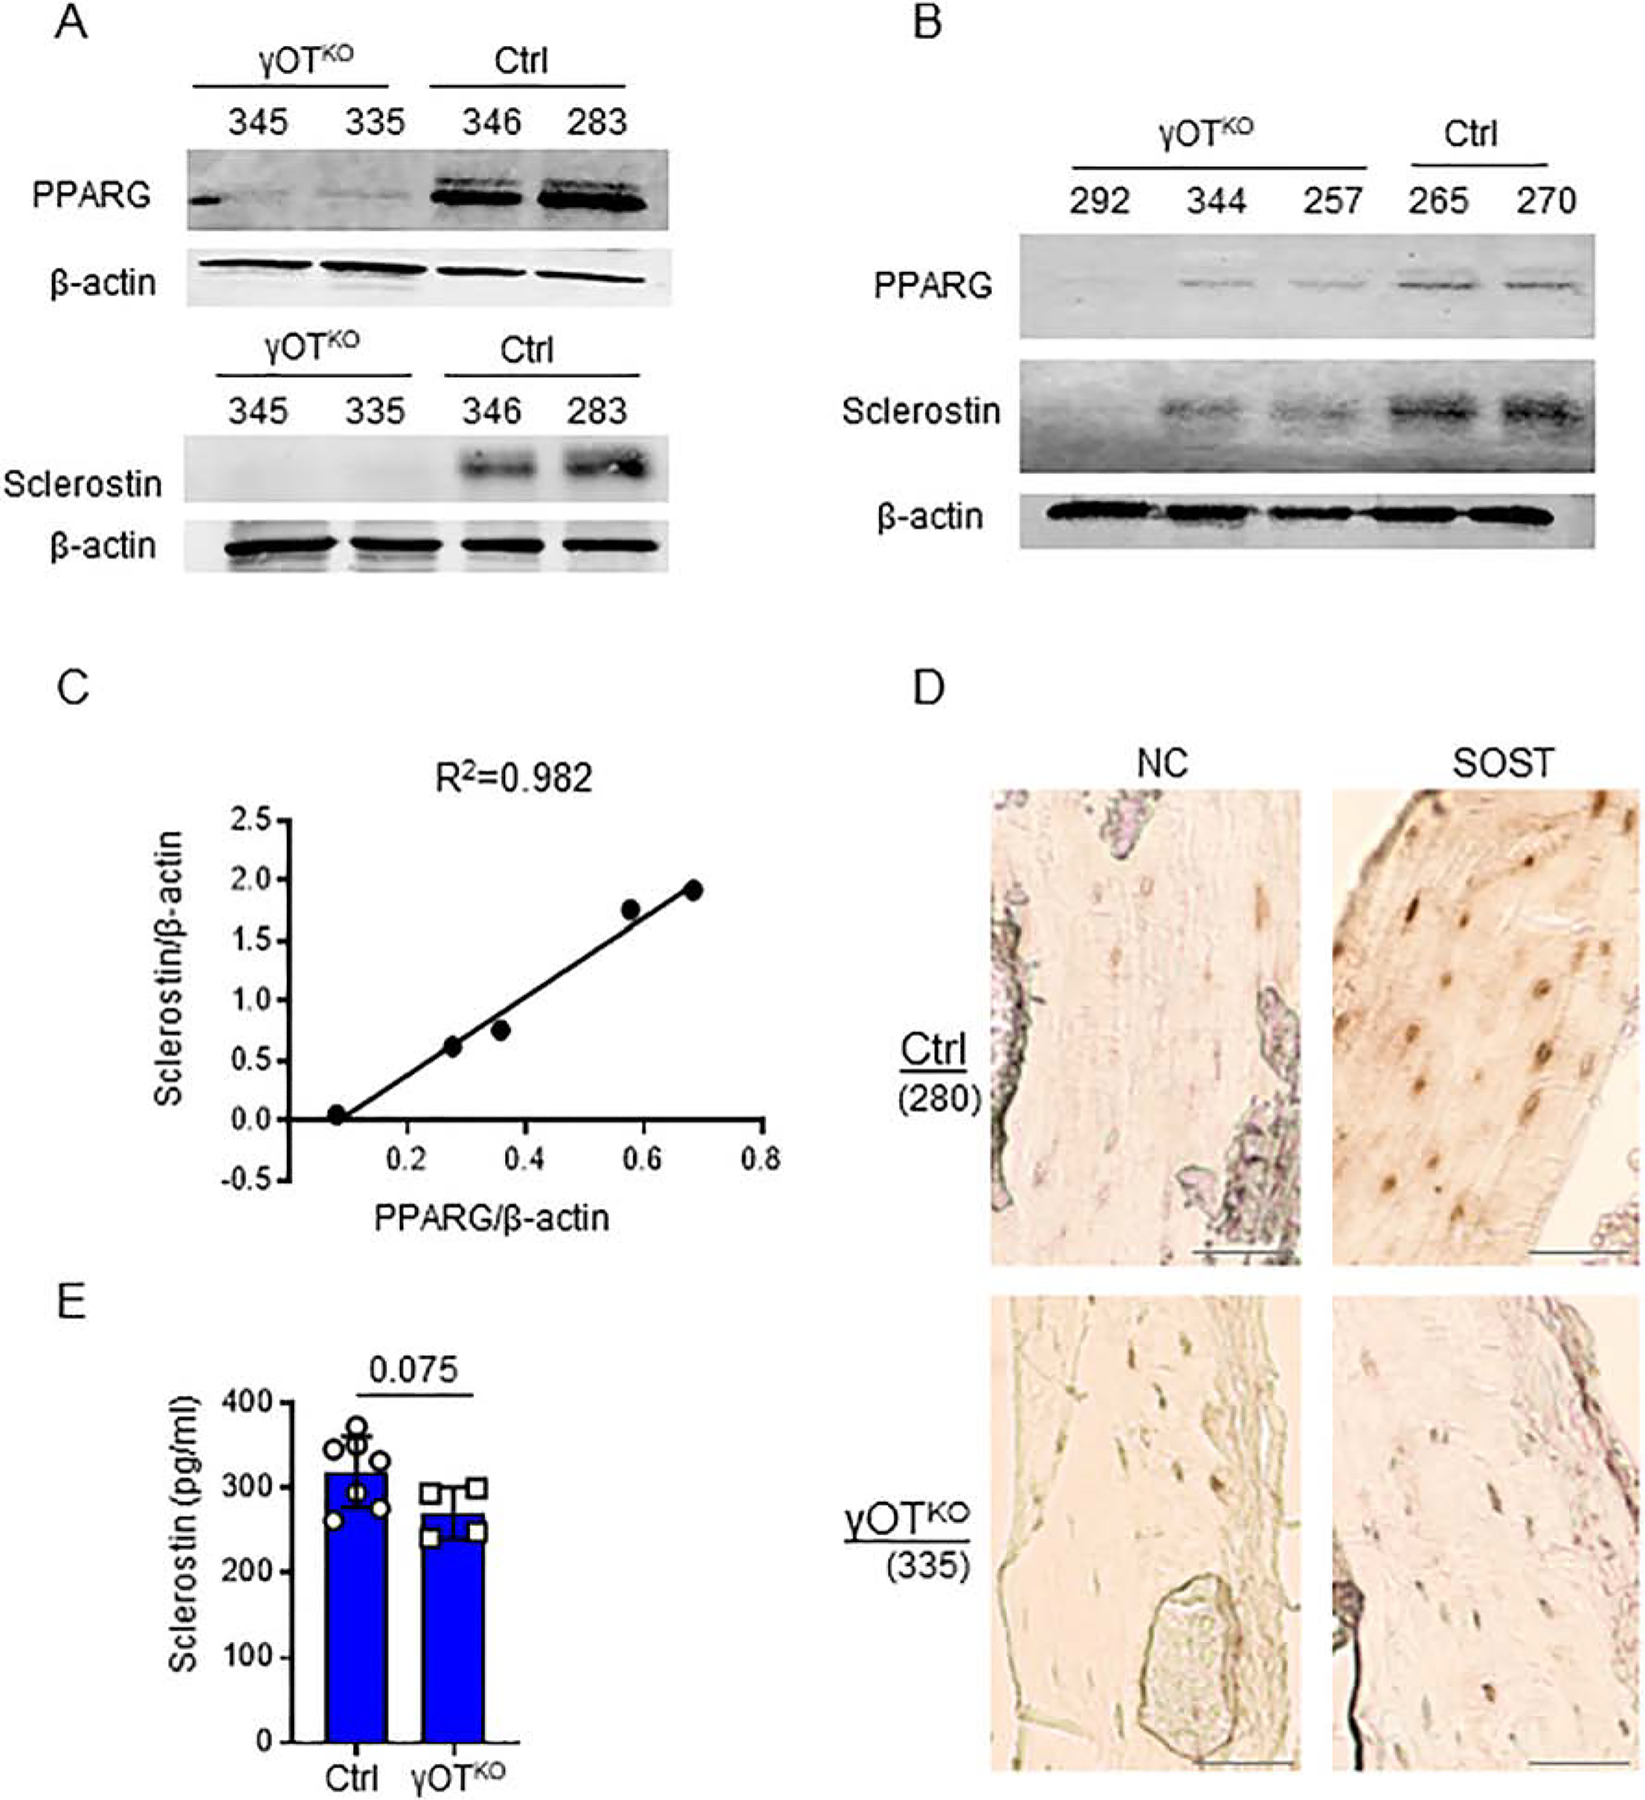
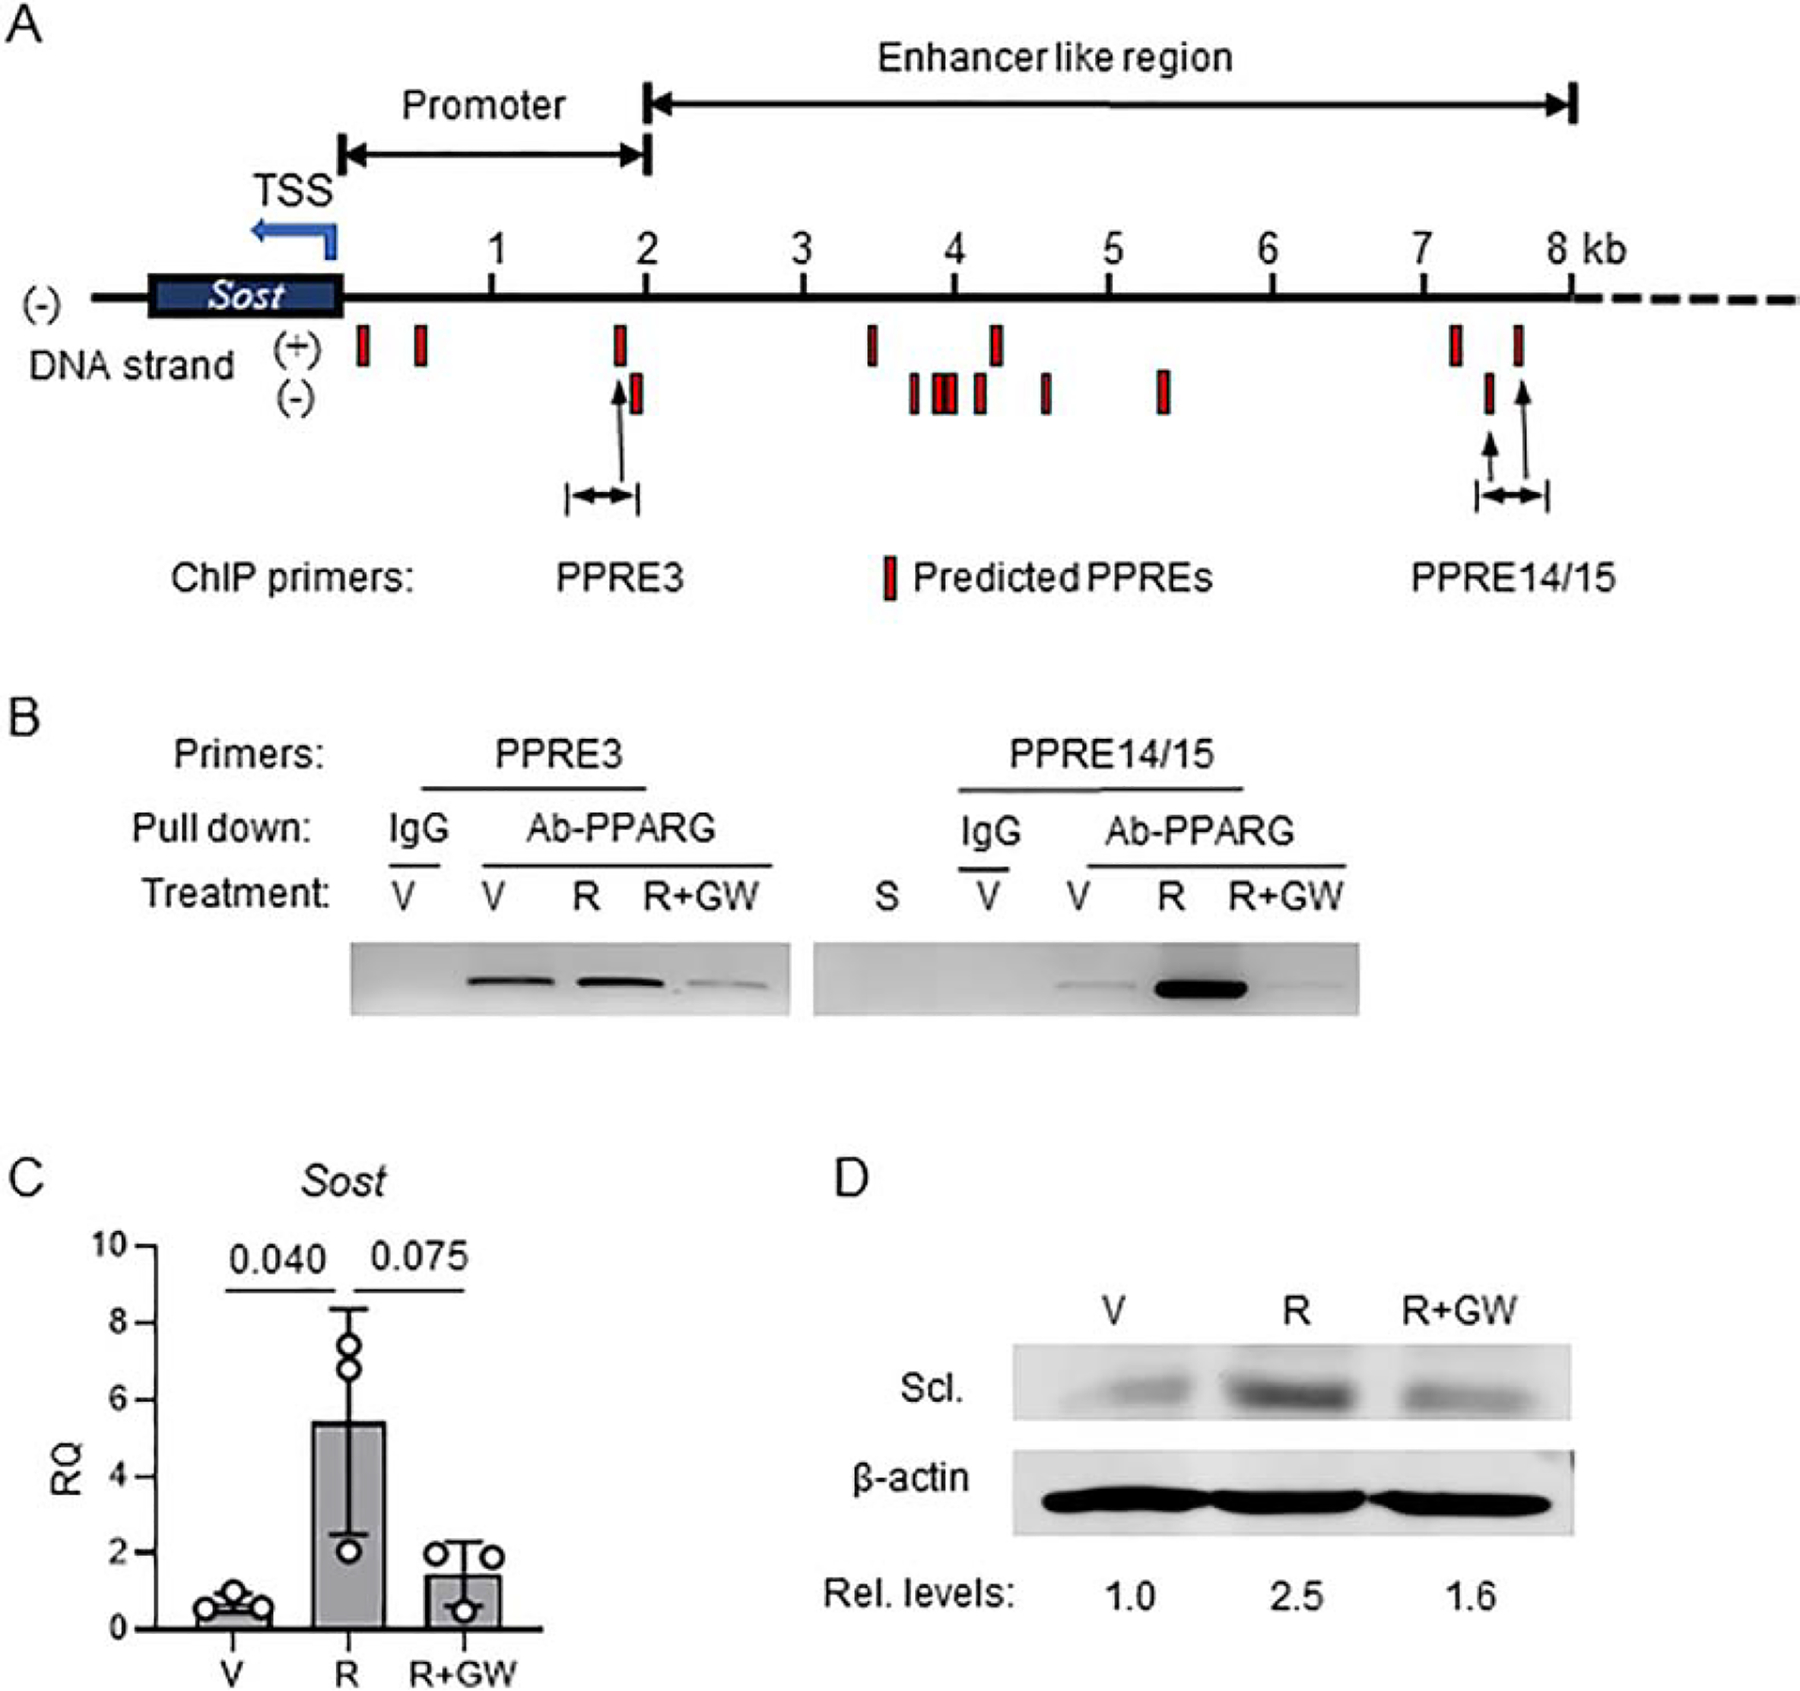
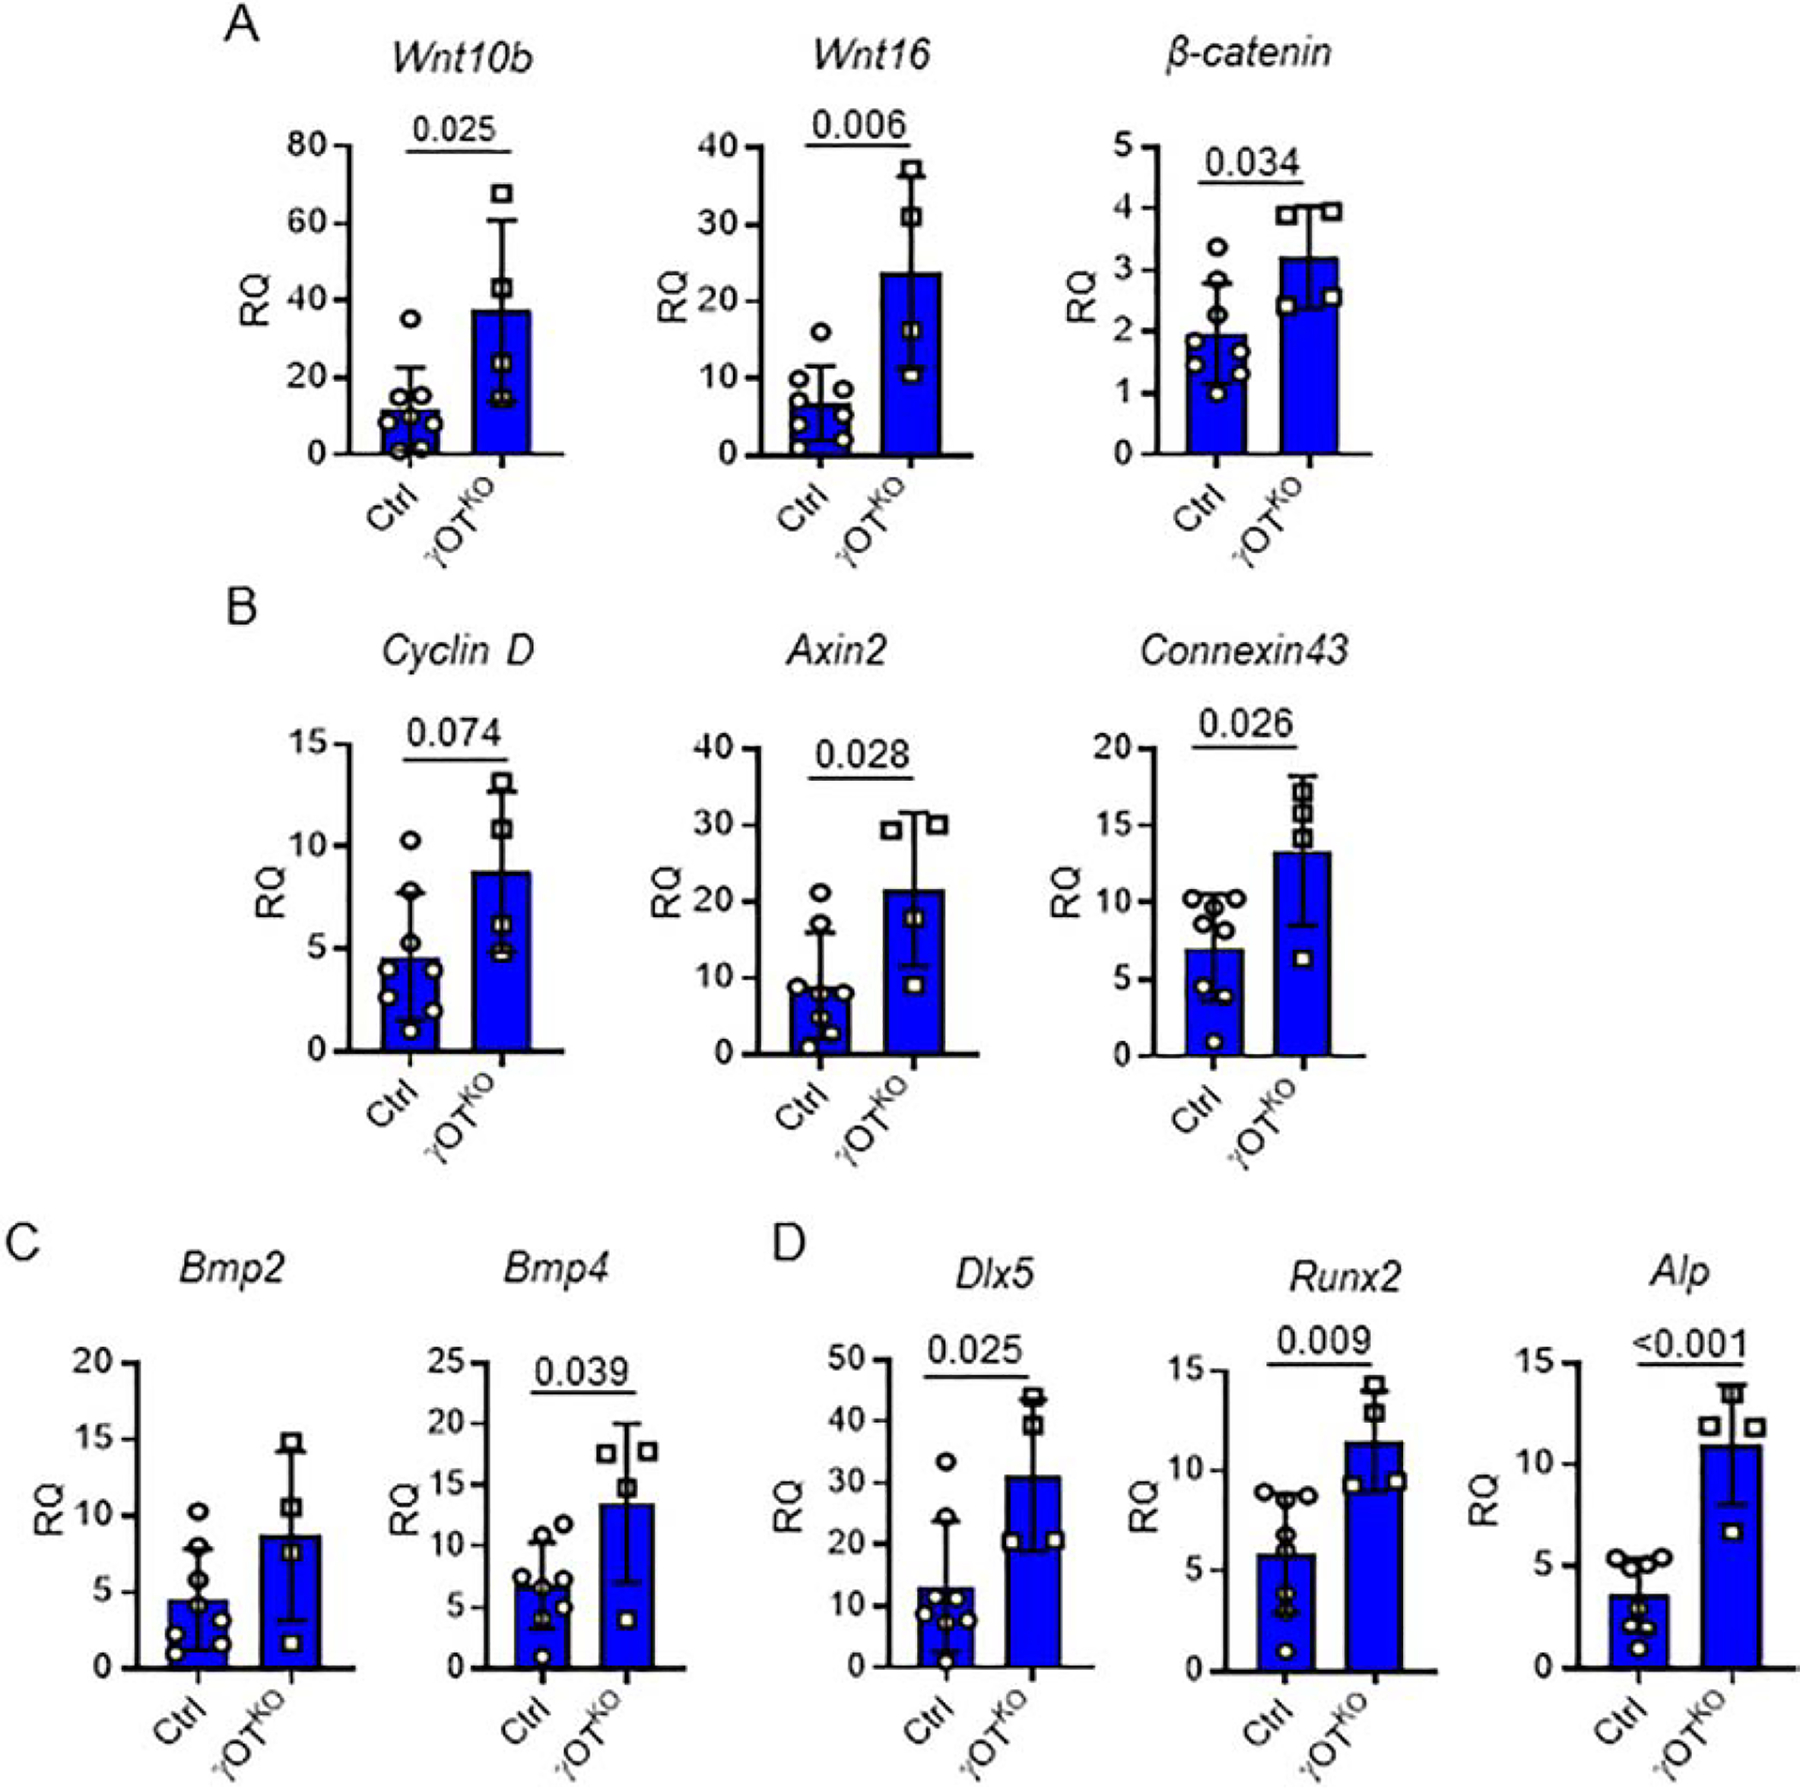
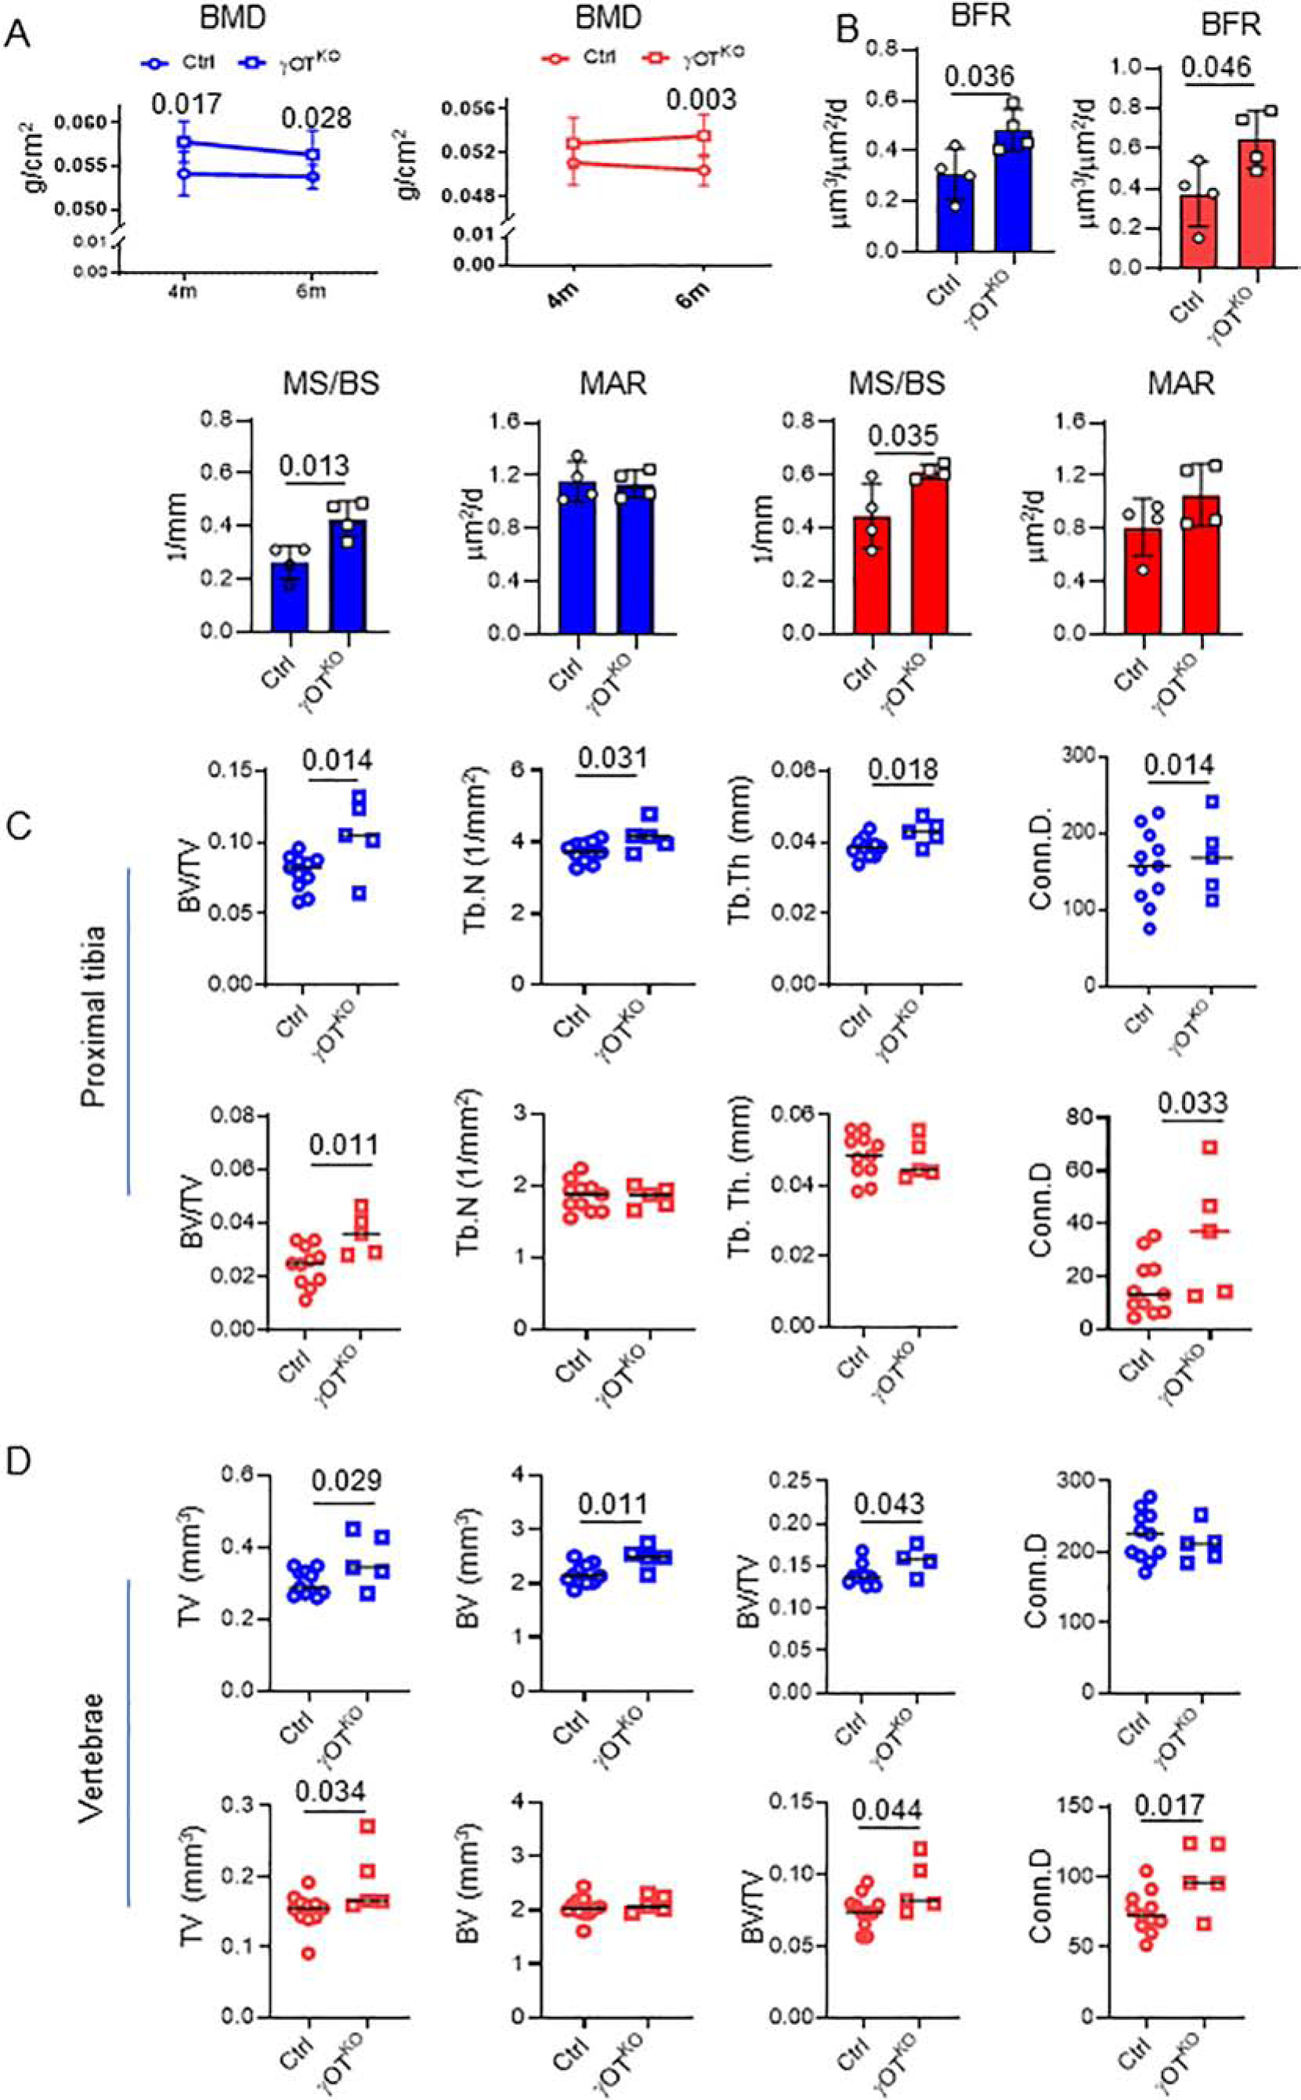
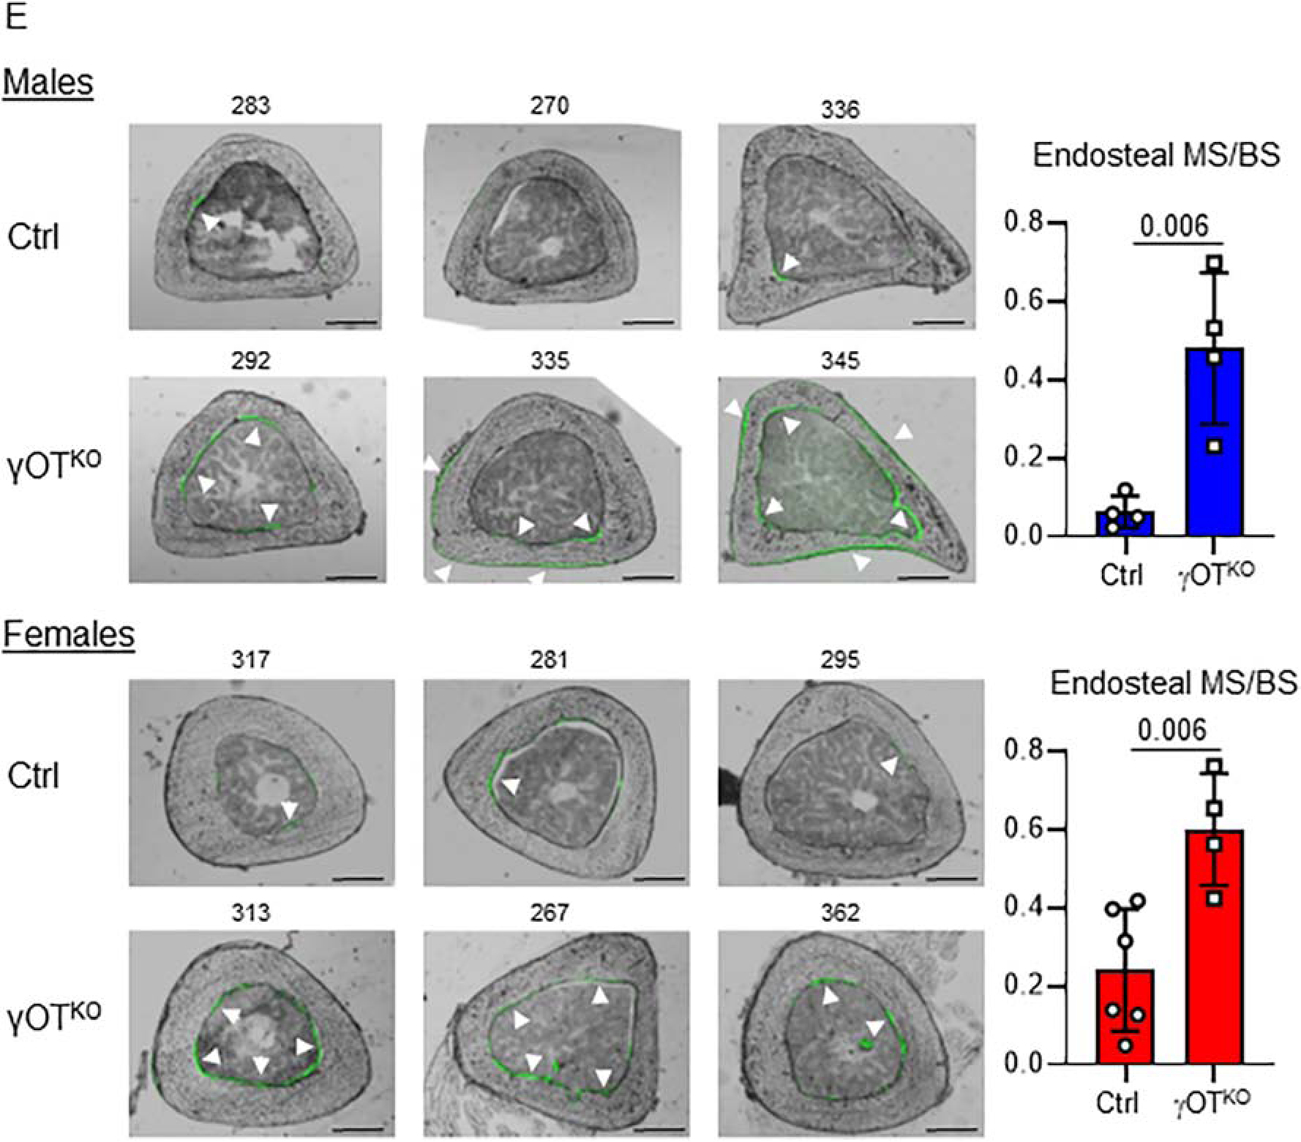
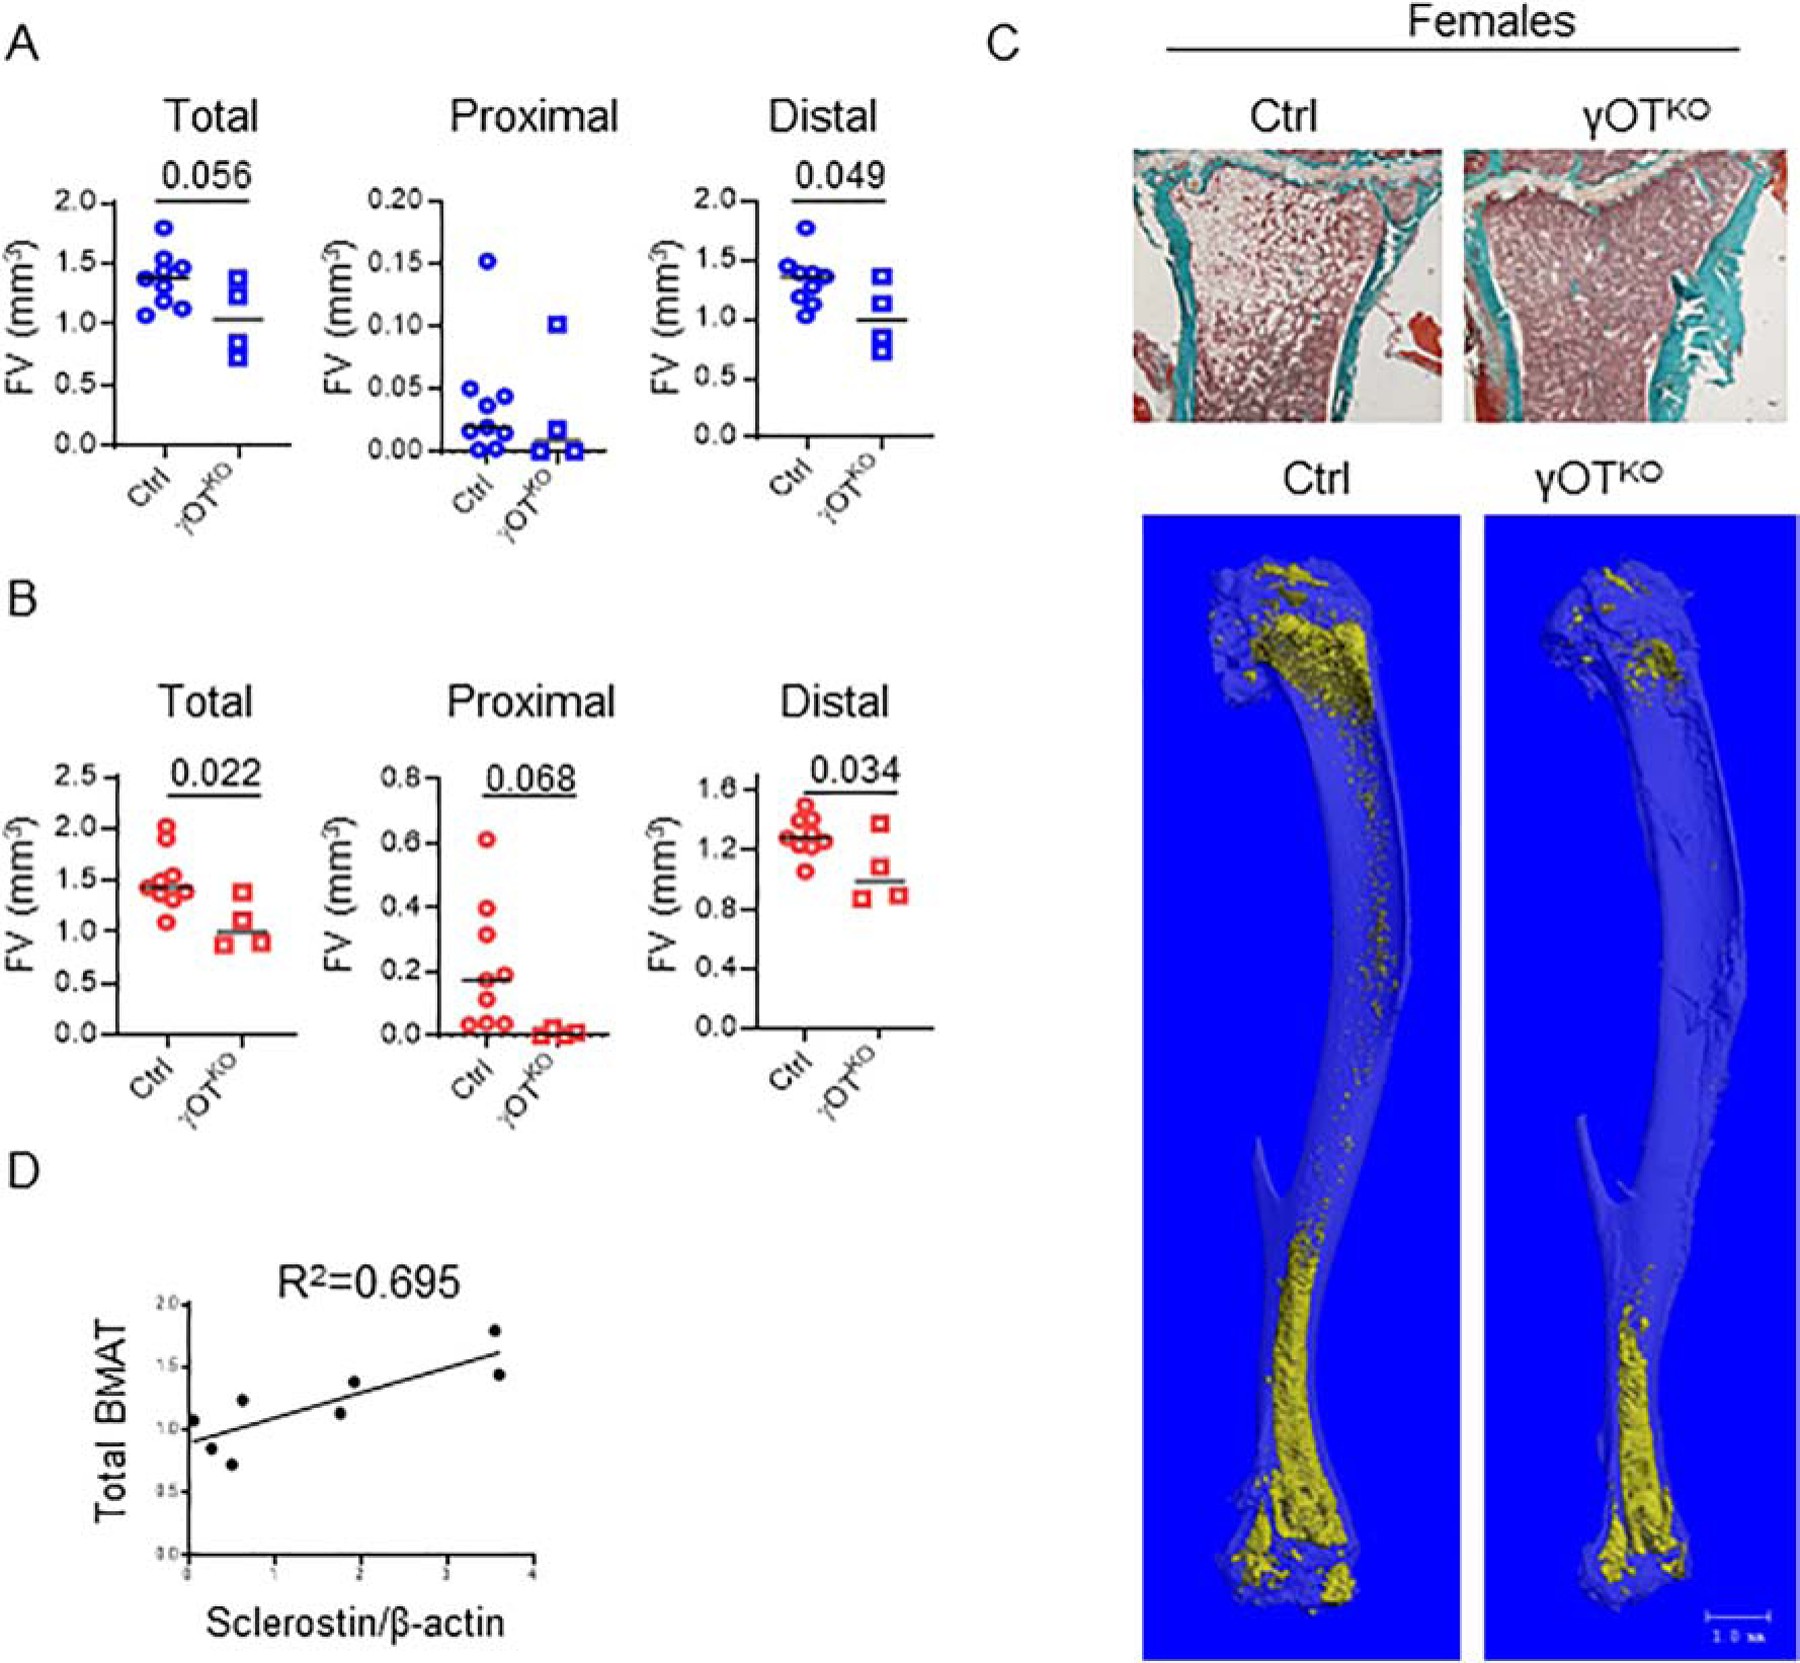
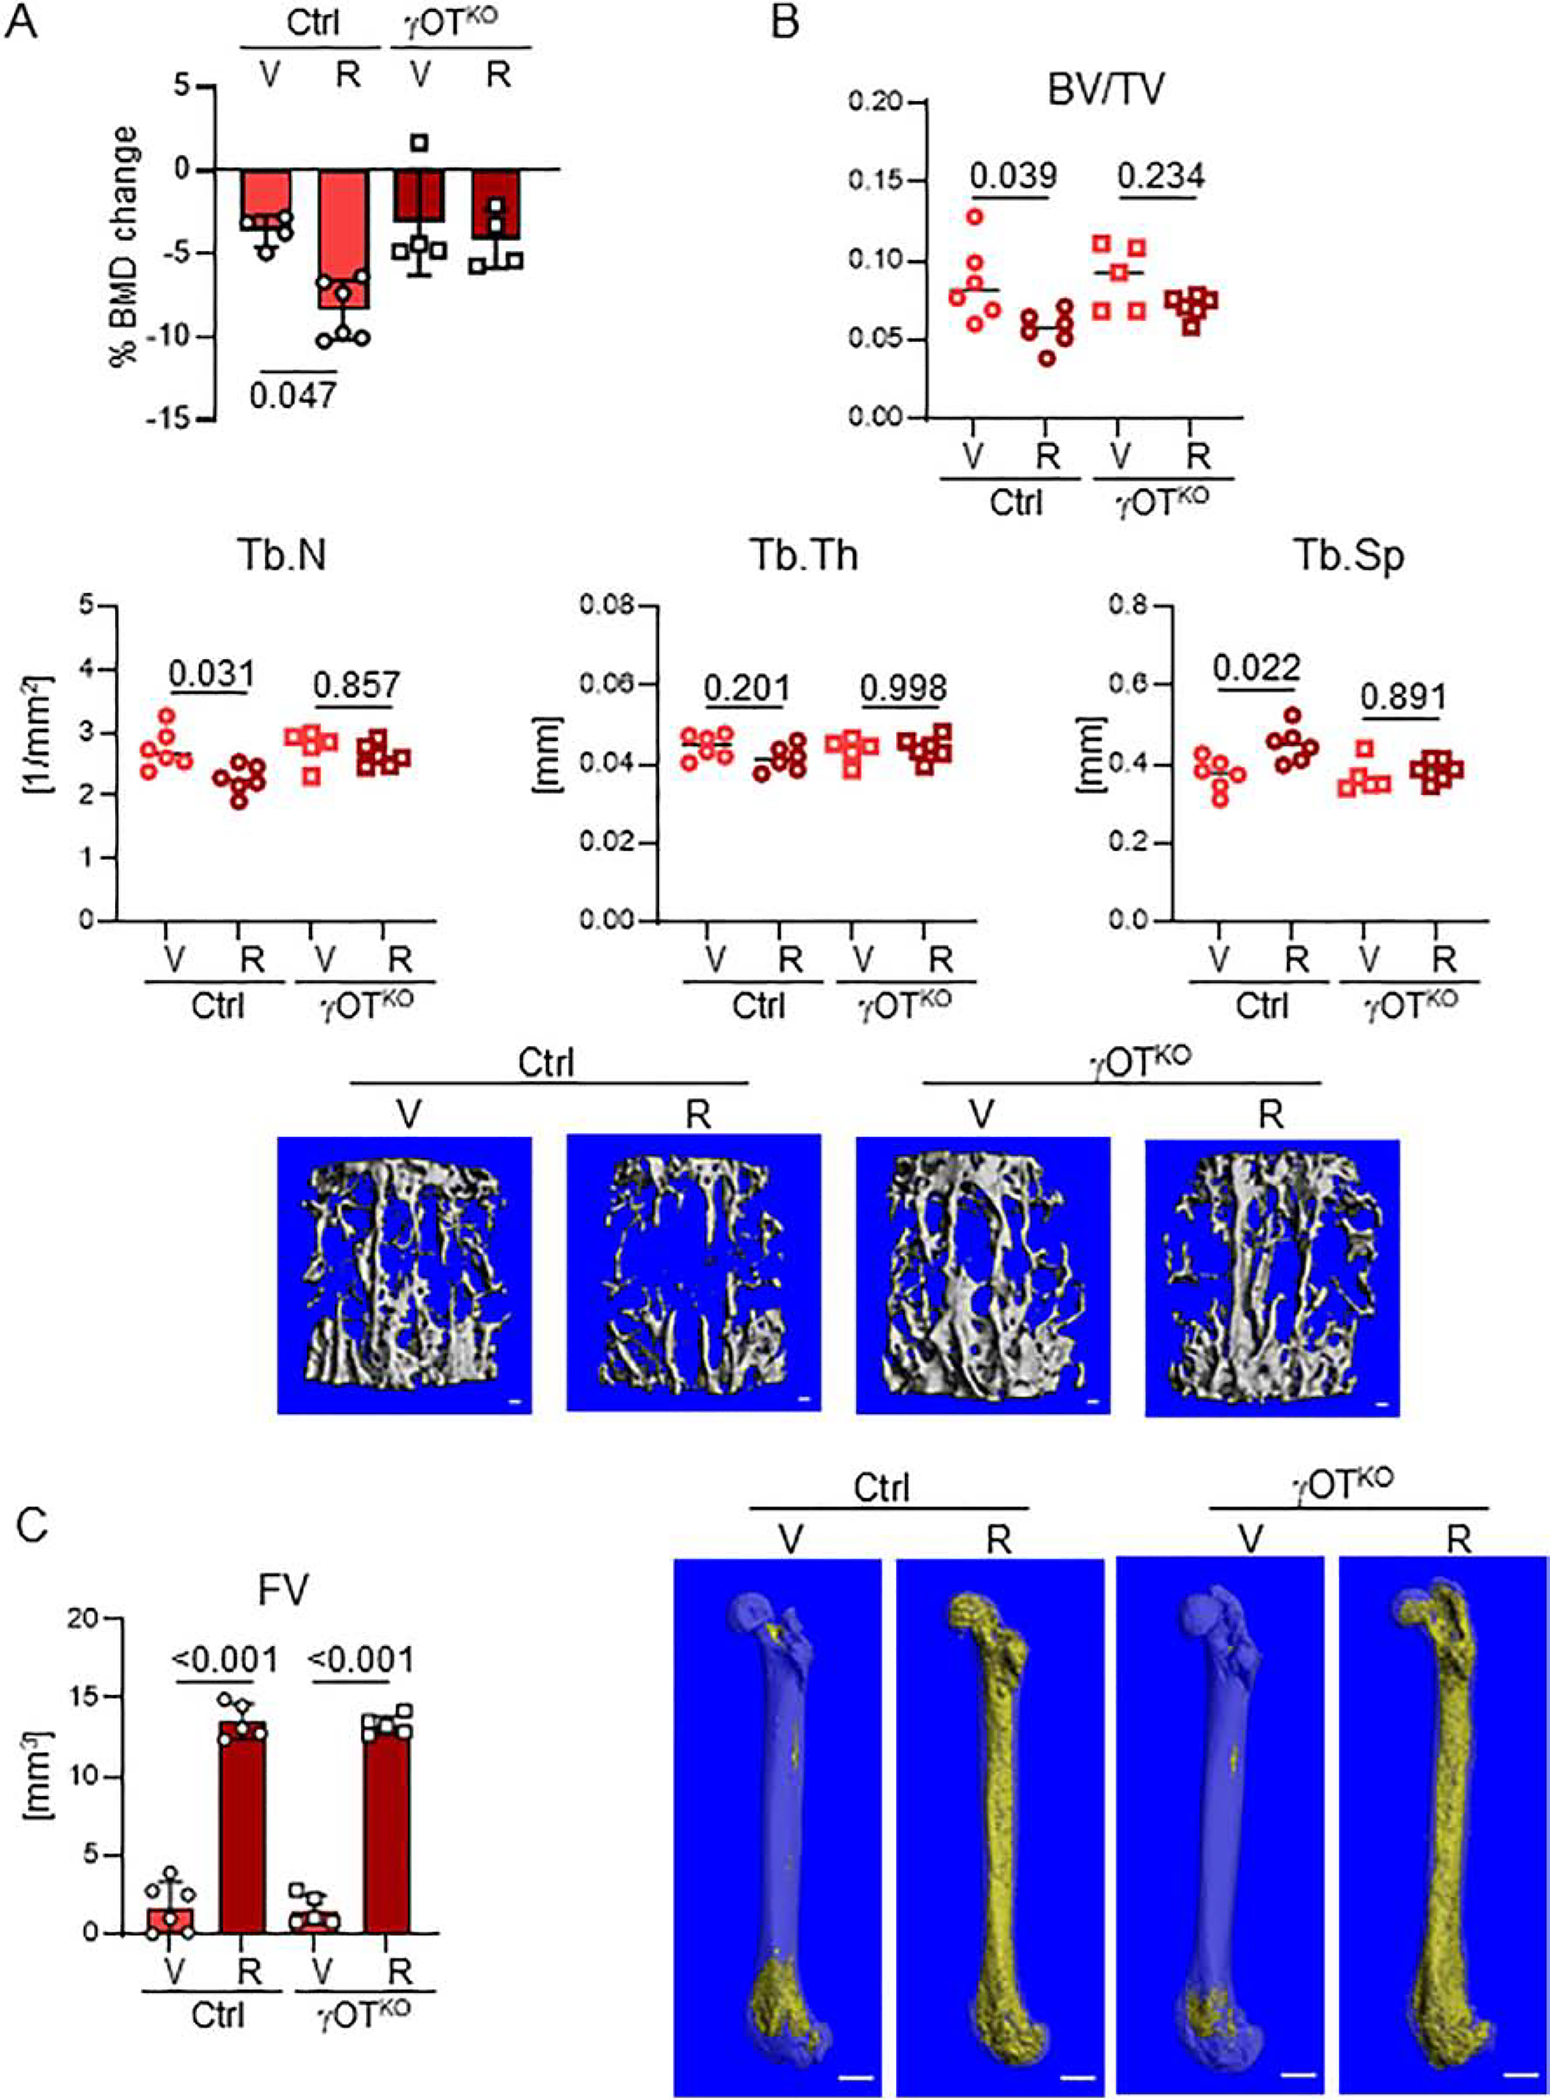
The peroxisome proliferator activated receptor gamma (PPARG) nuclear receptor regulates energy metabolism and insulin sensitivity. In this study, we present novel evidence for an essential role of PPARG in the regulation of osteocyte function, and support for the emerging concept of the conjunction between regulation of energy metabolism and bone mass. We report that PPARG is essential for sclerostin production, a recently approved target to treat osteoporosis. Our mouse model of osteocyte-specific PPARG deletion (Dmp1CrePparγflfl or γOTKO) is characterized with increased bone mass and reduced bone marrow adiposity, which is consistent with upregulation of WNT signaling and increased bone forming activity of endosteal osteoblasts. An analysis of osteocytes derived from γOTKO and control mice showed an excellent correlation between PPARG and SOST/sclerostin at the transcript and protein levels. The 8 kb sequence upstream of Sost gene transcription start site possesses multiple PPARG binding elements (PPREs) with at least two of them binding PPARG with dynamics reflecting its activation with full agonist rosiglitazone and correlating with increased levels of Sost transcript and sclerostin protein expression (Pearson's r = 0.991, p = 0.001). Older γOTKO female mice are largely protected from TZD-induced bone loss providing proof of concept that PPARG in osteocytes can be pharmacologically targeted. These findings demonstrate that transcriptional activities of PPARG are essential for sclerostin expression in osteocytes and support consideration of targeting PPARG activities with selective modulators to treat osteoporosis.

Keywords: Bone mass; Marrow adipocytes; PPARG; PPRE; SOST/sclerostin.


Conflict of interest statement

Disclosure

All authors state that they have no conflicts of interest.

Figures

Figure 1.
Figure 1.
Development of γOTKO mice. A. Pparγ is highly expressed osteocytes (OT) as compared to osteoblasts (OB). OT and OB were isolated from femora cortical bone of 6.5 – 7 mo old C57BL/6 males (blue) (γOTKO n=4 and Ctrl n=4) and females (red) (γOTKO n=8 and Ctrl n=8) using a method of differential collagen digestion and immediately processed for RNA isolation. B. Pparγ expression in OT increases with aging. OT were isolated as above from femora of 6 mo and 10 mo old C57BL/6 female mice. C. Rosiglitazone treatment increases expression of osteocytic Pparγ. OT were isolated from 10 mo old C57BL/6 female mice treated with 25 mg/kg/d rosiglitazone (R) for 6 weeks (γOTKO n=6 and Ctrl n=4). D. Schematic of γOTKO mice development. γOTKO mice have deleted exon 1 and 2 from Pparγ gene, as a result of crossing Dmp1Cre and Pparγflfl mice. E. Pparγ expression in OT isolated from 6 mo old γOTKO (n=6) and Ctrl (n=8) male mice. F. Pparγ expression in OB isolated from the same mice as in E. Numbers above the horizontal bars indicate p values calculated with parametric unpaired Student t-test. RQ – relative quantity.
Figure 2.
Figure 2.
Correlation between PPARG and sclerostin levels in osteocytes. A. and B.Levels of PPARG and sclerostin proteins in OT isolated from femora of 6.5 mo old male γOTKO and Ctrl mice and either analyzed on separate (A) or the same (B) Western blot membrane. Numbers above the lanes indicate mice ID. (γOTKO n=5; Ctrl n=4). C. Pearson correlation analysis of PPARG and sclerostin protein levels shown in panels (A) and (B) (Pearson’s r=0.991, p=0.001) was calculated based on bands density assessed by Image J and normalized to β-actin. R2 represents coefficient of determination. D. Immunohistochemistry for sclerostin protein presence in osteocytes of tibia cortical bone. NC-negative control represents adjacent longitudinal sections processed without primary antibody incubation. Numbers in parenthesis indicate mice ID. Note that SOST is not detected in tibia osteocytes of mouse 335 (γOTKO) which correlates with an absence of detectable sclerostin levels in isolated femora osteocytes, as shown in panel (A). Scale bars correspond to 100 μm. NC – negative control consisted of adjacent sections being processed the same way as those for sclerostin detection, except for primary antibody incubation. E. Sclerostin levels measured by ELISA in sera of γOTKO (n=4) and Ctrl (n=7) 6.5 mo old male mice including animals analyzed in panels (A) – (D). Statistical significance was calculated using parametric unpaired Student’s t test.
Figure 3.
Figure 3.
PPARG positively regulates sclerostin expression. A. Schematic positioning of JASPAR projected PPARG response elements (PPREs) (red bars) upstream of sclerostin transcription start site (TSS). B. Chromatin immunoprecipitation (ChIP) assay end point agarose gel image (full image of the gel is presented in Suppl. Fig. 1). ChIP was performed on osteocyte-like MLO-Y4 cells targeting PPRE3 and PPRE14/15. Cells were treated for 24h with either vehicle (V), or 1μM rosiglitazone (R) or combination of 1μM R and 10μM GW9662 antagonist (R+GW) followed by ChIP assay, as described in Material and Methods. S – sonicated lysate (no antibody pulldown). C. Expression of Sost mRNA in MLO-Y4 cells treated for 3 days with either vehicle (V), or rosiglitazone (R), or combination of rosiglitazone and GW9662 (R+GW) at the same concentration as in (B). One-way ANOVA followed by Tukey’s post hoc analysis was performed for significance calculation. D. Western blot of sclerostin protein levels in MLO-Y4 cells treated as in (C). Sclerostin protein levels were normalized to β-actin levels measured as band density using Image J and relative levels of expression had been calculated and shown below Western blot images.
Figure 4.
Figure 4.
Relative expression of signaling pathways and osteoblast gene markers analyzed in fraction of endosteal osteoblasts freshly isolated by differential collagen digestion of femora cortical bone of 6.5 mo old males. A. WNT pathway signaling gene markers. B. Expression of genes positively regulated by WNT signaling. C. BMP signaling gene markers. D. Expression of genes positively regulated by WNT and BMP signaling and representing markers of bone forming osteoblasts. Ctrl (n=8) and γOTKO (n=4). Statistical significance was calculated using parametric unpaired Student’s t test.
Figure 5.
Figure 5.
Both males (blue) and females (red) γOTKO mice exhibit high bone mass and high bone formation. A. Measurements of global BMD using DXA at 4 mo and 6 mo of age. Ctrl (n=11) and γOTKO (n=5). B. Bone formation rate (BFR), fraction of mineralizing bone surface (MS/BS), and mineral apposition rate (MAR) in 6.5 mo old males and 7 mo old females measured in calcein double-labeled tibia. Ctrl (n=4) and γOTKO (n=4). C. μCT measurements of trabecular bone in proximal tibia. D. μCT measurements of trabecular bone in L4 vertebrae. C and D. Ctrl (n=11) and γOTKO (n=5). TV – tissue volume, BV – bone volume, BV/TV – trabecular bone mass, Tb.N – trabecular number, Tb.Th – trabecular thickness, Conn.D – connectivity density. Statistical significance was calculated using parametric unpaired Student’s t test. E. Fluorescence and bright fields overlayed images of cross-sectioned tibia midshaft of the same animals as in (B). Numbers above the images indicate mice IDs. Note the correlation between very low sclerostin levels in OT of γOTKO mice (#335, 345, 292) in Fig. 2A and 2B and high calcein labeling on endosteal and periosteal tibia bone surface of the same mice. In contrast, very low calcein labeling of cortical bone corresponds to normal sclerostin levels in Ctrl mice (#283 and 270) as shown in Fig. 2A and 2B. White arrows point to calcein labeled bone surface. Scale bars correspond to 500 μm. Graphs represent quantification of endosteal mineralized surface of males (blue) (Ctrl n=4; γOTKO n=4) and females (red) (Ctrl n=6; γOTKO n=4). Statistical significance was calculated using parametric unpaired Student’s t test.
Figure 5.
Figure 5.
Both males (blue) and females (red) γOTKO mice exhibit high bone mass and high bone formation. A. Measurements of global BMD using DXA at 4 mo and 6 mo of age. Ctrl (n=11) and γOTKO (n=5). B. Bone formation rate (BFR), fraction of mineralizing bone surface (MS/BS), and mineral apposition rate (MAR) in 6.5 mo old males and 7 mo old females measured in calcein double-labeled tibia. Ctrl (n=4) and γOTKO (n=4). C. μCT measurements of trabecular bone in proximal tibia. D. μCT measurements of trabecular bone in L4 vertebrae. C and D. Ctrl (n=11) and γOTKO (n=5). TV – tissue volume, BV – bone volume, BV/TV – trabecular bone mass, Tb.N – trabecular number, Tb.Th – trabecular thickness, Conn.D – connectivity density. Statistical significance was calculated using parametric unpaired Student’s t test. E. Fluorescence and bright fields overlayed images of cross-sectioned tibia midshaft of the same animals as in (B). Numbers above the images indicate mice IDs. Note the correlation between very low sclerostin levels in OT of γOTKO mice (#335, 345, 292) in Fig. 2A and 2B and high calcein labeling on endosteal and periosteal tibia bone surface of the same mice. In contrast, very low calcein labeling of cortical bone corresponds to normal sclerostin levels in Ctrl mice (#283 and 270) as shown in Fig. 2A and 2B. White arrows point to calcein labeled bone surface. Scale bars correspond to 500 μm. Graphs represent quantification of endosteal mineralized surface of males (blue) (Ctrl n=4; γOTKO n=4) and females (red) (Ctrl n=6; γOTKO n=4). Statistical significance was calculated using parametric unpaired Student’s t test.
Figure 6.
Figure 6.
Levels of bone turnover markers in sera of 6.5 mo old males (blue) (Ctrl n=6–9; γOTKO n=5–6) and 7 mo old females (red) (Ctrl n=4; γOTKO n=5). BALP – bone specific alkaline phosphatase, P1NP - N-terminal propeptide of type I procollagen (P1NP), TRAcP 5b - tartrate-resistant acid phosphatase form 5b. Statistical significance was calculated using parametric unpaired Student’s t test.
Figure 7.
Figure 7.
PPARG in osteocytes regulates marrow fat content. A. BMAT content in tibia of 6.5 mo old males γOTKO (n=4) and Ctrl (n=9) mice. Measurements were done using μCT after decalcification of tibia followed by OsO4 staining. B. BMAT measurements in tibia of 7 mo old females γOTKO (n=4) and Ctrl (n=9) mice. C. Representative Goldner’s Trichrome stained proximal tibia of female Ctrl and γOTKO mice and renderings of OsO4 stained entire tibia (below) μCT images of female Ctrl and γOTKO mice. Bar on mCT renderings indicates 1 mm. D. Pearson correlation of marrow fat volume (determined by mCT) and sclerostin protein levels (determined by Western blot) in osteocytes of Ctrl and γOTKO male mice (n=8), the same animals which were analyzed in Fig. 7A and Fig.2A and 2B (Pearson’s r=0.883, p=0.010). R2 – represents coefficient of determination. Statistical significance was calculated using parametric unpaired Student’s t test.
Figure 8.
Figure 8.
Osteocyte derived sclerostin positively contributes to marrow adipocyte differentiation. A. Schematic showing experimental design of co-culture of BMSC with intact or sclerostin depleted conditioned medium (CM). One group of adherent BMSC culture received IgG depleted CM from primary osteocytes (control group) while the other group received sclerostin depleted CM (group of interest). B. ELISA measurements of sclerostin level in CM after anti-SOST antibody mediated depletion. C. Expression of adipocytic and osteoblastic gene markers in adherent BMSCs treated with CM from primary osteocytes IgG or sclerostin (Ab-Scl) depleted. Statistical significance was calculated using parametric unpaired Student’s t test.
Figure 9.
Figure 9.
Bone of γOTKO mice is partially protected from the detrimental effects of rosiglitazone. A. Percent change in global BMD after 4 wks treatment of 10 mo old females with rosiglitazone (25 mg/kg/d). n=4–5 per group. B. μCT measurements of trabecular bone in L4 vertebrae and representative renderings. n=5–6/group. BV/TV – trabecular bone mass, Tb.N – trabecular number, Tb.Th – trabecular thickness, Tb.Sp – trabecular spacing. Bar on renderings indicates 0.1 mm. C. Left - Total fat volume in femora measured with μCT after decalcification and staining with OsO4 (n=5/group). Right - Representative mCT renderings. Bar on renderings indicates 1 mm. Statistical analysis was performed using Two-way Anova followed by Tukey’s multiple comparison test and p values are indicated over horizontal lines on graphs.

Similar articles

Cited by

References

    1. Dirckx N, Moorer MC, Clemens TL, Riddle RC, The role of osteoblasts in energy homeostasis, Nat Rev Endocrinol 15(11) (2019) 651–665. - PMC - PubMed
    1. Schwartz AV, Diabetes, bone and glucose-lowering agents: clinical outcomes, Diabetologia 60(7) (2017) 1170–1179. - PubMed
    1. Lecka-Czernik B, Diabetes, bone and glucose-lowering agents: basic biology, Diabetologia 60(7) (2017) 1163–1169. - PMC - PubMed
    1. Ahmadian M, Suh JM, Hah N, Liddle C, Atkins AR, Downes M, Evans RM, PPARγ signaling and metabolism: the good, the bad and the future, Nature medicine 19(5) (2013) 557–566. - PMC - PubMed
    1. Elrod HA, Sun SY, PPARgamma and Apoptosis in Cancer, PPAR research 2008 (2008) 704165. - PMC - PubMed

Publication types

Substances