

VirB, a key transcriptional regulator of virulence plasmid genes in Shigella flexneri, forms DNA-binding site dependent foci in the bacterial cytoplasm
- PMID: 33722845
- PMCID: PMC8117518
- DOI: 10.1128/JB.00627-20
VirB, a key transcriptional regulator of virulence plasmid genes in Shigella flexneri, forms DNA-binding site dependent foci in the bacterial cytoplasm
Abstract
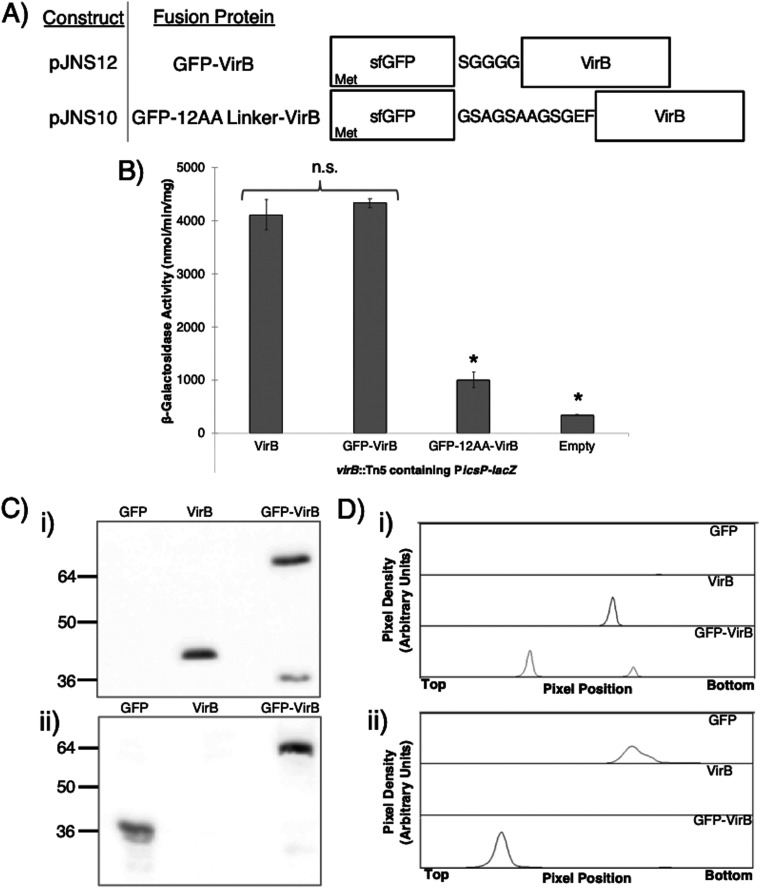
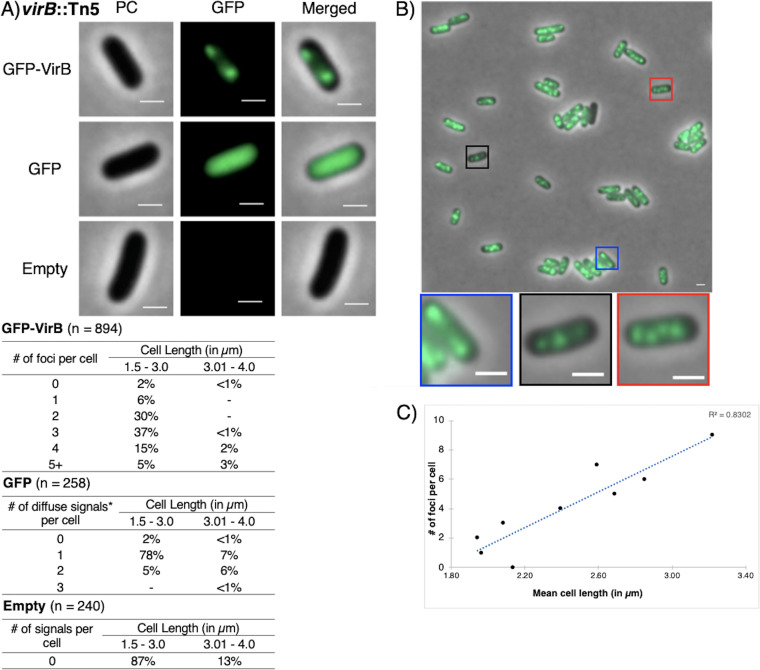
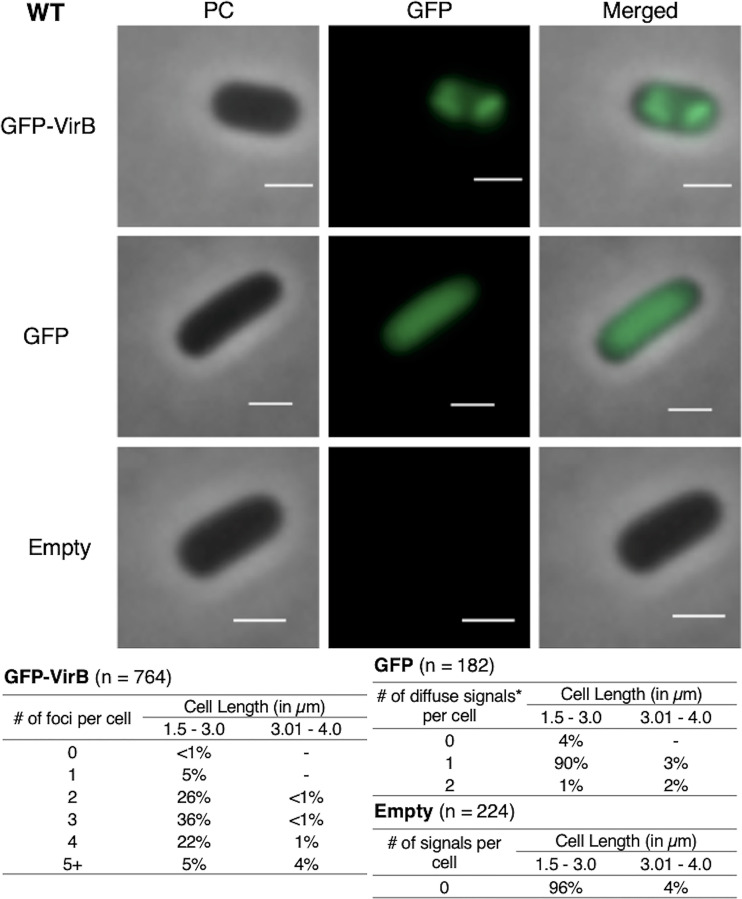
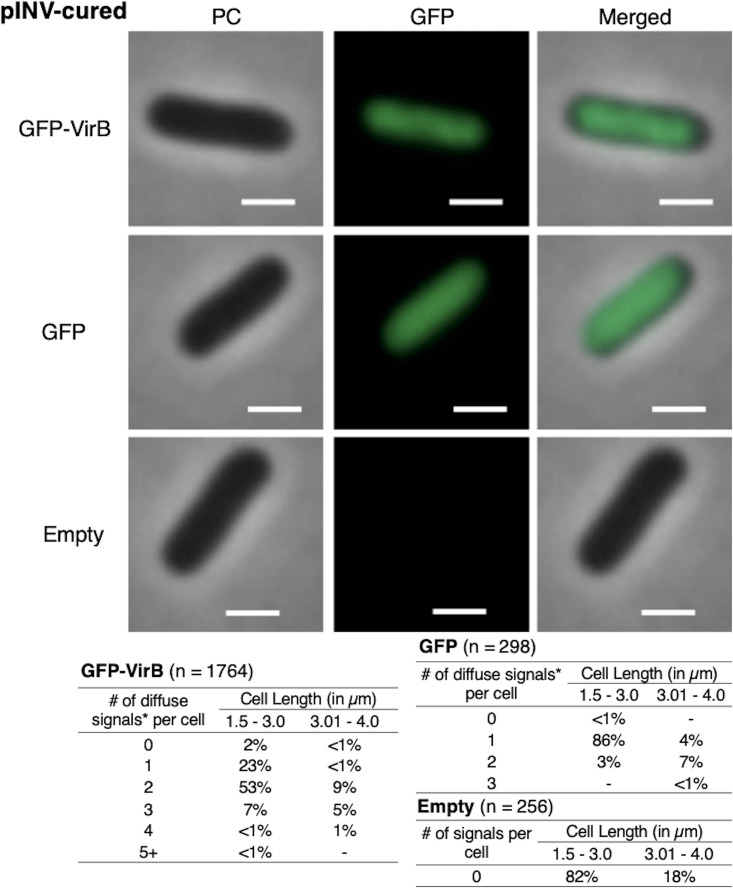
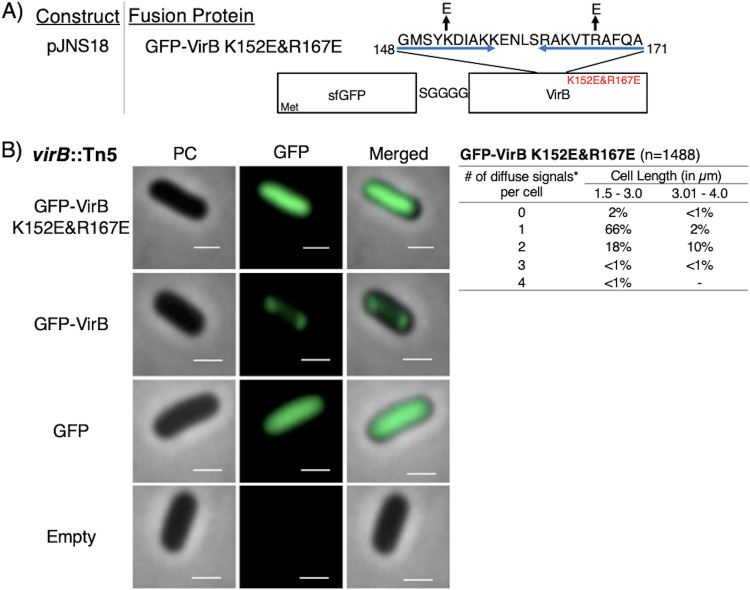
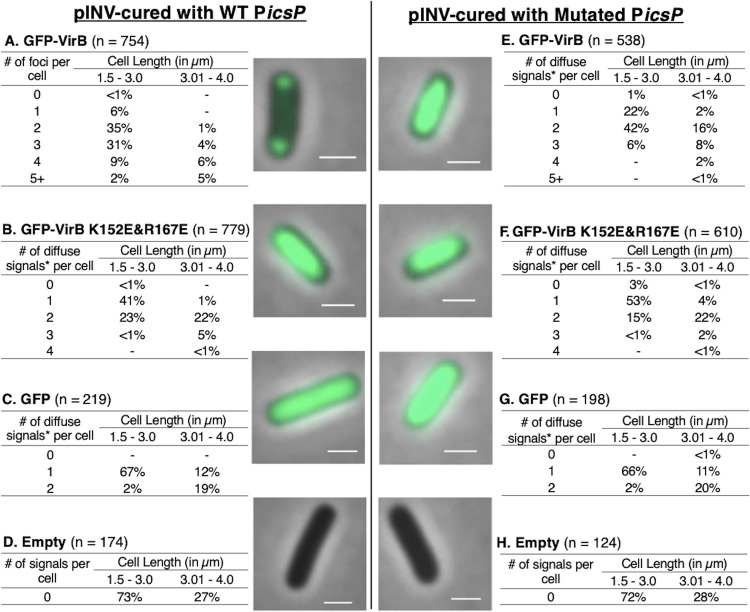
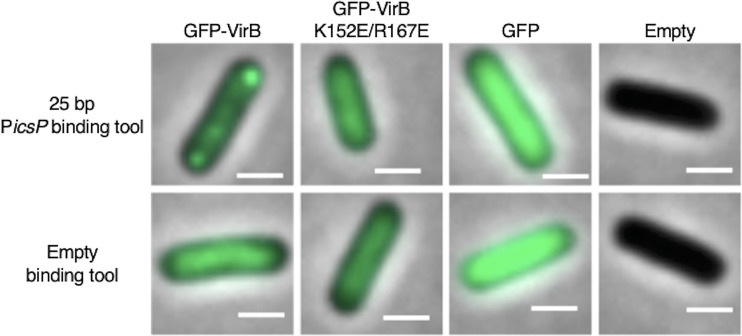
VirB is a key regulator of genes located on the large virulence plasmid (pINV) in the bacterial pathogen Shigella flexneri VirB is unusual; it is not related to other transcriptional regulators, instead, it belongs to a family of proteins that primarily function in plasmid and chromosome partitioning; exemplified by ParB. Despite this, VirB does not function to segregate DNA, but rather counters transcriptional silencing mediated by the nucleoid structuring protein, H-NS. Since ParB localizes subcellularly as discrete foci in the bacterial cytoplasm, we chose to investigate the subcellular localization of VirB to gain novel insight into how VirB functions as a transcriptional anti-silencer. To do this, a GFP-VirB fusion that retains the regulatory activity of VirB and yet, does not undergo significant protein degradation in S. flexneri, was used. Surprisingly, discrete fluorescent foci were observed in live wild-type S. flexneri cells and an isogenic virB mutant using fluorescence microscopy. In contrast, foci were rarely observed (<10%) in pINV-cured cells or in cells expressing a GFP-VirB fusion carrying amino acid substitutions in the VirB DNA binding domain. Finally, the 25 bp VirB-binding site was demonstrated to be sufficient and necessary for GFP-VirB focus formation using a set of small surrogate plasmids. Combined, these data demonstrate that the VirB:DNA interactions required for the transcriptional anti-silencing activity of VirB on pINV are a prerequisite for the subcellular localization of VirB in the bacterial cytoplasm. The significance of these findings, in light of the anti-silencing activity of VirB, is discussed.ImportanceThis study reveals the subcellular localization of VirB, a key transcriptional regulator of virulence genes found on the large virulence plasmid (pINV) in Shigella. Fluorescent signals generated by an active GFP-VirB fusion form 2, 3, or 4 discrete foci in the bacterial cytoplasm, predominantly at the quarter cell position. These signals are completely dependent upon VirB interacting with its DNA binding site found either on the virulence plasmid or an engineered surrogate. Our findings: 1) provide novel insight into VirB:pINV interactions, 2) suggest that VirB may have utility as a DNA marker, and 3) raise questions about how and why this anti-silencing protein that controls virulence gene expression on pINV of Shigella spp. forms discrete foci/hubs within the bacterial cytoplasm.
Copyright © 2021 American Society for Microbiology.
Figures
Similar articles
-
A Tale about Shigella: Evolution, Plasmid, and Virulence.Microorganisms. 2023 Jun 30;11(7):1709. doi: 10.3390/microorganisms11071709. Microorganisms. 2023. PMID: 37512882 Free PMC article. Review.
-
VirB, a key transcriptional regulator of Shigella virulence, requires a CTP ligand for its regulatory activities.bioRxiv [Preprint]. 2023 May 18:2023.05.16.541010. doi: 10.1101/2023.05.16.541010. bioRxiv. 2023. Update in: mBio. 2023 Oct 31;14(5):e0151923. doi: 10.1128/mbio.01519-23. PMID: 37293012 Free PMC article. Updated. Preprint.
-
VirB, a transcriptional activator of virulence in Shigella flexneri, uses CTP as a cofactor.Commun Biol. 2023 Nov 25;6(1):1204. doi: 10.1038/s42003-023-05590-8. Commun Biol. 2023. PMID: 38007587 Free PMC article.
-
H-NS regulation of virulence gene expression in enteroinvasive Escherichia coli harboring the virulence plasmid integrated into the host chromosome.J Bacteriol. 1995 Aug;177(16):4703-12. doi: 10.1128/jb.177.16.4703-4712.1995. J Bacteriol. 1995. PMID: 7642498 Free PMC article.
-
The Multifaceted Activity of the VirF Regulatory Protein in the Shigella Lifestyle.Front Mol Biosci. 2016 Sep 29;3:61. doi: 10.3389/fmolb.2016.00061. eCollection 2016. Front Mol Biosci. 2016. PMID: 27747215 Free PMC article. Review.
Cited by
-
The antioxidant, wound healing properties and proteomic analysis of water extracts from the tropical cyanobacteria, Nostoc NIES-2111_MUM004.3 Biotech. 2023 Feb;13(2):71. doi: 10.1007/s13205-022-03448-0. Epub 2023 Feb 2. 3 Biotech. 2023. PMID: 36742448 Free PMC article.
-
The virulence regulator VirB from Shigella flexneri uses a CTP-dependent switch mechanism to activate gene expression.Nat Commun. 2024 Jan 5;15(1):318. doi: 10.1038/s41467-023-44509-z. Nat Commun. 2024. PMID: 38182620 Free PMC article.
-
VirB, a key transcriptional regulator of Shigella virulence, requires a CTP ligand for its regulatory activities.mBio. 2023 Oct 31;14(5):e0151923. doi: 10.1128/mbio.01519-23. Epub 2023 Sep 20. mBio. 2023. PMID: 37728345 Free PMC article.
-
A Tale about Shigella: Evolution, Plasmid, and Virulence.Microorganisms. 2023 Jun 30;11(7):1709. doi: 10.3390/microorganisms11071709. Microorganisms. 2023. PMID: 37512882 Free PMC article. Review.
-
Genomic and proteomic characterization of two strains of Shigella flexneri 2 isolated from infants' stool samples in Argentina.BMC Genomics. 2022 Jul 8;23(1):495. doi: 10.1186/s12864-022-08711-5. BMC Genomics. 2022. PMID: 35804311 Free PMC article.
References
Grants and funding
LinkOut - more resources
Full Text Sources
Other Literature Sources
Miscellaneous
