. 2021 Sep;70(9):1665-1674.
doi: 10.1136/gutjnl-2020-323877. Epub 2021 Mar 15.

Blue poo: impact of gut transit time on the gut microbiome using a novel marker

Affiliations

Blue poo: impact of gut transit time on the gut microbiome using a novel marker

Francesco Asnicar et al. Gut. 2021 Sep.

Abstract

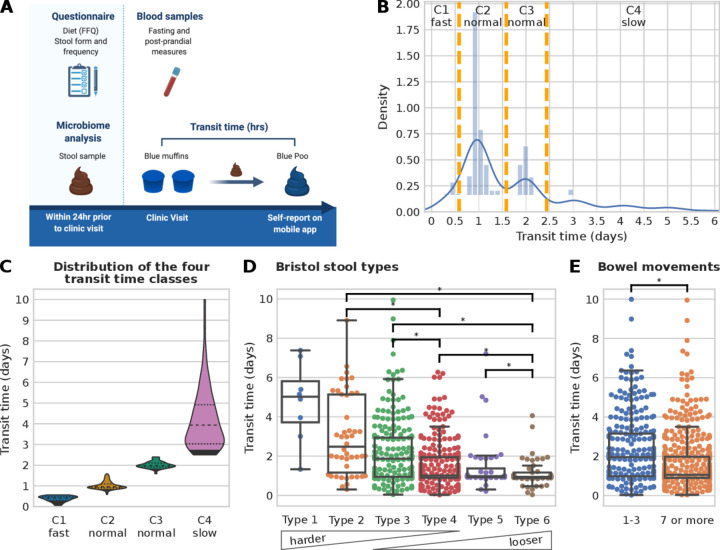
Background and aims: Gut transit time is a key modulator of host-microbiome interactions, yet this is often overlooked, partly because reliable methods are typically expensive or burdensome. The aim of this single-arm, single-blinded intervention study is to assess (1) the relationship between gut transit time and the human gut microbiome, and (2) the utility of the 'blue dye' method as an inexpensive and scalable technique to measure transit time.

Methods: We assessed interactions between the taxonomic and functional potential profiles of the gut microbiome (profiled via shotgun metagenomic sequencing), gut transit time (measured via the blue dye method), cardiometabolic health and diet in 863 healthy individuals from the PREDICT 1 study.

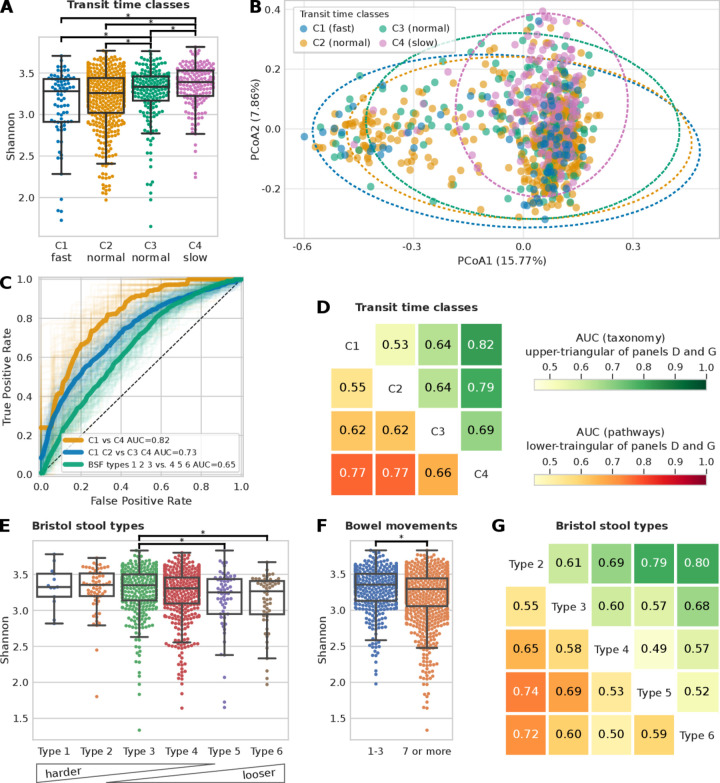
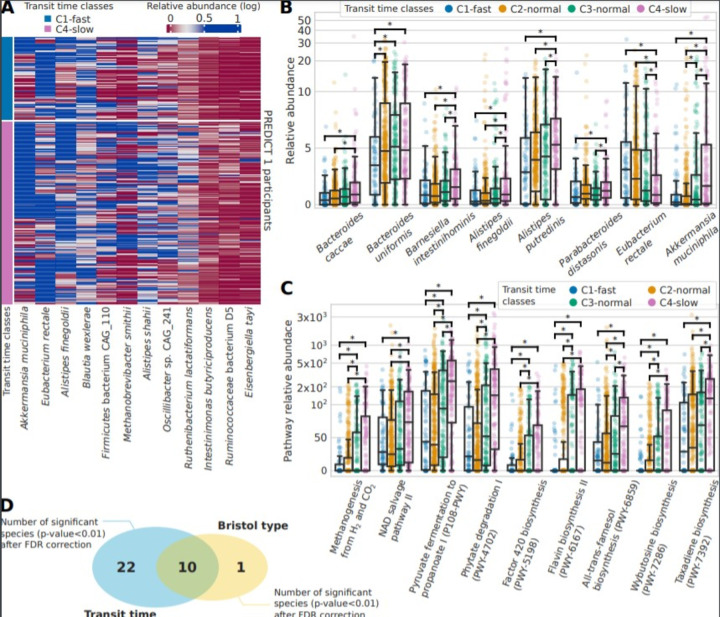
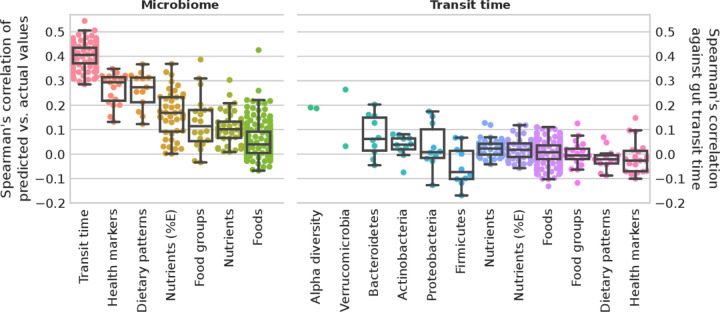
Results: We found that gut microbiome taxonomic composition can accurately discriminate between gut transit time classes (0.82 area under the receiver operating characteristic curve) and longer gut transit time is linked with specific microbial species such as Akkermansia muciniphila, Bacteroides spp and Alistipes spp (false discovery rate-adjusted p values <0.01). The blue dye measure of gut transit time had the strongest association with the gut microbiome over typical transit time proxies such as stool consistency and frequency.

Conclusions: Gut transit time, measured via the blue dye method, is a more informative marker of gut microbiome function than traditional measures of stool consistency and frequency. The blue dye method can be applied in large-scale epidemiological studies to advance diet-microbiome-health research. Clinical trial registry website https://clinicaltrials.gov/ct2/show/NCT03479866 and trial number NCT03479866.

Keywords: gastrointestinal transit; intestinal bacteria.


Conflict of interest statement

Competing interests: TDS, SB, FA, PF, AV, AC, ERL and NS are consultants to Zoe Global Ltd (“Zoe”). JW, GH, RD, HAK, LF and EB are or have been employees of Zoe. Other authors have no conflict of interest to declare. The study sponsors (Zoe Global Ltd; JW and GH) contributed as part of the Scientific Advisory Board for the PREDICT 1 study in the study design and collection. ED has received an education grant from Alpro, research funding from the British Dietetic Association, Almond Board of California, the International Nut and Dried Fruit Council and Nestec Ltd and has served as a consultant for Puratos. SB has received research funding from the Almond Board of California and from the Malaysian Palm Oil Board.

Figures

Figure 1
Figure 1
Gut transit time estimation in the PREDICT 1 cohort. (A) PREDICT 1 study design with focus on gut transit time (created by Biorender.com). (B) Histogram of the gut transit time distribution with orange vertical lines showing the boundaries of the four classes (C1: fast transit time; C2 and C3: normal gut transit time; C4: slow gut transit time). (C) Violin plots of the four gut transit time classes showing an average of 0.38, 1.02, 2.01 and 4.21 days for C1, C2, C3 and C4, respectively. An alternative visualisation using a semi-log scale is available in online supplemental figure 1A. (D) Distribution of gut transit time with respect to Bristol stool types and (E) with respect to the reported number of bowel movements in the week prior to the start of the PREDICT 1 study. Asterisks denote statistically significant differences according to the Mann-Whitney U test with a p value<0.01 and categories with less than 10 samples were not tested for significance.
Figure 2
Figure 2
Microbiome composition is a better predictor for gut transit time than Bristol Stool Form (BSF) scale and frequency of bowel movements. (A) Shannon alpha diversity distribution of the four gut transit time classes (statistically significant differences, p value<0.01, highlighted; see online supplemental figure 1B for alpha diversity measured as richness). (B) PCoA plot of Bray-Curtis pairwise distances of microbiome samples coloured according to the gut transit time class (see online supplemental table 2). (C) Receiver operating characteristic (ROC) curves showing the ability of a machine learning (ML) classifier in predicting the two extreme gut transit time classes: C1 versus C4 (area under the curve (AUC)=0.82) and when considering the two intermediate classes: C1 and C2 versus C3 and C4 (AUC=0.73). For comparison, the ROC curve in predicting the BSF types 1, 2 and 3 versus types 4, 5 and 6 is also shown (AUC=0.65). (D) ML classification matrix of gut transit time classes when using species relative abundances and functional pathways information (functional gene families reported in online supplemental figure 2A). (E) Alpha diversity measured with the Shannon index and the Bristol stool types (see online supplemental figure 1C for alpha diversity measured as richness). (F) Shannon alpha diversity bowel movements (see online supplemental figure 1D for alpha diversity measured as richness). (G) ML classification matrix of Bristol stool types using species and functional pathways relative abundances (functional gene families reported in online supplemental figure 2B and online supplemental figure 2C-D) for ML classification matrix for bowel movements.
Figure 3
Figure 3
Gut microbiome species and functional pathways associated with gut transit time. (A) Abundance across C1 and C4 gut transit time classes of the 12 differential significant species (p value<0.01 after false discovery Rate rate (FDR) correction) with an effect size of at least twofold. (B) Relative abundances for the four gut transit time classes for the biomarker species identified among the significant ones and with an average of at least 1% of relative abundance in PREDICT 1. (C) Relative abundances of the functional pathways found significant (FDR-adjusted p value<0.01) and with an effect size of at least twofold. (D) The significant species after FDR correction identified for gut transit time (32) and the Bristol Stool Form (BSF) scale (11), of which 10 are shared.
Figure 4
Figure 4
Microbiome profiles and gut transit time in predicting health markers and diet. Microbiome. Box plots of microbiome species relative abundances used to train a machine learning (ML) regression task to predict gut transit time (100-folds shown) and median for each marker for health markers, dietary patterns, nutrients (adjusted by energy intake and not), food groups and single foods. Gut transit time appears to be the better predictable outcome using microbiome species profiles than health markers and diet. Gut transit time. Box plots of the correlation of gut transit time with microbiome-related and diet-related markers. Gut transit time and microbiome-related markers include two alpha diversity measures (richness and Shannon), and up to the 10 most abundant species for each of the top five phyla according to their average relative abundances. Gut transit time and diet-related markers include single nutrients and energy-adjusted nutrients, single foods and foods organised into food groups according to the Plant-based Dietary Index, dietary indices and the 19 health markers used in the previous work to define the microbial cardiometabolic health signature. Box plots were removed for markers with less than 10 points.
Figure 5
Figure 5
Structural equation model to determine the relationship between the microbiome, gut transit time, diet and health measures. Blood pressure (mean of systolic and diastolic), inflammation (mean of fasting GlycA and IL-6), postprandial response (mean of peak glucose and triglyceride concentrations) and visceral fat. Model definitions, with boxes representing manifest nodes and arrows indicating regression coefficients pointing towards an outcome of regression (standardised beta value mentioned on each arrow only for significant associations (p value<0.05) except the link among exposures) (created by Biorender.com).

Comment in

References

    1. Cryan JF, O'Riordan KJ, Cowan CSM, et al. The microbiota-gut-brain axis. Physiol Rev 2019;99:1877–2013. 10.1152/physrev.00018.2018 - DOI - PubMed
    1. Rao SSC, Mysore K, Attaluri A, et al. Diagnostic utility of wireless motility capsule in gastrointestinal dysmotility. J Clin Gastroenterol 2011;45:684–90. 10.1097/MCG.0b013e3181ff0122 - DOI - PubMed
    1. Corsetti M, Costa M, Bassotti G, et al. First translational consensus on terminology and definitions of colonic motility in animals and humans studied by manometric and other techniques. Nat Rev Gastroenterol Hepatol 2019;16:559–79. 10.1038/s41575-019-0167-1 - DOI - PMC - PubMed
    1. Vandeputte D, Falony G, Vieira-Silva S, et al. Stool consistency is strongly associated with gut microbiota richness and composition, enterotypes and bacterial growth rates. Gut 2016;65:57–62. 10.1136/gutjnl-2015-309618 - DOI - PMC - PubMed
    1. Lu W-Z, Song G-H, Gwee K-A, et al. The effects of melatonin on colonic transit time in normal controls and IBS patients. Dig Dis Sci 2009;54:1087–93. 10.1007/s10620-008-0463-z - DOI - PubMed

Publication types

Supplementary concepts

Associated data