. 2021 Apr 1;148(7):dev199364.
doi: 10.1242/dev.199364. Epub 2021 Apr 15.

Myosin-X is dispensable for spindle morphogenesis and positioning in the mouse oocyte

Affiliations

Myosin-X is dispensable for spindle morphogenesis and positioning in the mouse oocyte

Flora Crozet et al. Development. .

Abstract

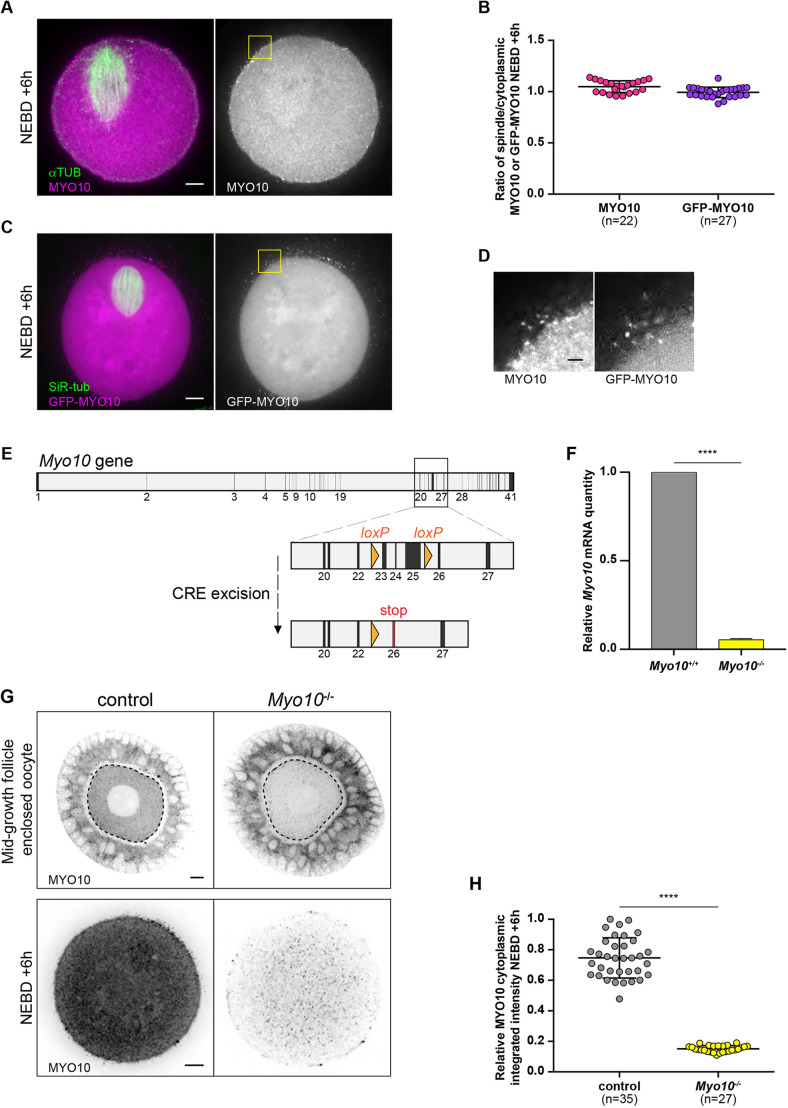
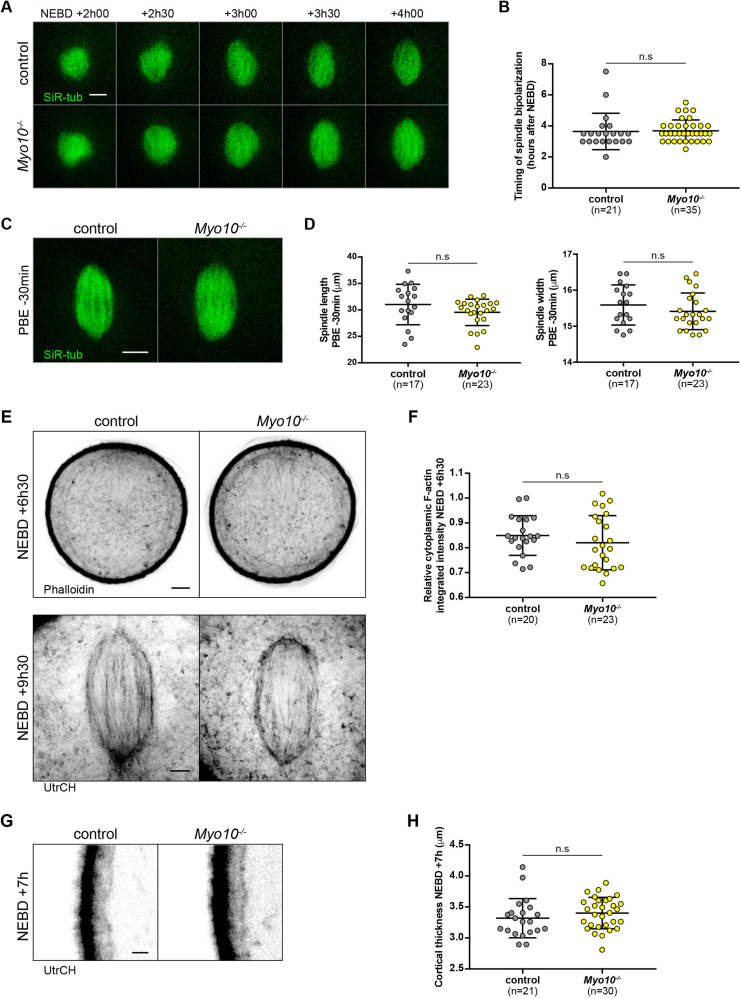
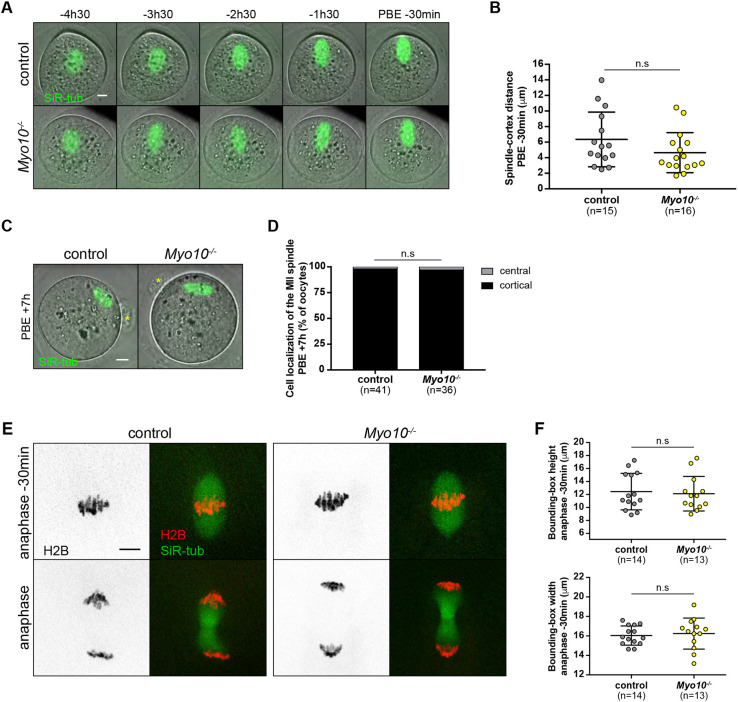
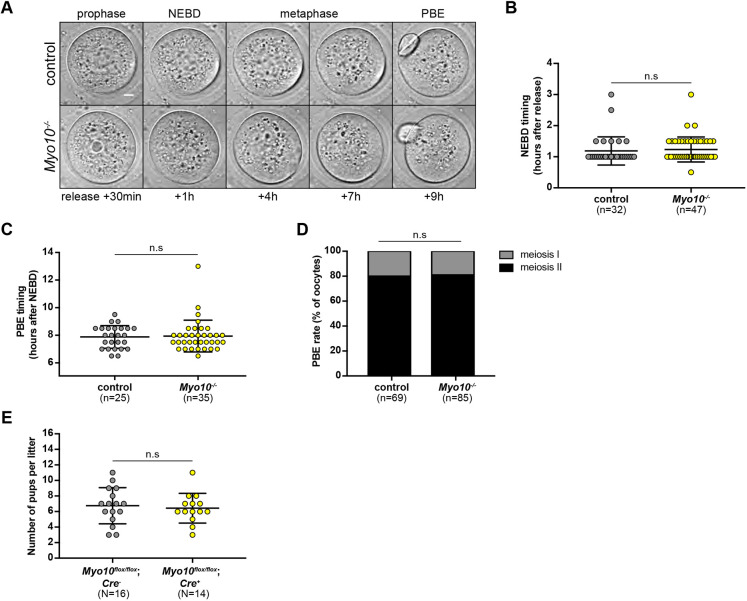
Off-center spindle positioning in mammalian oocytes enables asymmetric divisions in size, which are important for subsequent embryogenesis. The migration of the meiosis I spindle from the oocyte center to its cortex is mediated by F-actin. Specifically, an F-actin cage surrounds the microtubule spindle and applies forces to it. To better understand how F-actin transmits forces to the spindle, we studied a potential direct link between F-actin and microtubules. For this, we tested the implication of myosin-X, a known F-actin and microtubule binder involved in spindle morphogenesis and/or positioning in somatic cells, amphibian oocytes and embryos. Using a mouse strain conditionally invalidated for myosin-X in oocytes and by live-cell imaging, we show that myosin-X is not localized on the spindle, and is dispensable for spindle and F-actin assembly. It is not required for force transmission as spindle migration and chromosome alignment occur normally. More broadly, myosin-X is dispensable for oocyte developmental potential and female fertility. We therefore exclude a role for myosin-X in transmitting F-actin-mediated forces to the spindle, opening new perspectives regarding this mechanism in mouse oocytes, which differ from most mitotic cells.

Keywords: F-actin; Mouse oocyte; Myosin-X; Spindle positioning.


Conflict of interest statement

Competing interests The authors declare no competing or financial interests.

Figures

Fig. 1.
Fig. 1.
MYO10 does not accumulate at the meiosis I spindles. (A) Confocal spinning disk images of an oocyte fixed at NEBD+6 h stained for α-tubulin (αTUB) and myosin-X (MYO10). Left, merge of αTUB (green) and MYO10 (magenta) staining. Right, MYO10 staining only. Scale bar: 10 µm. (B) Scatter plot representing the ratio of spindle and cytoplasmic MYO10 fluorescence intensities at NEBD+6 h in fixed oocytes labeled with MYO10 and αTUB (pink), and in live oocytes expressing GFP-MYO10 and incubated with SiR-tubulin (purple). n is the number of oocytes analyzed. Data are from three (fixed oocytes) and two (live oocytes) independent experiments. Data are mean and s.d. with individual data points plotted. (C) Confocal spinning disk images of an oocyte at NEBD+6 h microinjected with GFP-MYO10 and incubated with SiR-tubulin (SiR-tub) to label the microtubules. Left, merge of SiR-tub (green) and GFP-MYO10 (magenta) staining. Right, GFP-MYO10 staining only. Scale bar: 10 µm. (D) Confocal spinning disk images showing cortical/membrane foci of endogenous (left) and exogenous (right) MYO10. Images corresponding to the areas outlined with yellow squares in A and C. Scale bar: 2 µm. (E) Cre-loxP-mediated depletion of MYO10 in oocytes. The Myo10 gene with exons in black and introns in gray based on the Ensembl database. loxP sites, shown as orange triangles, flank exons 23 to 25. Zp3-mediated CRE expression in oocytes allows Myo10 excision at the loxP sites. The depletion of exons 23-25 leads to a frame-shift and the appearance of a stop codon at exon 26. (F) Bar chart representing Myo10 mRNA levels in Myo10−/− oocytes (from Myo10flox/flox; Cre+ female mice, yellow) relative to Myo10+/+ oocytes (from Myo10flox/flox; Cre female mice, gray). Myo10+/+ normalized mean=1. Myo10−/− normalized mean=0.05±0.005 (normalized s.e.m.). RT-qPCRs were performed on two biological replicates using 30 oocytes for each condition from two females; two technical replicates were carried out. The statistical significance of the differences was assessed with a two-tailed unpaired t-test, ****P<0.0001. Error bar for the Myo10−/− group represents s.e.m. (G) Confocal spinning disk images of fixed oocytes at mid-growth surrounded by granulosa cells (granulosa-oocyte complexes, upper images) and fully grown oocytes fixed at NEBD+6 h (lower images) stained for MYO10. Controls are on the left and Myo10−/− oocytes on the right. The black dotted lines delimit the oocytes in the complexes. The images show the equatorial plane of the oocytes. Scale bars: 10 µm. (H) Scatter plots of the relative integrated intensities of cytoplasmic MYO10 labeling observed at NEBD+6 h in control (gray) and Myo10−/− (yellow) oocytes. n is the number of oocytes analyzed. Data are from three independent experiments. Data are mean±s.d. with individual data points plotted. The statistical significance of the differences was assessed with a two-tailed unpaired t-test with Welch's correction, ****P<0.0001.
Fig. 2.
Fig. 2.
Meiosis I spindles and F-actin networks are properly formed in Myo10−/− oocytes. (A) Stills from time-lapse spinning disk movies showing microtubules labeled with SiR-tub (green) forming a ball that progressively bipolarizes to form the meiosis I spindle in a control (upper images) and a Myo10−/− (lower images) oocyte. Scale bar: 10 µm. (B) Scatter plots of the timings of spindle bipolarization (hours after NEBD) in control (gray) and Myo10−/− (yellow) oocytes. n is the number of oocytes analyzed. Data are from three independent experiments (mean±s.d. with individual data points plotted). The statistical significance of the differences was assessed with a two-tailed Mann-Whitney test, P=0.2948. (C) Confocal spinning disk images of a control (left) and a Myo10−/− (right) spindle 30 min before polar body extrusion (PBE) labeled with SiR-tub (green). Scale bar: 10 µm. (D) Scatter plots of spindle length (left chart) and width (right chart) 30 min before PBE in control (gray) and Myo10−/− (yellow) oocytes. n is the number of oocytes analyzed. Data are from five independent experiments (mean±s.d. with individual data points plotted). The statistical significance of the differences was assessed with a two-tailed Mann-Whitney test, P=0.1053 for the length and with a two-tailed unpaired t-test, P=0.2995 for the width. (E) The upper images are oocytes fixed at NEBD+6 h30 showing cytoplasmic F-actin meshes labeled with phalloidin. The images correspond to the equatorial plane of the oocytes. Left, control; right, Myo10−/−. Scale bar: 10 µm. The lower images are confocal spinning disk images of oocytes at NEBD+9 h30 microinjected with GFP-UtrCH (UtrCH) showing actin cages in control (left) and Myo10−/− (right) oocytes. Scale bar: 5 µm. (F) Scatter plots of the relative integrated cytoplasmic intensity from the labeling with phalloidin at NEBD+6 h30 in control (gray) and Myo10−/ (yellow) oocytes. n is the number of oocytes analyzed. Data are from four independent experiments (mean±s.d. with individual data points plotted). The statistical significance of the differences was assessed with a two-tailed unpaired t-test, P=0.3315. (G) Confocal spinning disk images focused on the equatorial plane cortex of a control (left) and a Myo10−/− (right) oocyte microinjected with UtrCH at NEBD+7 h. Scale bar: 2 µm. (H) Scatter plots of the measure of cortex thickness at NEBD+7 h in control (gray) and Myo10−/ (yellow) oocytes. n is the number of oocytes analyzed. Data are from two independent experiments (mean±s.d. with individual data points plotted). The statistical significance of the differences was assessed with a two-tailed Mann-Whitney test, P=0.1322.
Fig. 3.
Fig. 3.
Force transmission to the spindle and chromosomes is unaffected by MYO10 depletion. (A) Stills from time-lapse spinning disk movies showing meiosis I spindles labeled with SiR-tub (green) merged to their corresponding bright-field images. Control oocyte in upper images, Myo10−/− in lower images. Scale bar: 10 µm. (B) Scatter plots of the distance between the leading spindle pole and the cortex 30 min before polar body extrusion (PBE) in control (gray) and Myo10−/− (yellow) oocytes. n is the number of oocytes analyzed. Data are from five independent experiment (mean±s.d. with individual data points plotted). The statistical significance of the differences was assessed with a two-tailed unpaired t-test, P=0.1332. (C) Confocal spinning disk images showing the meiosis II spindles 7 h after the first polar body extrusion (PBE) labeled with SiR-tub (green) and merged to their corresponding bright-field images. The control oocyte is on the left; the Myo10−/− oocyte on the right. The yellow asterisks indicate the first polar bodies. Scale bar: 10 µm. (D) Stacked bars of the cell localization of the meiosis II (MII) spindles as a percentage of the oocytes. Gray indicates the meiosis II spindles centrally located in the metaphase II-arrested oocytes; black indicates the meiosis II spindles anchored to the cortex. n is the number of oocytes analyzed. The data are from seven independent experiments. The statistical significance of the differences was assessed with a two-sided Fisher's exact test, P>0.9999. (E) Stills from time-lapse spinning disk movies showing meiosis I chromosome alignment (upper images, 30 min before anaphase) and segregation (lower images, anaphase) in control (left panel) and Myo10−/− (right panel) oocytes. Oocytes were microinjected with H2B-RFP (H2B, black or red) and incubated with SiR-tub (green). Scale bar: 10 µm. (F) Scatter plots of the height (upper chart) and the width (lower chart) of the bounding boxes framing the chromosomes 30 min before anaphase in control (gray) and Myo10−/− (yellow) oocytes. n is the number of oocytes analyzed. Data are from three independent experiments (mean±s.d. with individual data points plotted). The statistical significance of the differences was assessed with a two-tailed unpaired t-test, P=0.7601 for the height and P=0.6903 for the width.
Fig. 4.
Fig. 4.
MYO10 is dispensable for oocyte developmental potential and female fertility. (A) Stills from time-lapse spinning disk movies of a control (upper images) and a Myo10−/− oocyte (lower images) starting 30 min after release of the prophase block until polar body extrusion (PBE). Scale bar: 10 µm. (B) Scatter-plot of NEBD timing (hours after release) of control (gray) and Myo10−/− (yellow) oocytes. n is the number of oocytes analyzed. Data are from three independent experiments (mean±s.d. with individual data points plotted). The statistical significance of the differences was assessed with a two-tailed Mann-Whitney test, P=0.2275. (C) Scatter plot of polar body extrusion (PBE) timing (hours after NEBD) of control (gray) and Myo10−/− (yellow) oocytes. n is the number of oocytes analyzed. Data are from three independent experiments (mean±s.d. with individual data points plotted). The statistical significance of the differences was assessed with a two-tailed Mann–Whitney test, P=0.6907. (D) Stacked bars of the rate of polar body extrusion (PBE) as a percentage of oocytes. Gray, oocytes arrested in meiosis I that have not extruded a polar body; black, oocytes that have extruded a polar body and are arrested in meiosis II. n is the number of oocytes analyzed. Data are from three independent experiments. The statistical significance of the differences was assessed with a two-sided Fisher's exact test, P=0.8404. (E) Scatter plots of the number of pups per litter from Myo10flox/flox; Cre female mice (control, gray) and Myo10flox/flox; Cre+ female mice (carrying Myo10−/− oocytes, yellow). N is the number of litters analyzed, from four (Myo10flox/flox; Cre) and five (Myo10flox/flox; Cre+) independent couplings. Data are mean±s.d. with individual data points plotted. The statistical significance of the differences was assessed with a two-tailed unpaired t-test, P=0.6848.

Similar articles

Cited by

References

    1. Azoury, J., Lee, K. W., Georget, V., Rassinier, P., Leader, B. and Verlhac, M.-H. (2008). Spindle positioning in mouse oocytes relies on a dynamic meshwork of actin filaments. Curr. Biol. 18, 1514-1519. 10.1016/j.cub.2008.08.044 - DOI - PubMed
    1. Bennabi, I., Terret, M.-E. and Verlhac, M.-H. (2016). Meiotic spindle assembly and chromosome segregation in oocytes. J. Cell Biol. 215, 611-619. 10.1083/jcb.201607062 - DOI - PMC - PubMed
    1. Bennabi, I., Crozet, F., Nikalayevich, E., Chaigne, A., Letort, G., Manil-Ségalen, M., Campillo, C., Cadart, C., Othmani, A., Attia, R.et al. (2020). Artificially decreasing cortical tension generates aneuploidy in mouse oocytes. Nat. Commun. 11, 1649. 10.1038/s41467-020-15470-y - DOI - PMC - PubMed
    1. Berg, J. S., Derfler, B. H., Pennisi, C. M., Corey, D. P. and Cheney, R. E. (2000). Myosin-X, a novel myosin with pleckstrin homology domains, associates with regions of dynamic actin. J. Cell Sci. 113, 3439-3451. - PubMed
    1. Brieño-Enríquez, M. A., Moak, S. L., Holloway, J. K. and Cohen, P. E. (2017). NIMA-related kinase 1 (NEK1) regulates meiosis I spindle assembly by altering the balance between α-Adducin and Myosin X. PLoS ONE 12, e0185780. 10.1371/journal.pone.0185780 - DOI - PMC - PubMed

Publication types

LinkOut - more resources