. 2021 Apr;31(4):732-744.
doi: 10.1101/gr.267336.120. Epub 2021 Mar 15.

Transcription initiation mapping in 31 bovine tissues reveals complex promoter activity, pervasive transcription, and tissue-specific promoter usage

Affiliations

Transcription initiation mapping in 31 bovine tissues reveals complex promoter activity, pervasive transcription, and tissue-specific promoter usage

Daniel E Goszczynski et al. Genome Res. 2021 Apr.

Abstract

Characterizing transcription start sites is essential for understanding the regulatory mechanisms that control gene expression. Recently, a new bovine genome assembly (ARS-UCD1.2) with high continuity, accuracy, and completeness was released; however, the functional annotation of the bovine genome lacks precise transcription start sites and contains a low number of transcripts in comparison to human and mouse. By using the RAMPAGE approach, this study identified transcription start sites at high resolution in a large collection of bovine tissues. We found several known and novel transcription start sites attributed to promoters of protein-coding and lncRNA genes that were validated through experimental and in silico evidence. With these findings, the annotation of transcription start sites in cattle reached a level comparable to the mouse and human genome annotations. In addition, we identified and characterized transcription start sites for antisense transcripts derived from bidirectional promoters, potential lncRNAs, mRNAs, and pre-miRNAs. We also analyzed the quantitative aspects of RAMPAGE to produce a promoter activity atlas, reaching highly reproducible results comparable to traditional RNA-seq. Coexpression networks revealed considerable use of tissue-specific promoters, especially between brain and testicle, which expressed several genes in common from alternate loci. Furthermore, regions surrounding coexpressed modules were enriched in binding factor motifs representative of each tissue. The comprehensive annotation of promoters in such a large collection of tissues will substantially contribute to our understanding of gene expression in cattle and other mammalian species, shortening the gap between genotypes and phenotypes.


Figures

Figure 1.
Figure 1.
Identification of promoters by RAMPAGE. (A) Tag coverage in TSCs identified in the combined data set. (B) TSC size distribution for the whole data set. (C) Histogram of the distance between TSCs and their nearest annotated TSS. (D) Histogram of the distance between TSC and the nearest annotated TTS. (E) Histogram of the distance between TSCs and intron–exon boundaries. Only intron–exon boundaries not overlapping with any annotated TSSs were considered. (F) Histogram of the distance between TSCs and exon–intron boundaries. For visualization, exon–intron boundaries corresponding to the end of the first exon were ignored, as TSCs tended to group immediately upstream of these boundaries and interfere with the visualization.
Figure 2.
Figure 2.
Genic TSCs identified by RAMPAGE sequencing. (A) Location of genic TSCs according to gene annotations. (B) Histogram of TSC size. (C) Use of multiple TSCs for the same gene. Genes with more than 10 TSCs were excluded from the plot as they were likely affected by technical artifacts.
Figure 3.
Figure 3.
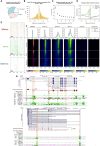
Novel promoters identified by RAMPAGE. (A) Location of novel TSCs according to gene annotations. (B) Histogram of the distance between novel TSCs and annotated TSCs. (C) Relative expression of novel TSCs. (D) Profiles of motif occurrence for TATA-, CCAAT-, and GC-boxes around novel TSCs (±200 bp). (E) Motif density maps for TATA-, CCAAT-, and GC-boxes around novel TSCs (±200 bp). TSCs are ordered ascendingly by size; that is, upper rows represent narrow TSCs. The zero coordinate represents the 5′-end of the TSC. Narrow TSCs were particularly enriched with TATA-box motifs and broad TSCs were enriched with GC-box motifs. (F) Epigenetic marks at reported and novel TSCs. The co-occurrence of chromatin accessibility and transcriptional activation marks (H3K4me3, H3K27ac) at novel TSCs, as well as the absence of poised enhancer and repressive marks (H3K4me1, H3K27me3), suggested these TSCs constituted promoter regions. The fuzzy signal observed around the closest annotated TSSs evidenced the absence of annotation for these novel elements. The data shown in the figure correspond to the lung-M2 sample (>3 CPM). Heatmaps are colored according to CPM values. (G) Novel TSCs for the LIPE and CREM genes. Most of the new variants are supported by annotations from other species. Antisense TSCs were marked with blue to distinguish them from sense TSCs (orange).
Figure 4.
Figure 4.
Identification of unassigned TSCs through bioinformatic approaches. (A) Distance between unassigned TSCs and their nearest genic TSCs. A high number of elements localized within 500 bp upstream of genic TSCs but on the opposite strand. (B) Correlation of expression from antisense TSCs (CPM > 3) with expression from sense TSCs. (C) Expression of the antisense variant (CPM > 3) relative to the sense variant. (D) Putative roles attributed to unassigned TSCs.
Figure 5.
Figure 5.
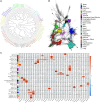
Promoter activity detected in 31 cattle tissues by RAMPAGE. (A) Sample dendrogram based on RAMPAGE signal. Samples grouped according to tissue, system, and higher-order structures. (B) TSC-to-TSC network generated based on Pearson's correlations. This network shows the diversity of tissue-specific promoters in our data set. Figure was generated using a minimum correlation of 0.75 in the Graphia v2.0 software (Freeman et al. 2020). (C) Modules of coexpressed TSCs indicating Pearson's correlations to each tissue and P-values. To validate the RAMPAGE signal from a quantitative perspective, we compared RAMPAGE counts to conventional RNA-seq gene counts in seven tissues from the same two male individuals. Estimates of gene expression by RAMPAGE were highly reproducible between biological replicates (average Pearson's R = 0.94, SD = 0.03) (Supplemental Table S4, Supplemental Fig. S9), consistent with the reproducibility of conventional RNA-seq (average Pearson's R = 0.98, SD = 0.01) (Supplemental Fig. S10). Absolute quantification of gene expression was comparable between the two techniques (average Pearson's R = 0.76, SD = 0.03) (Supplemental Figs. S11, S12), and detection of differentially expressed genes was strongly correlated between RNA-seq and RAMPAGE (average Pearson's R = 0.9, SD = 0.05) (Supplemental Fig. S13). Overall, these results suggest slight differences in global transcriptome measurement by RAMPAGE and RNA-seq, although both assays captured highly similar levels of differential gene expression.
Figure 6.
Figure 6.
Usage of promoters across bovine tissues. (A) Correlation between pairs of alternative TSCs from the same gene (>5 CPM). Alternative TSCs were generally independent from each other. (B) Usage of TSCs across tissues. Most of the TSCs were expressed in only one or a few tissues, whereas about 6000 TSCs were ubiquitously expressed. (C) Use of alternative TSCs between pairs of tissues. Sphere size represents the number of TSC members in the module, and edge thickness represents the number of common genes expressed from alternative (tissue-specific) TSCs. (D,E) Examples of tissue-specific promoters in brain and testis. The GABRG2 and GABRA1 genes are members of the GABAergic synapse pathway.

Similar articles

  • Genome-wide identification of tissue-specific long non-coding RNA in three farm animal species.
    Kern C, Wang Y, Chitwood J, Korf I, Delany M, Cheng H, Medrano JF, Van Eenennaam AL, Ernst C, Ross P, Zhou H. Kern C, et al. BMC Genomics. 2018 Sep 18;19(1):684. doi: 10.1186/s12864-018-5037-7. BMC Genomics. 2018. PMID: 30227846 Free PMC article.
  • A promoter-level mammalian expression atlas.
    FANTOM Consortium and the RIKEN PMI and CLST (DGT); Forrest AR, Kawaji H, Rehli M, Baillie JK, de Hoon MJ, Haberle V, Lassmann T, Kulakovskiy IV, Lizio M, Itoh M, Andersson R, Mungall CJ, Meehan TF, Schmeier S, Bertin N, Jørgensen M, Dimont E, Arner E, Schmidl C, Schaefer U, Medvedeva YA, Plessy C, Vitezic M, Severin J, Semple C, Ishizu Y, Young RS, Francescatto M, Alam I, Albanese D, Altschuler GM, Arakawa T, Archer JA, Arner P, Babina M, Rennie S, Balwierz PJ, Beckhouse AG, Pradhan-Bhatt S, Blake JA, Blumenthal A, Bodega B, Bonetti A, Briggs J, Brombacher F, Burroughs AM, Califano A, Cannistraci CV, Carbajo D, Chen Y, Chierici M, Ciani Y, Clevers HC, Dalla E, Davis CA, Detmar M, Diehl AD, Dohi T, Drabløs F, Edge AS, Edinger M, Ekwall K, Endoh M, Enomoto H, Fagiolini M, Fairbairn L, Fang H, Farach-Carson MC, Faulkner GJ, Favorov AV, Fisher ME, Frith MC, Fujita R, Fukuda S, Furlanello C, Furino M, Furusawa J, Geijtenbeek TB, Gibson AP, Gingeras T, Goldowitz D, Gough J, Guhl S, Guler R, Gustincich S, Ha TJ, Hamaguchi M, Hara M, Harbers M, Harshbarger J, Hasegawa A, Hasegawa Y, Hashimoto T, Herlyn M, Hitchens KJ, Ho Sui SJ, Hofmann OM, Hoof I, Hori F, Huminiecki L, Iida K, Ikawa T, … See abstract for full author list ➔ FANTOM Consortium and the RIKEN PMI and CLST (DGT), et al. Nature. 2014 Mar 27;507(7493):462-70. doi: 10.1038/nature13182. Nature. 2014. PMID: 24670764 Free PMC article.
  • Antisense Transcription in Loci Associated to Hereditary Neurodegenerative Diseases.
    Zucchelli S, Fedele S, Vatta P, Calligaris R, Heutink P, Rizzu P, Itoh M, Persichetti F, Santoro C, Kawaji H, Lassmann T, Hayashizaki Y, Carninci P, Forrest ARR; FANTOM Consortium; Gustincich S. Zucchelli S, et al. Mol Neurobiol. 2019 Aug;56(8):5392-5415. doi: 10.1007/s12035-018-1465-2. Epub 2019 Jan 4. Mol Neurobiol. 2019. PMID: 30610612 Free PMC article.
  • Expression Specificity of Disease-Associated lncRNAs: Toward Personalized Medicine.
    Nguyen Q, Carninci P. Nguyen Q, et al. Curr Top Microbiol Immunol. 2016;394:237-58. doi: 10.1007/82_2015_464. Curr Top Microbiol Immunol. 2016. PMID: 26318140 Review.
  • The human CYP19 (aromatase P450) gene: update on physiologic roles and genomic organization of promoters.
    Bulun SE, Sebastian S, Takayama K, Suzuki T, Sasano H, Shozu M. Bulun SE, et al. J Steroid Biochem Mol Biol. 2003 Sep;86(3-5):219-24. doi: 10.1016/s0960-0760(03)00359-5. J Steroid Biochem Mol Biol. 2003. PMID: 14623514 Review.

Cited by

References

    1. Abugessaisa I, Noguchi S, Hasegawa A, Kondo A, Kawaji H, Carninci P, Kasukawa T. 2019. refTSS: a reference data set for human and mouse transcription start sites. J Mol Biol 431: 2407–2422. 10.1016/j.jmb.2019.04.045 - DOI - PubMed
    1. Adiconis X, Haber AL, Simmons SK, Levy Moonshine A, Ji Z, Busby MA, Shi X, Jacques J, Lancaster MA, Pan JQ, et al. 2018. Comprehensive comparative analysis of 5′-end RNA-sequencing methods. Nat Methods 15: 505–511. 10.1038/s41592-018-0014-2 - DOI - PMC - PubMed
    1. Affymetrix/Cold Spring Harbor Laboratory ENCODE Transcriptome Project. 2009. Post-transcriptional processing generates a diversity of 5′-modified long and short RNAs. Nature 457: 1028–1032. 10.1038/nature07759 - DOI - PMC - PubMed
    1. Alles J, Fehlmann T, Fischer U, Backes C, Galata V, Minet M, Hart M, Abu-Halima M, Grässer FA, Lenhof H-P, et al. 2019. An estimate of the total number of true human miRNAs. Nucleic Acids Res 47: 3353–3364. 10.1093/nar/gkz097 - DOI - PMC - PubMed
    1. Batut P, Gingeras TR. 2013. RAMPAGE: promoter activity profiling by paired-end sequencing of 5′-complete cDNAs. Curr Protoc Mol Biol 104: Unit-25B.11. 10.1002/0471142727.mb25b11s104 - DOI - PMC - PubMed

Publication types