. 2021 Apr;31(4):645-658.
doi: 10.1101/gr.268110.120. Epub 2021 Mar 15.

Subgenomic RNA identification in SARS-CoV-2 genomic sequencing data

Affiliations

Subgenomic RNA identification in SARS-CoV-2 genomic sequencing data

Matthew D Parker et al. Genome Res. 2021 Apr.

Abstract

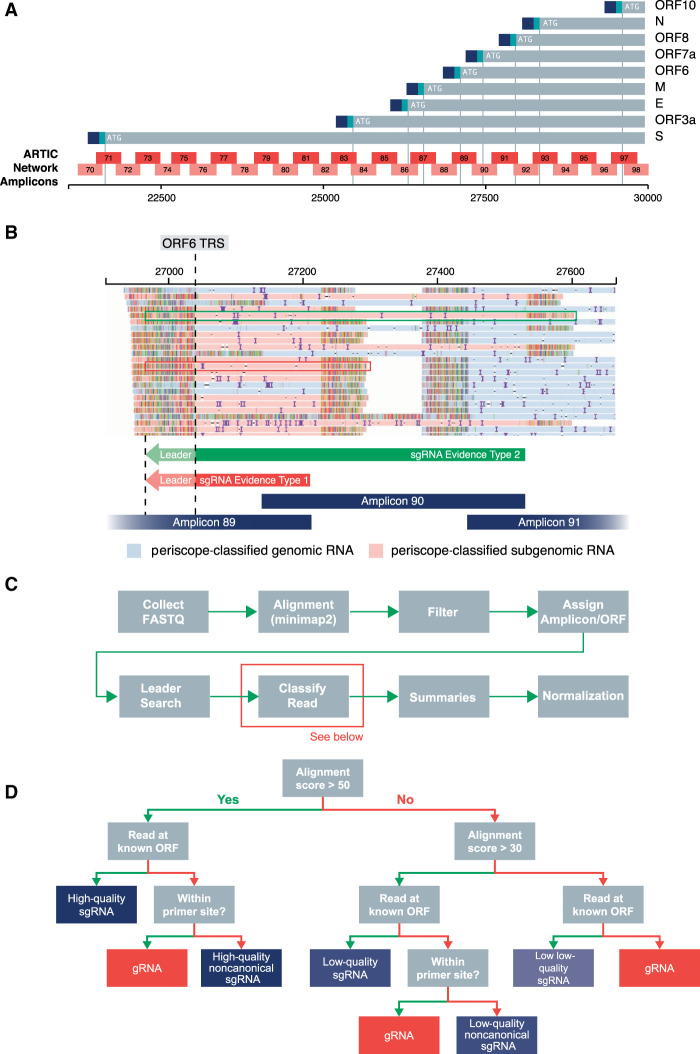
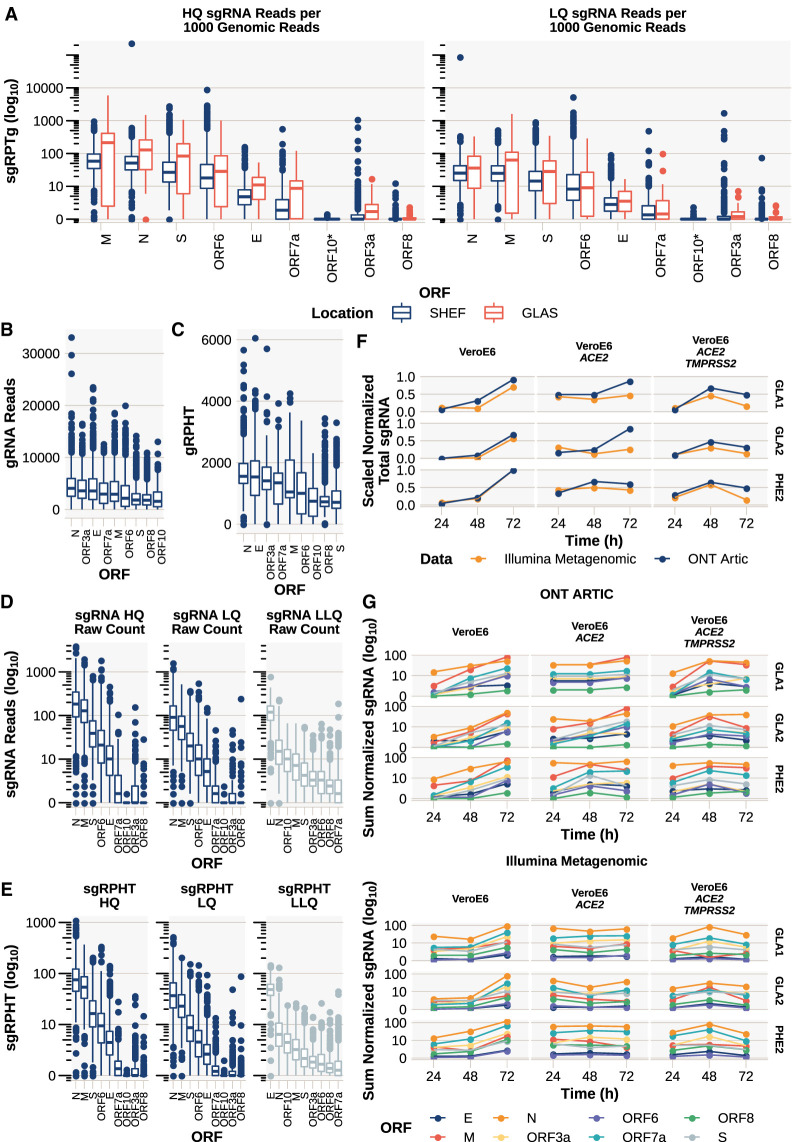
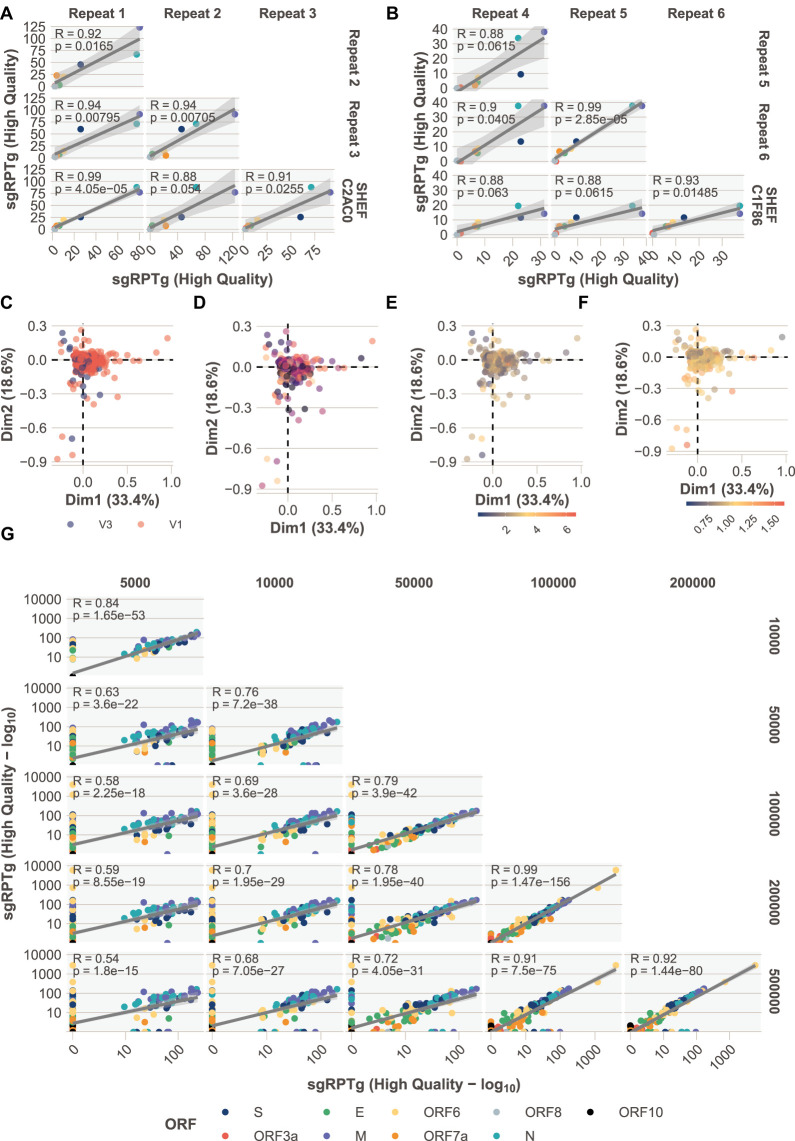
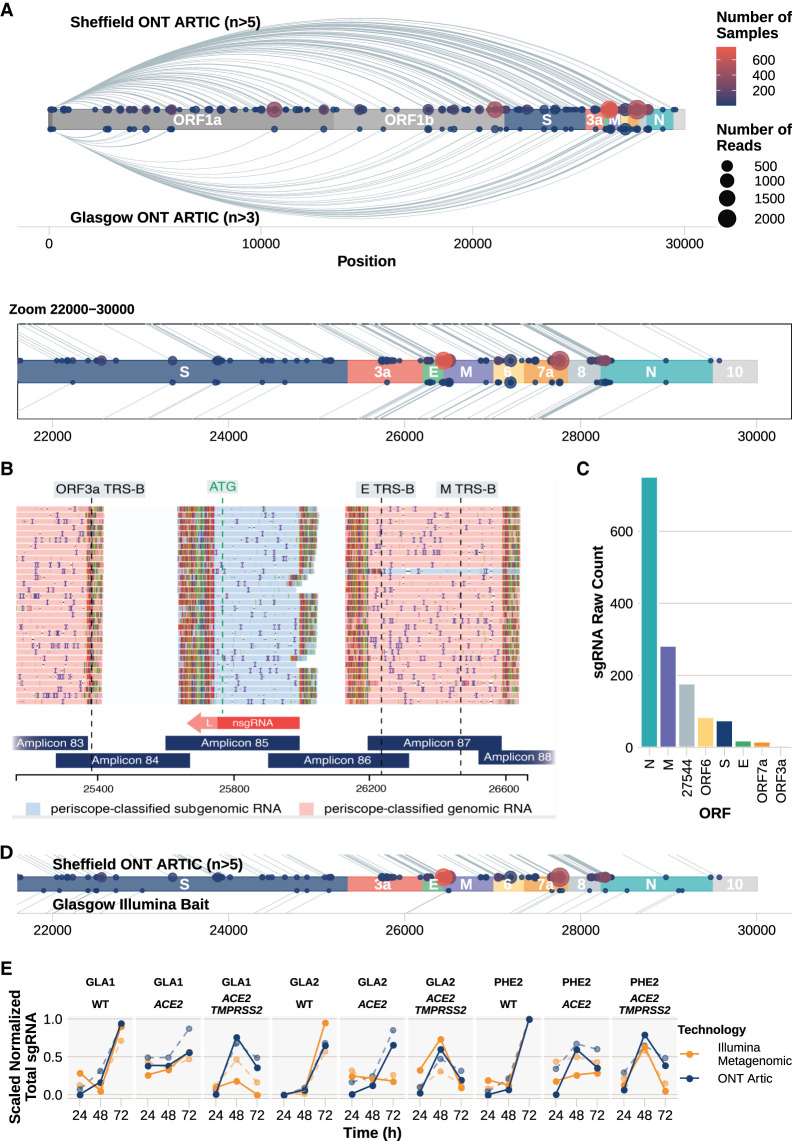
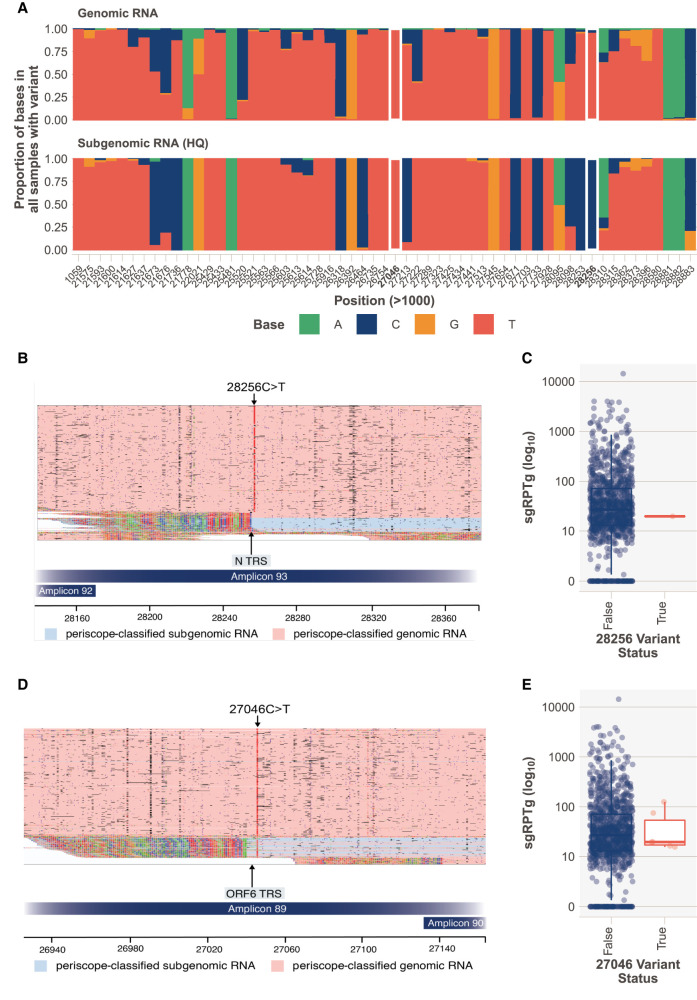
We have developed periscope, a tool for the detection and quantification of subgenomic RNA (sgRNA) in SARS-CoV-2 genomic sequence data. The translation of the SARS-CoV-2 RNA genome for most open reading frames (ORFs) occurs via RNA intermediates termed "subgenomic RNAs." sgRNAs are produced through discontinuous transcription, which relies on homology between transcription regulatory sequences (TRS-B) upstream of the ORF start codons and that of the TRS-L, which is located in the 5' UTR. TRS-L is immediately preceded by a leader sequence. This leader sequence is therefore found at the 5' end of all sgRNA. We applied periscope to 1155 SARS-CoV-2 genomes from Sheffield, United Kingdom, and validated our findings using orthogonal data sets and in vitro cell systems. By using a simple local alignment to detect reads that contain the leader sequence, we were able to identify and quantify reads arising from canonical and noncanonical sgRNA. We were able to detect all canonical sgRNAs at the expected abundances, with the exception of ORF10. A number of recurrent noncanonical sgRNAs are detected. We show that the results are reproducible using technical replicates and determine the optimum number of reads for sgRNA analysis. In VeroE6 ACE2+/- cell lines, periscope can detect the changes in the kinetics of sgRNA in orthogonal sequencing data sets. Finally, variants found in genomic RNA are transmitted to sgRNAs with high fidelity in most cases. This tool can be applied to all sequenced COVID-19 samples worldwide to provide comprehensive analysis of SARS-CoV-2 sgRNA.


Figures

Figure 1.
Figure 1.
The periscope ARTIC Nanopore algorithm design details. (A) ARTIC network amplicon layout with respect to ORF TRS positions of SARS-CoV-2. Blue and aqua at the end of each ORF signifies leader and TRS, respectively. (B) Read pileup at ORF6 TRS showing two types of reads that support the existence of sgRNAs. Type 1 (red) is results from 3′→5′ amplification from the closest primer to the 3′ of the TRS site, and type 2 (green) is results from 3′→5′ amplification from the adjacent amplicons 3′ primer (i.e., the second closest 3′ primer). (C) Overview of the periscope workflow. (D) Decision tree for read classification. Green arrow denotes a “yes” for the step-in question; namely, if the read is at a known ORF start site, a green arrow is used; if not, a red arrow for “no” is used.
Figure 2.
Figure 2.
In vivo and in vitro detection and quantification of canonical sgRNA in SARS-CoV-2. (A) The abundance of sgRNA detected for each ORF normalized per 1000 gRNAs from Oxford Nanopore Technologies (ONT) ARTIC data from both Sheffield (n = 1155) (Supplemental File S1) and Glasgow (n = 55) (Supplemental File S7). (sgRPTg) sgRNA reads per 1000 gRNA reads. Ordered by median. See Supplemental Figure S3 for ORF10 investigation. (B) Number of reads supporting gRNA at each ORF. If multiple amplicons cover the ORF, then this represents the sum of reads for those amplicons. (C) gRNA reads normalized per 100,000 mapped reads (gRPHT) at each ORF. (D) Raw counts of sgRNAs. (E) sgRNA normalized to total mapped reads. (sgRPHT) sgRNA reads per 100,000 mapped reads. (F,G) In vitro infection time course with three SARS-CoV-2 viral isolates (GLA1, GLA2, and PHE2) in either VeroE6 cells, VeroE6 expressing ACE2, or VeroE6 expressing ACE2 and TMPRSS2, with total RNA collected and sequenced at 24, 48, and 72 h after infection, sequenced using either ONT ARTIC (Supplemental File S6) or Illumina Metagenomic approaches (Supplemental File S5). (F) The sum of all normalized (to total mapped reads to allow direct comparison across ONT ARTIC and Illumina Metagenomic methods) sgRNA in each technology scaled to one. (G) Normalized quantity (to total mapped reads) of each canonical sgRNA in each technology. (Top) ONT ARTIC; (bottom) Illumina Metagenomic.
Figure 3.
Figure 3.
Technical replicates, detection limit, and batch effects. (A,B) Four technical replicates of two samples additional to the Sheffield cohort (Supplemental File S4). Pearson correlation coefficients between sgRPTg P-values adjusted with Bonferroni correction. (ORFs colored according to legend in G.) (CF) Unsupervised principal component analysis (Supplemental File S8) colored by ARTIC primer version V1 or V3 (C), sequencing run (D) where the color denotes a different run, total mapped read count (scale = 100,000 reads; E), or normalized E gene cycle threshold (Ct) value (F). (G) Downsampling of reads from 23 high-coverage (more than 1 million mapped reads) (Supplemental File S3) samples. The number of reads provided as input to periscope was downsampled with seqtk to 5, 10, 50, 100, 200, and 500 thousand reads.
Figure 4.
Figure 4.
Noncanonical sgRNA. We classified reads as supporting noncanonical sgRNA as described in Figure 1D (Supplemental File S2). (A) Plot showing the number of samples with each noncanonical sgRNA detected in the ARTIC Nanopore data. Size of the point represents the number of reads, and the color indicates the number of samples in which noncanonical sgRNA was found. Lines connecting points represent the sgRNA product of discontinuous transcription. Those detected in Sheffield samples are above the genome schematic; in Glasgow, below. (Inset) Zoomed-in region between nucleotides 22,000 and 30,000. (B) Noncanonical sgRNA with strong support in SHEF-C0118 at position 25,744. (C) Raw sgRNA levels (HQ and LQ) in SHEF-C0118 show high relative amounts of this noncanonical sgRNA at position 25,744. (D) Zoomed-in region between nucleotides 22,000 and 30,000 of the SARS-Cov-2 genome, showing noncanonical sgRNA in the Sheffield ONT data set (top) compared with the noncanonical sgRNA detected in the Illumina bait capture data from Glasgow (Supplemental File S11). (E) Noncanonical sgRNA levels (solid lines) compared with canonical (dashed lines) in an in vitro model of SARS-CoV-2 infection measured with both Illumina metagenomic sequencing (orange) and ONT Artic (blue). Total sgRNA levels are normalized per 100,000 mapped reads and scaled within each data set for comparison.
Figure 5.
Figure 5.
Variants in sgRNA. (A) Base frequencies at each of the variant positions called by ARTIC in each sample (multiple samples can be represented at one position), split by read class. White rectangles represent variants detailed in B and C. (B) SHEF-C0F96 has a 28,256C > T variant, of high quality that sits in the ORF N TRS sequence. This variant is not present in sgreads. (C) Normalized sgRNA expression (sgRPTg) for the N ORF in samples with the variant and without. N expression is one of the lowest in the cohort. (D) SHEF-C0C35 has 27,046C > T variant of high quality that sits in the TRS sequence. This variant is present in both gRNA and sgRNA. (E) ORF6 expression levels in samples with 27046C > T.

References

    1. Alexandersen S, Chamings A, Bhatta TR. 2020. SARS-CoV-2 genomic and subgenomic RNAs in diagnostic samples are not an indicator of active replication. Nat Commun 11: 6059. 10.1038/s41467-020-19883-7 - DOI - PMC - PubMed
    1. The Artic Network. 2020. Artic Network. https://artic.network/ncov-2019 [accessed November 5, 2020].
    1. Bouhaddou M, Memon D, Meyer B, White KM, Rezelj VV, Marrero MC, Polacco BJ, Melnyk JE, Ulferts S, Kaake RM, et al. 2020. The global phosphorylation landscape of SARS-CoV-2 infection. Cell 182: 685–712.e19. 10.1016/j.cell.2020.06.034 - DOI - PMC - PubMed
    1. Cock PJA, Antao T, Chang JT, Chapman BA, Cox CJ, Dalke A, Friedberg I, Hamelryck T, Kauff F, Wilczynski B, et al. 2009. Biopython: freely available Python tools for computational molecular biology and bioinformatics. Bioinformatics 25: 1422–1423. 10.1093/bioinformatics/btp163 - DOI - PMC - PubMed
    1. Corman VM, Landt O, Kaiser M, Molenkamp R, Meijer A, Chu DK, Bleicker T, Brünink S, Schneider J, Schmidt ML, et al. 2020. Detection of 2019 novel coronavirus (2019-nCoV) by real-time RT-PCR. Euro Surveill 25: 2000045. 10.2807/1560-7917.ES.2020.25.3.2000045 - DOI - PMC - PubMed

Publication types