. 2021 Apr;31(4):622-634.
doi: 10.1101/gr.262055.120. Epub 2021 Mar 15.

Improved redox homeostasis owing to the up-regulation of one-carbon metabolism and related pathways is crucial for yeast heterosis at high temperature

Affiliations

Improved redox homeostasis owing to the up-regulation of one-carbon metabolism and related pathways is crucial for yeast heterosis at high temperature

Liang Song et al. Genome Res. 2021 Apr.

Abstract

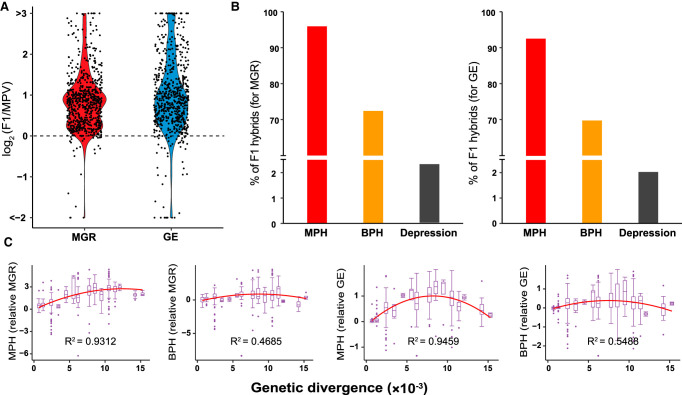
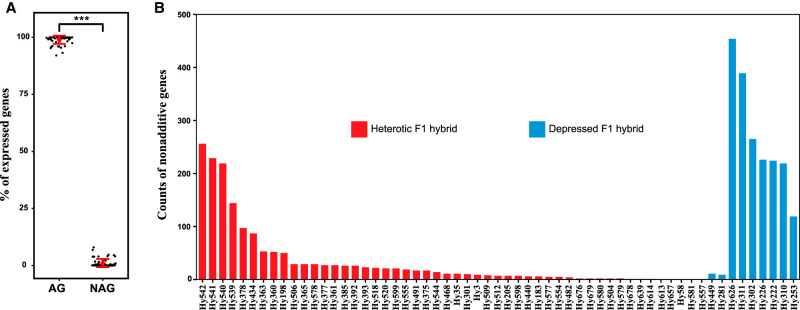
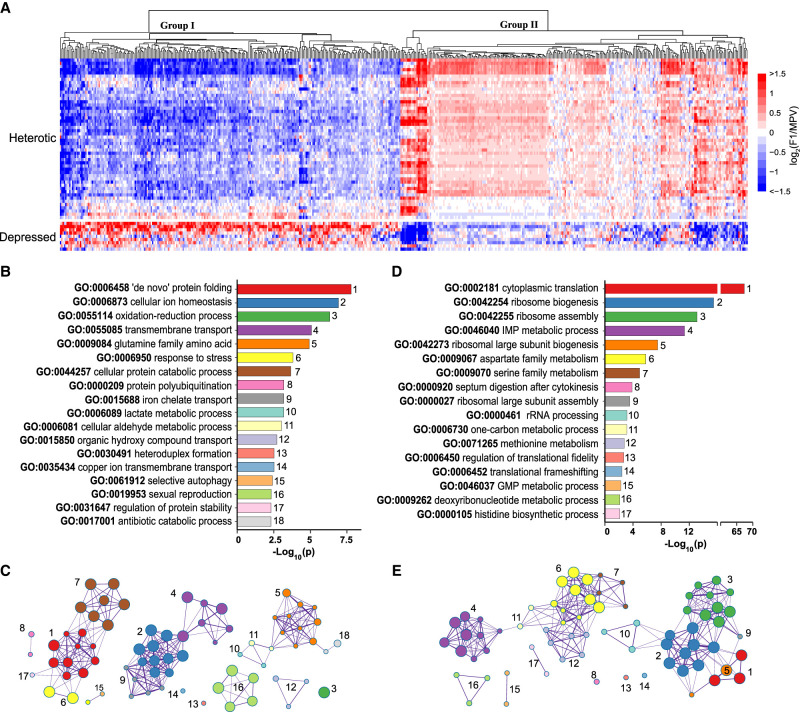
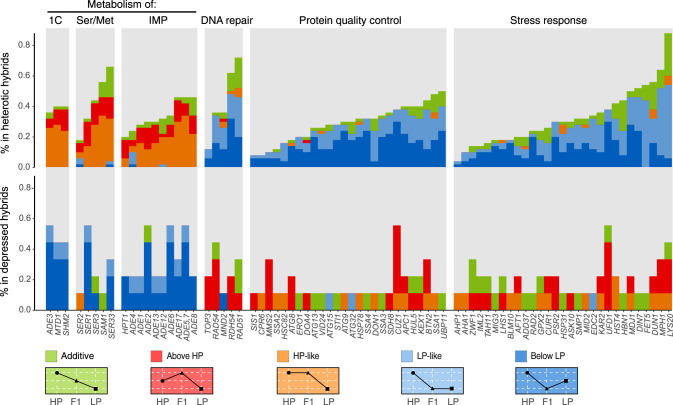
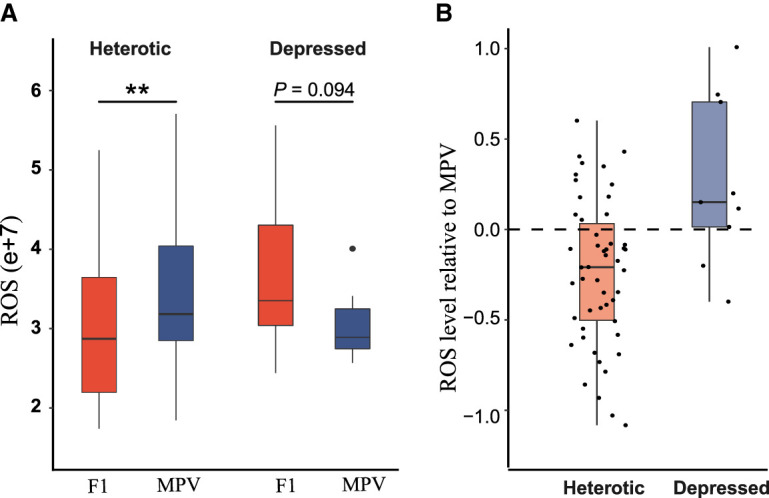
Heterosis or hybrid vigor is a common phenomenon in plants and animals; however, the molecular mechanisms underlying heterosis remain elusive, despite extensive studies on the phenomenon for more than a century. Here we constructed a large collection of F1 hybrids of Saccharomyces cerevisiae by spore-to-spore mating between homozygous wild strains of the species with different genetic distances and compared growth performance of the F1 hybrids with their parents. We found that heterosis was prevalent in the F1 hybrids at 40°C. A hump-shaped relationship between heterosis and parental genetic distance was observed. We then analyzed transcriptomes of selected heterotic and depressed F1 hybrids and their parents growing at 40°C and found that genes associated with one-carbon metabolism and related pathways were generally up-regulated in the heterotic F1 hybrids, leading to improved cellular redox homeostasis at high temperature. Consistently, genes related with DNA repair, stress responses, and ion homeostasis were generally down-regulated in the heterotic F1 hybrids. Furthermore, genes associated with protein quality control systems were also generally down-regulated in the heterotic F1 hybrids, suggesting a lower level of protein turnover and thus higher energy use efficiency in these strains. In contrast, the depressed F1 hybrids, which were limited in number and mostly shared a common aneuploid parental strain, showed a largely opposite gene expression pattern to the heterotic F1 hybrids. We provide new insights into molecular mechanisms underlying heterosis and thermotolerance of yeast and new clues for a better understanding of the molecular basis of heterosis in plants and animals.


Figures

Figure 1.
Figure 1.
Heterosis of F1 hybrids of wild S. cerevisiae, and correlation between heterosis and the genetic distance of parental strains at 40°C. (A) Maximum growth rate (MGR) and growth efficiency (GE) of F1 hybrids relative to the average values of their parents (mid-parent value [MPV]). (B) Proportions of F1 hybrids showing mid-parent heterosis (MPH), better-parent heterosis (BPH), and outbreeding depression. (C) Correlation between genetic distances of parental strains and growth performance of F1 hybrids relative to the MPV (MPH) or the better parent value (BPH) in terms of MGR or GE.
Figure 2.
Figure 2.
Gene expression variations of F1 hybrids and their parents at 40°C. (A) Proportions of additive genes (AGs) and nonadditive genes (NAGs) in every F1 hybrid. (***) P < 0.001 (Mann–Whitney U test). (B) Counts of nonadditive genes in every heterotic and depressed F1 hybrid.
Figure 3.
Figure 3.
Functional categories of nonadditive genes in F1 hybrids of wild S. cerevisiae. (A) Heatmap shows the clustering of nonadditive genes based on their expression levels in each F1 hybrid relative to the average expression levels of the genes in the parents (MPV) of the hybrid according to the scale on the right, which depicts the values of log2 (F1/MPV). (B,D) Nonredundant Gene Ontology (GO) terms significantly enriched with the nonadditive genes in groups I and II, respectively. P-values represent statistical significance. (C,E) Enrichment networks show the intra- and inter-cluster functional similarities of the enriched GO terms shown in B and D, respectively. Enrichment networks are created by representing each enriched term as a node and connecting pairs of nodes with kappa similarities above 0.3. Up to 10 terms represented by colored nodes are included per cluster. The color code is respectively the same with that in B and D. The sizes of the nodes are proportional to the numbers of input genes falling into the terms.
Figure 4.
Figure 4.
Proportions of key nonadditive genes showing different expression models in heterotic and depressed F1 hybrids of wild S. cerevisiae growing at 40°C. Five expression models are defined as illustrated at the bottom. (HP) High parent value; (LP) low parent value. The nonadditive genes are associated with six different functional categories as indicated. (1C) One-carbon; (Ser/Met) serine and methionine; (IMP) inosine monophosphate.
Figure 5.
Figure 5.
Levels of reactive oxygen species (ROS) within cells of F1 hybrids of wild S. cerevisiae and their parents growing at 40°C. (A) Cellular ROS levels of F1 hybrids and average cellular ROS levels of their parents (MPV) in the groups of heterotic and depressed F1 hybrids, respectively. (**) P < 0.01 (Mann–Whitney U test). (B) Cellular ROS levels of heterotic and depressed F1 hybrids relative to the MPV. The relative ROS level in a F1 hybrid was calculated according to the formula log2 (F1/MPV).
Figure 6.
Figure 6.
Effects of ADE3 gene deletion on the growth and cellular oxidative stress of F1 hybrids of wild S. cerevisiae at 40°C. (A) Growth curves of wild types (WTs) and ade3Δ/Δ mutants of four F1 hybrids without or with 15 mM N-acetyl-L-cysteine (NAC) in the medium. (B) MGRs of wild types and ade3Δ/Δ mutants of four F1 hybrids without or with 15 mM NAC in the medium. (C) Comparisons of cellular ROS levels (left) and NADP+/NADPH ratios (right) between the wild types and ade3Δ/Δ mutants of four F1 hybrids. (*) P < 0.05; (**) P < 0.01; (***) P < 0.001; (NS) not significant, P > 0.05 (Mann–Whitney U test). Error bars, SDs (n ≥ 3).

Similar articles

Cited by

References

    1. Altman BJ, Stine ZE, Dang CV. 2016. From Krebs to clinic: glutamine metabolism to cancer therapy. Nat Rev Cancer 16: 619–634. 10.1038/nrc.2016.71 - DOI - PMC - PubMed
    1. Anders S, Pyl PT, Huber W. 2015. HTSeq—a Python framework to work with high-throughput sequencing data. Bioinformatics 31: 166–169. 10.1093/bioinformatics/btu638 - DOI - PMC - PubMed
    1. Auesukaree C. 2017. Molecular mechanisms of the yeast adaptive response and tolerance to stresses encountered during ethanol fermentation. J Biosci Bioeng 124: 133–142. 10.1016/j.jbiosc.2017.03.009 - DOI - PubMed
    1. Baldauf JA, Marcon C, Lithio A, Vedder L, Altrogge L, Piepho HP, Schoof H, Nettleton D, Hochholdinger F. 2018. Single-parent expression is a general mechanism driving extensive complementation of non-syntenic genes in maize hybrids. Curr Biol 28: 431–437.e4. 10.1016/j.cub.2017.12.027 - DOI - PubMed
    1. Bar-Zvi D, Lupo O, Levy AA, Barkai N. 2017. Hybrid vigor: the best of both parents, or a genomic clash? Curr Opin Syst Biol 6: 22–27. 10.1016/j.coisb.2017.08.004 - DOI

Publication types

LinkOut - more resources