. 2021 Apr;31(4):551-563.
doi: 10.1101/gr.265348.120. Epub 2021 Mar 15.

ZNF91 deletion in human embryonic stem cells leads to ectopic activation of SVA retrotransposons and up-regulation of KRAB zinc finger gene clusters

Affiliations

ZNF91 deletion in human embryonic stem cells leads to ectopic activation of SVA retrotransposons and up-regulation of KRAB zinc finger gene clusters

Nina L Haring et al. Genome Res. 2021 Apr.

Abstract

Transposable element (TE) invasions have shaped vertebrate genomes over the course of evolution. They have contributed an extra layer of species-specific gene regulation by providing novel transcription factor binding sites. In humans, SINE-VNTR-Alu (SVA) elements are one of three still active TE families; approximately 2800 SVA insertions exist in the human genome, half of which are human-specific. TEs are often silenced by KRAB zinc finger (KZNF) proteins recruiting corepressor proteins that establish a repressive chromatin state. A number of KZNFs have been reported to bind SVAs, but their individual contribution to repressing SVAs and their roles in suppressing SVA-mediated gene-regulatory effects remains elusive. We analyzed the genome-wide binding profile for ZNF91 in human cells and found that ZNF91 interacts with the VNTR region of SVAs. Through CRISPR-Cas9-mediated deletion of ZNF91 in human embryonic stem cells, we established that loss of ZNF91 results in increased transcriptional activity of SVAs. In contrast, SVA activation was not observed upon genetic deletion of the ZNF611 gene encoding another strong SVA interactor. Epigenetic profiling confirmed the loss of SVA repression in the absence of ZNF91 and revealed that mainly evolutionary young SVAs gain gene activation-associated epigenetic modifications. Genes close to activated SVAs showed a mild up-regulation, indicating SVAs adopt properties of cis-regulatory elements in the absence of repression. Notably, genome-wide derepression of SVAs elicited the communal up-regulation of KZNFs that reside in KZNF clusters. This phenomenon may provide new insights into the potential mechanisms used by the host genome to sense and counteract TE invasions.


Figures

Figure 1.
Figure 1.
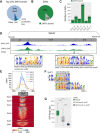
ZNF91 binds at the Alu-VNTR and VNTR-SINE border of all SVA subclasses. (A) Pie chart showing the distribution of the top 10% ZNF91 peaks based on MACS score. (B) Pie chart showing the number of SVA elements that are bound (green, 2545) and not bound (gray, 338) by ZNF91. (C) Frequency plot showing fraction of SVA subclasses bound by ZNF91 (green). (D) Schematic of SVA-D with different domains indicated. A pile-up of KAP1 summits on the SVA-D consensus is displayed in blue (Jacobs et al. 2014), and a representative example of ZNF91 coverage on an SVA-D is in green. Two ZNF91 binding motifs were identified localizing to the Alu-VNTR border and VNTR-SINE border. The fraction of SVA elements that contain motif 1 in the peaks localizing to the Alu-VNTR border and motif 2 in the peaks localizing to the VNTR-SINE border are expressed in percentages. (E) Heatmap and profile plots of ZNF91 ChIP showing coverage in RPKM of the mean of replicates 1 and 2 with SVA center as reference point. Average signal plotted per SVA subclass. (F) Comparison of motifs 1 and 2 showing overlap at the center. (G) Length of SVA elements bound (2546, green) and not bound (gray) by ZNF91. Light gray indicates that at least one of the two SVA binding motifs (199) was present, and dark gray indicates that no motif was detected (139). For statistical testing, an unpaired Wilcoxon rank-sum test was used followed by an FDR correction: (****) P < 0.0001.
Figure 2.
Figure 2.
SVA elements become transcriptionally active in the absence of ZNF91. (A) CRISPR-Cas9 design to delete 172 bp around the transcription start site (TSS) of ZNF91 and RNA-sequencing coverage tracks showing absence of ZNF91 expression in ZNF91 KO clonal hESC lines. (B) Heatmap of hierarchical clustering (Euclidean distance) using Z-score of scaled counts of SVA elements that are up-regulated in ZNF91 KO hESCs (defined as log2 fold change ≥ 3). (C) Coverage of RNA-seq and H3K4me3 and H3K27ac ChIP-seq data for ZNF91 WT and KO hESCs and ZNF91-GFP ChIP on HEK293 cells: (left) transcripts running from 5′ to 3′ end of SVA; (right) red box indicates SVA element as driver of lncRNA. RNA-seq coverage tracks were scaled using DESeq2 scaling factors. ChIP-seq coverage tracks were scaled based on control regions.
Figure 3.
Figure 3.
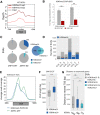
Evolutionarily young SVA elements become epigenetically active in the absence of ZNF91. (A) Profile plots showing coverage of H3K9me3 centered on SVA elements in WT hESCs, and 3 kb upstream of and downstream from SVAs is displayed. (B) H3K9me3 ChIP-qPCR on ZNF91 WT and KO hESCs using two SVA primer pairs. Percentage of input was normalized against a control (LTR12). A one-sided, unpaired t-test was used for statistical analysis. (C) Pie charts showing number of H3K4me3 (dark blue) and H3K27ac (light blue) positive SVA elements in ZNF91 WT and KO hESCs; Venn diagram showing overlap of H3K4me3 and H3K27ac peaks. (D) Absolute number (gray) and percentage of H3K4me3-positive (blue) SVA elements in each subclass. (E) Profile plot showing ZNF91 ChIP signal in HEK293 cells and H3K4me3 signal in ZNF91 KO hESCs. Average read coverage on H3K4me3-positive SVAs was displayed 2 kb upstream of and downstream from the element. (F) Box plot showing length of H3K4me3-positive and -negative SVA subtypes D, E, and F. (G) Box plots showing distance from H3K4me3/H3K27ac-negative, H3K4me3-positive, and H3K4me3/H3K27ac-positive SVA elements to nearest TSS of a gene expressed in hESCs (baseMean > 10) in base pairs. Outliers are not displayed. For statistical testing in F and G, an unpaired Wilcoxon rank-sum test was used, for G followed by an FDR correction: (****) P < 0.0001; (***) P < 0.001; (**) P < 0.01; (ns) not significant. For H3K4me3 and H3K27ac ChIP analyses, only SVA elements bound by ZNF91 were included.
Figure 4.
Figure 4.
Differentially expressed genes in ZNF91 KO cells are bound by ZNF91 and driven by activated SVA elements. (A) Pie charts of all expressed (baseMean > 10) and differentially expressed (DE) genes (DESeq2 analysis, Padj < 0.05) indicating how many genes are bound by ZNF91 at their promoter (green), located within 25 kb of an H3K4me3-positive SVA (blue), both (yellow), and neither (gray). (B) Box plots of distance to nearest H3K4me3-positive SVA from TSS of DE genes (23 genes down-regulated and 31 up-regulated). (C) Box plots showing log2 fold change of genes that are located within 25 kb of an H3K4me3-positive SVA (420 genes) compared to a set of randomly selected genes (556 genes). Red data points indicate genes that were differentially expressed (FDR < 0.05). Only expressed genes (baseMean > 10) were included in this graph. (D) Coverage tracks of RNA-seq (blue is transcription from the positive strand, and orange is from the negative strand) and ChIP-seq data: (left) activation of an intronic SVA-C results in extension of H3K4me3 and H3K27ac signals at the promoter, leading to increased expression of THOC5; (right) activation of an SVA-F upstream of HORMAD1 leads to generation of an SVA-HORMAD1-GOLPH3L fusion transcript. Red boxes indicate activated SVA elements. RNA-seq coverage tracks were scaled using DESeq2 scaling factors. ChIP-seq coverage tracks were scaled based on control regions. For all statistical testing, an unpaired Wilcoxon rank-sum test was used, if necessary, followed by an FDR correction: (**) P < 0.01.
Figure 5.
Figure 5.
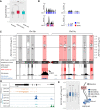
Up-regulation of clustered KZNF genes in proximity of activated SVA elements. (A) Box plots showing log2 fold change of a random gene set (257), KZNF located in clusters (265), and solitary KZNF genes (38). Clusters and solitary KZNF were defined by Thomas and Schneider (2011). Only genes with a baseMean > 10 were included. (B) SVA coverage (SVA/Mb) is shown for Chromosomes 17 and 19 with higher SVA density than expected and Chromosomes 13 and 21 with lower SVA density than expected (based on Wang et al. 2005). Chromosome density plots show distribution of SVA elements (blue) and KZNF genes (red). (C) Schematic representation of Chromosome 19 showing the location of KZNF clusters. Box plots of log2 fold changes on top show if clusters are up-regulated (red) or unchanged (gray). Only genes with baseMean > 10 were included. Number of expressed genes per cluster: 19.1 = 9 genes, 19.12 = 42 genes, 19.2 = 7 genes, 19.3 = 20 genes, 19.4 = 23 genes, 19.5 = 5 genes, 19.6 = 24 genes, 19.7 = 3 genes, 19.8 = 19 genes, 19.9 = 26 genes. Coverage tracks show SVA/Mb for all SVA elements (black) and H3K4me3-positive SVA elements (blue). (D) Coverage of RNA-seq and ChIP-seq (H3K4me3 and H3K27ac) on ZNF91 WT and KO hESCs and ZNF91 in HEK293 cells showing ZNF772 and upstream SVA-D. RNA-seq coverage tracks were scaled using DESeq2 scaling factors. ChIP-seq coverage tracks were scaled based on control regions. (E) Box plots showing log2 fold change of KZNF grouped per distance to nearest SVA that gained H3K4me3 upon ZNF91 deletion (random = 88 genes, 0–50 kb = 112 genes, 50–100 kb = 60 genes, 100–150 = 46 genes, >150 kb = 85 genes). For all analyses only expressed (baseMean > 0) genes were included. For all statistical testing an unpaired Wilcoxon rank-sum test was used, followed by an FDR correction: (ns) P > 0.05; (*) P < 0.05; (**) P < 0.01; (****) P < 0.0001.

Similar articles

Cited by

References

    1. Bailey TL, Boden M, Buske FA, Frith M, Grant CE, Clementi L, Ren J, Li WW, Noble WS. 2009. MEME SUITE: tools for motif discovery and searching. Nucleic Acids Res 37: W202–W208. 10.1093/nar/gkp335 - DOI - PMC - PubMed
    1. Barchitta M, Quattrocchi A, Maugeri A, Vinciguerra M, Agodi A. 2014. LINE-1 hypomethylation in blood and tissue samples as an epigenetic marker for cancer risk: a systematic review and meta-analysis. PLoS One 9: e109478. 10.1371/journal.pone.0109478 - DOI - PMC - PubMed
    1. Batzer MA, Gudi VA, Mena JC, Foltz DW, Herrera RJ, Deininger PL. 1991. Amplification dynamics of human-specific (HS) alu family members. Nucleic Acids Res 19: 3619–3623. 10.1093/nar/19.13.3619 - DOI - PMC - PubMed
    1. Bernstein BE, Kamal M, Lindblad-Toh K, Bekiranov S, Bailey DK, Huebert DJ, McMahon S, Karlsson EK, Kulbokas EJ, Gingeras TR, et al. 2005. Genomic maps and comparative analysis of histone modifications in human and mouse. Cell 120: 169–181. 10.1016/j.cell.2005.01.001 - DOI - PubMed
    1. Bolger AM, Lohse M, Usadel B. 2014. Trimmomatic: a flexible trimmer for Illumina sequence data. Bioinformatics 30: 2114–2120. 10.1093/bioinformatics/btu170 - DOI - PMC - PubMed

Publication types