. 2021 Apr 21;13(590):eabf7872.
doi: 10.1126/scitranslmed.abf7872. Epub 2021 Mar 15.

SARS-CoV-2 infection of human iPSC-derived cardiac cells reflects cytopathic features in hearts of patients with COVID-19

Affiliations

SARS-CoV-2 infection of human iPSC-derived cardiac cells reflects cytopathic features in hearts of patients with COVID-19

Juan A Perez-Bermejo et al. Sci Transl Med. .

Abstract

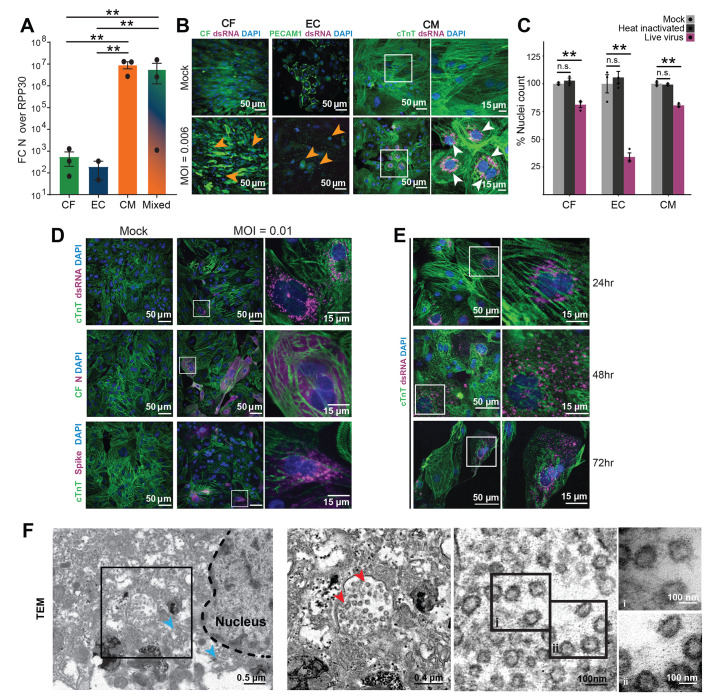
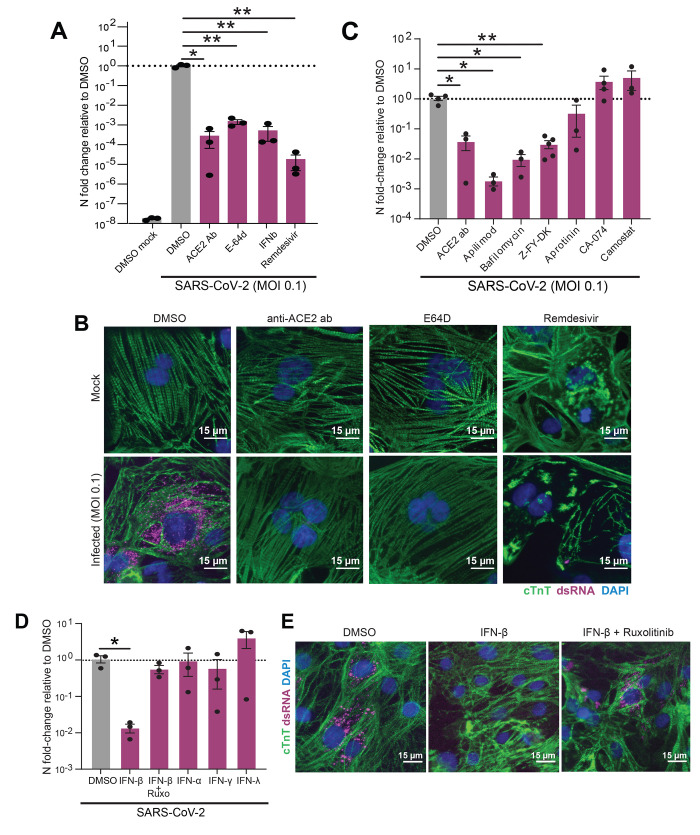
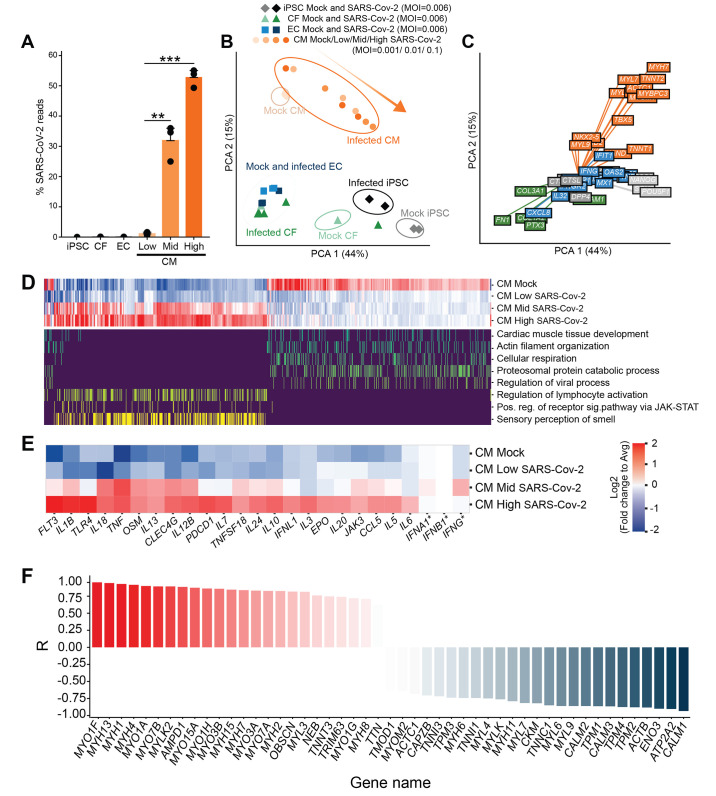
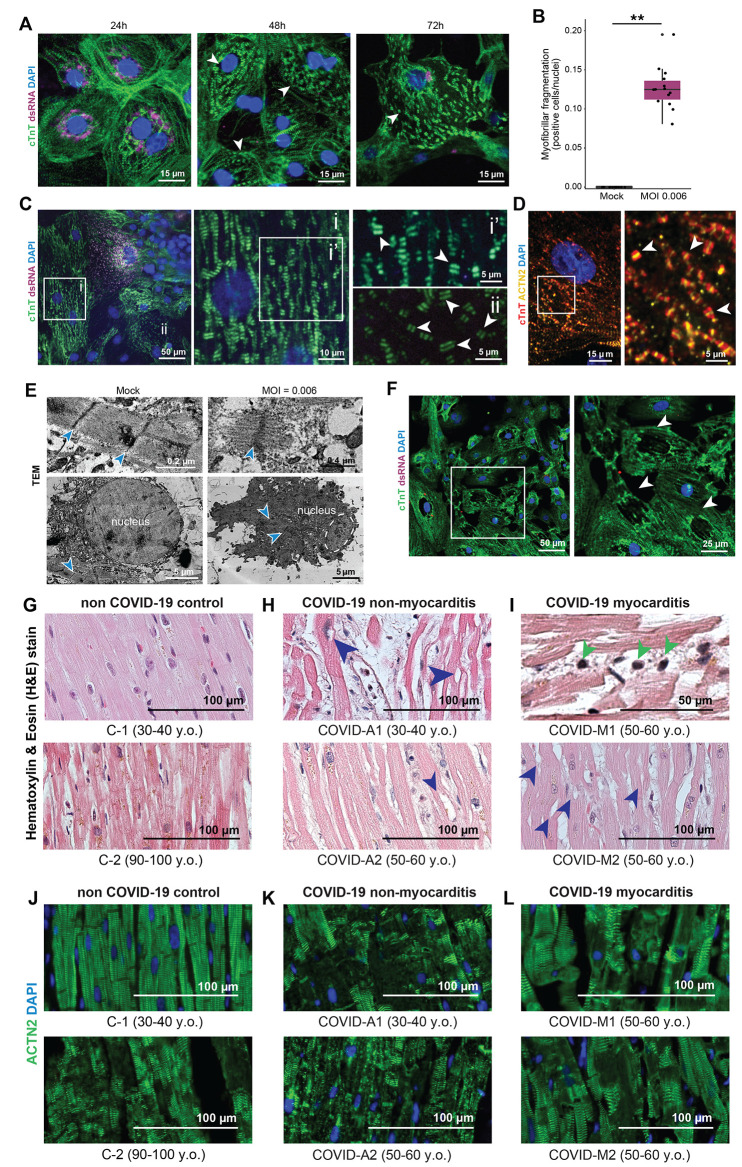
Although coronavirus disease 2019 (COVID-19) causes cardiac dysfunction in up to 25% of patients, its pathogenesis remains unclear. Exposure of human induced pluripotent stem cell (iPSC)-derived heart cells to severe acute respiratory syndrome coronavirus 2 (SARS-CoV-2) revealed productive infection and robust transcriptomic and morphological signatures of damage, particularly in cardiomyocytes. Transcriptomic disruption of structural genes corroborates adverse morphologic features, which included a distinct pattern of myofibrillar fragmentation and nuclear disruption. Human autopsy specimens from patients with COVID-19 reflected similar alterations, particularly sarcomeric fragmentation. These notable cytopathic features in cardiomyocytes provide insights into SARS-CoV-2-induced cardiac damage, offer a platform for discovery of potential therapeutics, and raise concerns about the long-term consequences of COVID-19 in asymptomatic and severe cases.


Figures

Fig. 1
Fig. 1
Effects of SARS-CoV-2 exposure on different iPSC-derived cardiac cell types. In all experiments, cells were exposed to SARS-CoV-2 virus for 48 hours at an MOI of 0.006 before lysis or fixation, unless otherwise specified. White and black boxes indicate magnified regions. (A) RT-qPCR quantification of viral RNA [Fold change (FC) of SARS-CoV-2 nucleocapsid (N) gene, N5, over housekeeping gene transcript, RPP30] in cell cultures exposed to SARS-CoV-2. CF: iPSC-derived cardiac fibroblasts; EC: iPSC-derived endothelial cells; CM: iPSC-derived cardiomyocytes; Mixed: 60:30:10 CM:EC:CF. Bars: mean. Error bars: SEM. **P < 0.01, one-way ANOVA with Tukey’s multiple comparisons. technical replicates: 3; N = 3. (B) Representative images of immunostaining of cardiac cells exposed to SARS-CoV-2. PECAM-1 (CD31) was used as an EC marker, and cTnT as a CM marker. CFs expressed GFP constitutively. Viral signal was detected by staining for SARS-CoV-2 spike protein or viral double stranded RNA (dsRNA), as noted. White boxes represent regions magnified in rightmost panels. Orange arrowheads indicate seemingly apoptotic bodies and white arrowheads denote clusters of dsRNA signal. Images are selected from a total of 30 images across 3 replicates. (C) Toxicity of SARS-CoV-2 to cardiac cell types, quantified by nuclear retention. Y-axis depicts the % of nuclei counted (relative to mock). Nuclei were counted automatically at 10x magnification (10 images/condition). Light gray: Vehicle treatment (mock), Dark gray: Heat inactivated SARS-CoV-2 (MOI = 0.1), Magenta: SARS-CoV-2 (MOI = 0.006). Bars: mean. Error bars: SEM. **P < 0.01. n.s.: nonsignificant (P > 0.05). n = >500 cells per group. N = 3. (D) Representative images of immunostaining for different SARS-CoV-2 viral antigens (dsRNA, N protein or spike protein) in infected iPSC-CMs. Images are selected from a total of 30 images across 3 replicates. (E) Representative images of immunostaining of infected CMs at 24h, 48h or 72h after addition of SARS-CoV-2 virus. Images are selected from a total of 30 images across 3 replicates. (F) Transmission electron microscopy of SARS-CoV-2 viral particles in an infected CM. Left: Montage view with nucleus (dashed line), in addition to remnant ER-Golgi (light blue arrowheads), with viral particles enclosed in a membrane compartment. Middle-left: Magnified view of boxed region from leftmost panel showing SARS-CoV-2 virions (red arrowheads) and surrounding membrane. Middle-right: Magnified view of SARS-CoV-2 virions, showing the 500-750 nm diameter membrane and the 60-100 nm diameter viral particles within. Right: High magnification images of indicated regions of interest within adjacent panel (denoted i and ii). Images are selected from a total of 55 images across 3 different cells.
Fig. 2
Fig. 2. Pharmacological modulation of SARS-CoV-2 infection, viral entry and innate immune response in CMs.
(A) RT-qPCR quantification of viral RNA (N5) in CM samples exposed to SARS-CoV-2 for 48h (MOI = 0.1) after 2h pretreatment with the indicated reagents to block viral infection. Bars: mean. Error bars: SEM. *P < 0.05,**P < 0.01, one-way ANOVA with Tukey’s multiple comparisons. Technical replicates: 3; N = 3. (B) Representative immunofluorescence images from SARS-CoV-2-infected (MOI = 0.1) CMs pretreated with either vehicle (DMSO), ACE2 blocking antibody (anti-ACE2 ab), cathepsin-B and -L inhibitor E-64d (E64D) or remdesivir for 2h before infection. Double-stranded RNA (dsRNA) staining (magenta) denotes presence of replicating virus. Images are selected from a total of 30 images across 3 replicates. (C-D) RT-qPCR quantification of viral RNA (N5) in CM samples exposed to SARS-CoV-2 for 48h (MOI = 0.006) after 2h pretreatment with the indicated reagents to block viral entry (C) or prime the cells’ innate immune response (D). Dots represent separate replicates. Bars: mean. Error bars: SEM. *P < 0.05, **P < 0.01, one-way ANOVA with Tukey’s multiple comparisons. Technical replicates: 3; N ≥ 3 for all conditions. Z-FY-DK: Z-Phe-Tyr(tBu)-diazomethylketone, specific Cathepsin-L inhibitor; CA-074: specific Cathepsin-B inhibitor; Ruxo: Ruxolitinib, JAK1/2 inhibitor. (E) Representative immunofluorescence images from cardiomyocytes pre-treated with vehicle (DMSO), IFN-β, or IFN-β with JAK inhibitor ruxolitinib. Images are selected from a total of 30 images across 3 replicates.
Fig. 3
Fig. 3. Transcriptional effects of SARS-CoV-2 exposure to cardiac cells.
(A) Percentage of total reads that map to the SARS-CoV-2 viral genome in various cell types. iPSCs, ECs or CFs were exposed at an MOI of 0.006, and CMs were exposed at three different MOIs: 0.001 (Low), 0.01 (Mid) and 0.1 (High). Bars: average %reads. Error bars: SEM. **P < 0.01; ***P < 0.001. one-way ANOVA with Tukey’s multiple comparisons. Technical replicates: 3; N = 3. (B). Principal component analysis of transcriptomic samples. Dot shapes and colors represent the different cell types, whether they were exposed to SARS-CoV-2 virus and, in the case of CMs, the different MOIs used. Orange arrow indicates increasing degrees of transcriptional dysregulation (relative to Mock). N = 3. (C). Loading plot for a selected subset of genes, with color indicating cardiomyocyte state (orange), fibroblast/endothelial cell state (green), iPSC state (light gray), SARS-CoV-2 infection-related factors (dark gray), immune response (blue). N = 3. (D). Heat map depicting transcriptional expression profiles for genes mapping to GO terms of interest. Top: expression profile in the Mock condition and least (Low), middle (Mid), and most (High) transcriptionally disrupted CM samples. Bottom: mapping of genes to specific GO terms of interest (only yes/no scale). All genes in the plot had |log2 fold change| > 1 between high infection and mock, adjusted false discovery rate (FDR) < 0.05 using edgeR’s differential expression test (see Methods section); N = 3. All GO terms selected contained at least 25 enriched genes, adjusted FDR < 0.01, using an enrichment test based on hypergeometric distribution and controlled FDR (see Methods). (E). Zoomed in heat map depicting differential expression profiles for a select number of genes involved in innate and inflammatory response to viral infection. All genes are regulated in a statistically significant manner (adjusted FDR < 0.05) except for IFNA1, IFNB1, and IFNG (indicated by an asterisk). Color represents log-2 fold change from average value across conditions. N = 3. Color scale represents log2 fold change relative to average expression of all conditions. (F). Expression ratio (R) of genes involved in sarcomeric structure and myosin contractility of the high-infection CM groups relative to the mock-infection CM group. Expression ratio is the Pearson correlation of gene expression with increasing level of infection. N = 3. Fisher-transformed P < 0.01.
Fig. 4
Fig. 4. Analysis of cytopathic features in iPSC-derived CMs infected by SARS-CoV-2 and autopsy myocardial tissue from healthy individuals and patients with COVID-19.
(A) Representative immunofluorescence images of myofibrillar fragmentation in CMs at different timepoints after exposure to SARS-CoV-2. White arrowheads indicate fragments consisting of two bands of cTnT+ staining. Images are selected from a total of 30 images across 3 replicates. (B) Quantification of number of cells presenting myofibrillar fragmentation at 48h post-exposure (defined as cells presenting at least one event of a cTnT doublet unaligned and dissociated from other myofibrils, divided by total nuclei count). Each dot represents a separate infected sample, each one being the sum of 9 randomly acquired fields of view. **P < 0.01. Two-tailed t test after checking for normality. (C) Representative immunostaining showing a cell with viral dsRNA, adjacent to cells with different degrees of myofibrillar fragmentation. White squares indicate areas magnified in right panels, with labels corresponding to insets. White arrowheads point to examples of cTnT doublets (myofibrillar fragments). Images are selected from a total of 55 images across 3 different cells. (D) cTnT and ACTN2 double-staining of CMs displaying myofibrillar fragmentation. White arrowheads indicate cTnT-ACTN2-cTnT myofibrillar fragments. (E) TEM images of sarcomeres in mock-treated and SARS-CoV-2-infected (MOI = 0.006) CM cultures. Blue arrowheads denote the sarcomeric z-disk; Yellow arrowheads indicate M-line location; dashed line delimits nucleus. Sarcomeres of mock-treated cells display clear I and A-bands, but fragmented sarcomeres only possess thin filaments. Below: Representative TEM image of a healthy nucleus, and the nucleus of a cell infected with SARS-CoV-2. (F) Immunofluorescence staining of SARS-CoV-2-exposed CMs displaying loss of nuclear DNA staining (48h post exposure). White arrowheads indicate locations of sarcomeric retraction and absence of nuclear material. Images are selected from a total of 30 images across 3 replicates. (G-I) Representative images of Hematoxylin and Eosin (H&E) staining of myocardial tissues from patients without COVID-19 (G), and patients with COVID-19 without cardiac involvement (H) or with diagnosed myocarditis (I). Red arrowheads indicate cardiomyocytes lacking chromatin staining. Dark blue arrowheads indicate the presence of immune cells. (J-L) Representative immunofluorescence staining of myocardial tissue from patients without COVID-19 (J), compared to patients with COVID-19 without cardiac involvement (K) and with diagnosed myocarditis (L). Cardiomyocytes show signs of damage in the form of diffuse and disorganized actinin (ACTN2) staining. For all patient biopsies, images are selected from 2-3 heart regions (right and left ventricles and interventricular septum) per sample, 5-15 images per section/region, for a total of 7 patients (two control, two with COVID and diagnosed myocarditis, and three with COVID and no diagnosed myocarditis).

Update of

References

    1. Wang D., Hu B., Hu C., Zhu F., Liu X., Zhang J., Wang B., Xiang H., Cheng Z., Xiong Y., Zhao Y., Li Y., Wang X., Peng Z., Clinical Characteristics of 138 Hospitalized Patients With 2019 Novel Coronavirus-Infected Pneumonia in Wuhan, China. JAMA 323, 1061–1069 (2020). 10.1001/jama.2020.1585 - DOI - PMC - PubMed
    1. Chen N., Zhou M., Dong X., Qu J., Gong F., Han Y., Qiu Y., Wang J., Liu Y., Wei Y., Xia J., Yu T., Zhang X., Zhang L., Epidemiological and clinical characteristics of 99 cases of 2019 novel coronavirus pneumonia in Wuhan, China: A descriptive study. Lancet 395, 507–513 (2020). 10.1016/S0140-6736(20)30211-7 - DOI - PMC - PubMed
    1. Fried J. A., Ramasubbu K., Bhatt R., Topkara V. K., Clerkin K. J., Horn E., Rabbani L., Brodie D., Jain S. S., Kirtane A. J., Masoumi A., Takeda K., Kumaraiah D., Burkhoff D., Leon M., Schwartz A., Uriel N., Sayer G., The variety of cardiovascular presentations of COVID-19. Circulation 141, 1930–1936 (2020). 10.1161/CIRCULATIONAHA.120.047164 - DOI - PMC - PubMed
    1. Arentz M., Yim E., Klaff L., Lokhandwala S., Riedo F. X., Chong M., Lee M., Characteristics and Outcomes of 21 Critically Ill Patients With COVID-19 in Washington State. JAMA 323, 1612–1614 (2020). 10.1001/jama.2020.4326 - DOI - PMC - PubMed
    1. Richardson S., Hirsch J. S., Narasimhan M., Crawford J. M., McGinn T., Davidson K. W., Barnaby D. P., Becker L. B., Chelico J. D., Cohen S. L., Cookingham J., Coppa K., Diefenbach M. A., Dominello A. J., Duer-Hefele J., Falzon L., Gitlin J., Hajizadeh N., Harvin T. G., Hirschwerk D. A., Kim E. J., Kozel Z. M., Marrast L. M., Mogavero J. N., Osorio G. A., Qiu M., Zanos T. P.; the Northwell COVID-19 Research Consortium , Presenting Characteristics, Comorbidities, and Outcomes Among 5700 Patients Hospitalized With COVID-19 in the New York City Area. JAMA 323, 2052–2059 (2020). 10.1001/jama.2020.6775 - DOI - PMC - PubMed

Publication types