. 2021 Mar 23;118(12):e2018459118.
doi: 10.1073/pnas.2018459118.

Neuronal circuits overcome imbalance in excitation and inhibition by adjusting connection numbers

Affiliations

Neuronal circuits overcome imbalance in excitation and inhibition by adjusting connection numbers

Nirit Sukenik et al. Proc Natl Acad Sci U S A. .

Abstract

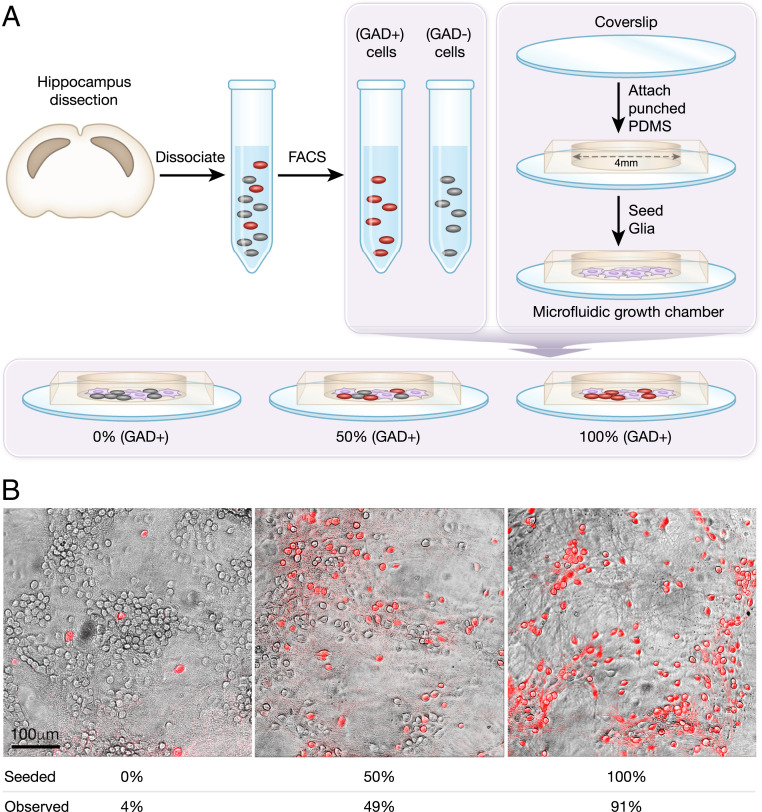
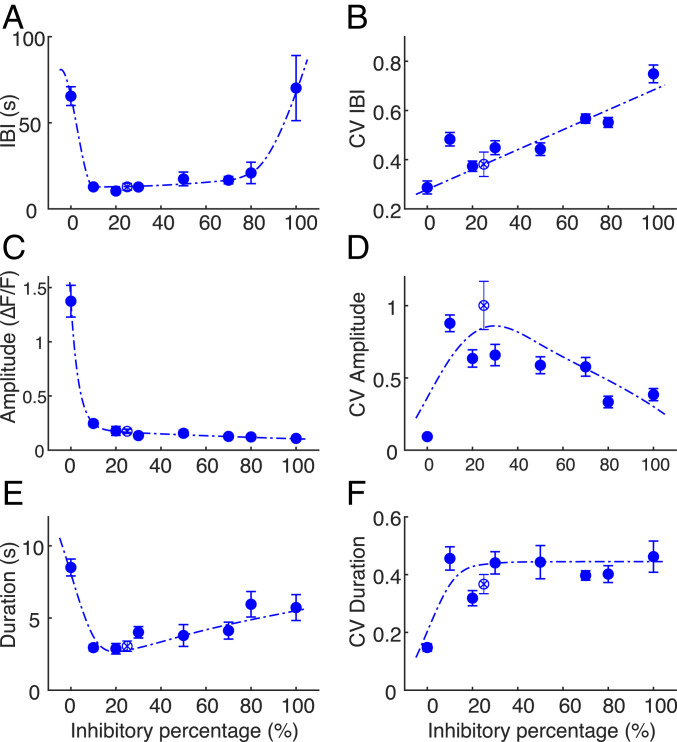
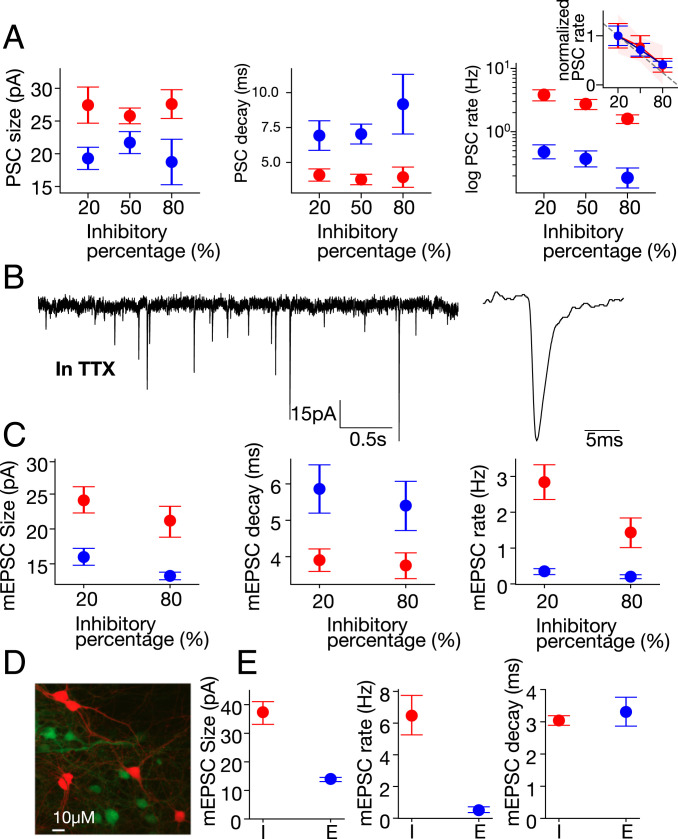
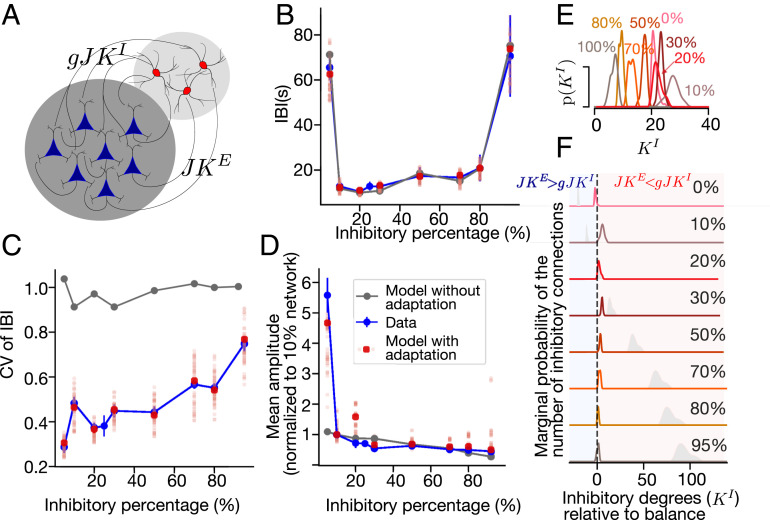
The interplay between excitation and inhibition is crucial for neuronal circuitry in the brain. Inhibitory cell fractions in the neocortex and hippocampus are typically maintained at 15 to 30%, which is assumed to be important for stable dynamics. We have studied systematically the role of precisely controlled excitatory/inhibitory (E/I) cellular ratios on network activity using mice hippocampal cultures. Surprisingly, networks with varying E/I ratios maintain stable bursting dynamics. Interburst intervals remain constant for most ratios, except in the extremes of 0 to 10% and 90 to 100% inhibitory cells. Single-cell recordings and modeling suggest that networks adapt to chronic alterations of E/I compositions by balancing E/I connectivity. Gradual blockade of inhibition substantiates the agreement between the model and experiment and defines its limits. Combining measurements of population and single-cell activity with theoretical modeling, we provide a clearer picture of how E/I balance is preserved and where it fails in living neuronal networks.

Keywords: E/I balance; bursting; network dynamics; neuronal network.


Conflict of interest statement

The authors declare no competing interest.

Figures

Fig. 1.
Fig. 1.
Methods for culturing hippocampal networks with different E/I cellular compositions. (A) Hippocampal neurons are dissected from mouse embryos at day 17 of gestation. Females from mouse model GAD II-IRES-Cre are mated with males from mouse model Ai9-tdTomato-lox, yielding GABAergic cells that coexpress tdTomato with GAD II. FACS is used to sort tdTomato-expressing cells (GAD+ population, GABAergic cells) from those not expressing (GAD−). GAD+ and GAD− populations are then seeded at different ratios in microfluidic growth chambers on a glial cell layer. (B) Examples for three different cultures with seeding percentages of 0, 50, and 100% GABAergic cells and corresponding experimentally observed percentages of 4, 49, and 91%. Imaging was performed on a SP5 Leica confocal microscope with the fluorescent measurement overlaid on a transmitted light image.
Fig. 2.
Fig. 2.
Experiment and model bursting activity, along with neuron images. (A) Typical calcium imaging traces of the experimental data, displaying the percent deviation from baseline fluorescence ΔF/F. All cultures are spontaneously active, even at high inhibitory percentages. The control cultures (i.e., no sorting) are set as 25% inhibition. (B) The model simulations of networks with the inhibitory fractions that are used experimentally. The two model parameters are the number of inhibitory connections and the external input rate, sampled from the approximated posterior distribution (SI Appendix, SI Methods). To mimic the slow dynamics of the calcium indicator, network spike counts are convolved with a 2-s exponential kernel, and a sigmoid cutoff is applied on the amplitude. The amplitudes are normalized by the maximum amplitude of the 10% inhibitory network. The model agrees considerably with the experimental results. (C and D) Green fluorescent protein–transfected neurons (green) on background of tdTomato-cultured hippocampal neurons (red). A green pyramidal neuron is presented in C. The yellow (green+red) GABAergic neuron is shown in D; note that the dendrites of the GABAergic neuron are thin, the cell is multipolar, and there are no apparent dendritic spines. The green pyramidal cell has an apparent apical dendrite and many dendritic spines, indicating a genuine excitatory neuron.
Fig. 3.
Fig. 3.
Bursting dynamics as a function of E/I composition. (A) IBIs follow a U-shaped trend as function of inhibitory percentage, with higher values at the extreme cases (0 and 100%) but are relatively constant in midrange (10 to 80%). (B) The CV of IBIs, a measure of the variability, grows linearly along the full range of inhibitory percentages. (C) Burst amplitudes drop from 0 to 10% inhibition and continue to decay till 100% inhibition. (D) The CV of burst amplitude is minimal for 0% inhibition (0.09 ± 0.02). Increasing the inhibitory percentage to 10% leads to a sharp increase of amplitude variance, which then gradually decays at higher inhibition fractions. (E) Burst duration is maximal for 0% inhibition (8.5 ± 0.6 s) and abruptly decreases at 10% inhibition. The duration gradually increases with higher inhibitory percentage. (F) Durations of 0% inhibitory cultures exhibit a relatively low CV of 0.15 ± 0.01. Other fractions in the range of 10 to 100% inhibition display a relatively constant value around 0.45. In all panels, the dashed lines are meant only as a guide to the eye, the error bars indicate the SEM, and control (no FACS) is displayed as an empty circle with × inside.
Fig. 4.
Fig. 4.
Patch-clamp measurement. Single-cell changes (mean ± SEM) in response to varying the network inhibitory percentages is presented for inhibitory (red) and excitatory (blue) neurons. (A) While the size (Left) and decay time (Middle) of spontaneous PSCs do not change with inhibition, a significant decrease occurs in the PSC rate (Right, logarithmic scale). (Inset) Normalizing PSC rates by the value at 20% inhibition highlights the substantial (and similar) decrease for both excitatory and inhibitory cells. Moreover, the linear fit to the decrease (dashed line, 95% CI-red area) shows the rate to be directly proportional to the number of excitatory cells. (B) Sample mEPSCs (Left), recorded in 0.5 μM TTX and 10 μM bicuculline, from a red (inhibitory) cell in a 20% inhibitory culture (zoom-in, Right). (C) mEPSC size (Left) and decay time (Middle) also do not change with inhibition. However, the rate does change significantly, showing lower values at higher inhibition percentage (Right). (D) Image of a field containing red (CRE-GAD-tdTomato) and green (CRE-OFF-YFP) neurons. (E) Within the same culture, mEPSC size (Left) and rate (Middle) are significantly higher in inhibitory (I) versus excitatory (E) neurons, while the decay time (Right) is similar. See SI Appendix, SI Methods for the statistical analysis.
Fig. 5.
Fig. 5.
Network model with adaptive LIF neurons reproduces the main burst features. (A) A schematic of the model (see text for details). (B and C) IBIs (B) and CV (C) in the model with adaptation (red) and without (gray). The experimental data is shown in blue (error bars, SEM). For the model with adaptation, points (red) show the IBIs in the model with the most probable parameters of an approximated posterior distribution and individual samples are shown in pale red. The model without adaptation cannot reproduce the observed CV, while with adaptation it does. (D) Burst amplitudes in cultures (blue) and in the model with adaptation (red, like B), normalized by the mean amplitude of the bursts in the 10% inhibitory network. (E and F) Posterior distributions of the number of inhibitory connections P(KI) obtained by ABC. In F, the x-axis is shifted such that zero (KI = KE/g) is at balance. The blue regions indicate a part of the parameter space with more excitatory connections than at balance, and red indicates those with more inhibitory connections. They gray shadows show the distributions that would be obtained if the number of inhibitory connections is proportional to the number of inhibitory neurons, taking 20% inhibitory neurons as a reference.
Fig. 6.
Fig. 6.
Blocking of inhibitory synapses reveals the bursting mechanisms. (A) Trajectories in a phase space defined by the population firing rate and spike-frequency adaptation for inhibitory strengths g = 3.6 and g = 4.0 (solid black lines, stable solutions; dashed lines, unstable solutions). At g = 4, the network is in the balance condition; at g = 3.6, it is in the excitation-dominated condition. The pale lines show examples of individual burst trajectories (pink, balanced network; blue, excitation dominated). Larger values of the adaptation at the burst end lead to longer IBIs. (Inset) The size of the bistable region increases with decreasing inhibitory strength. The squares and circles indicate the average adaptation at the beginning and end of simulated bursts. Decreasing the inhibitory strength leads to higher burst amplitudes and longer IBIs. (B) In networks with 20 to 80% of inhibitory neurons, the increase in bicuculline concentration (logarithmic scale) results in longer IBIs—that is, within experimental error, similar to the control cultures. The model (lines) reproduces the experimental results (dots). In contrast, no adaptation model (gray) decreases the IBIs and transitions to a nonbursting dynamic. The IBIs are normalized by the mean at 0 μM bicuculline. (C) Bicuculline application to networks with extreme inhibitory percentages and the corresponding responses of the model.

References

    1. Isaacson J. S., Scanziani M., How inhibition shapes cortical activity. Neuron 72, 231–243 (2011). - PMC - PubMed
    1. Okun M., Lampl I., Instantaneous correlation of excitation and inhibition during ongoing and sensory-evoked activities. Nat. Neurosci. 11, 535–537 (2008). - PubMed
    1. Brunel N., Dynamics of sparsely connected networks of excitatory and inhibitory spiking neurons. J. Comput. Neurosci. 8, 183–208 (2000). - PubMed
    1. Gigante G., Deco G., Marom S., Del Giudice P., Network events on multiple space and time scales in cultured neural networks and in a stochastic rate model. PLOS Comput. Biol. 11, e1004547 (2015). - PMC - PubMed
    1. Sahara S., Yanagawa Y., O’Leary D. D. M., Stevens C. F., The fraction of cortical GABAergic neurons is constant from near the start of cortical neurogenesis to adulthood. J. Neurosci. 32, 4755–4761 (2012). - PMC - PubMed

Publication types

LinkOut - more resources