. 2021 Mar 23;118(12):e2022982118.
doi: 10.1073/pnas.2022982118.

A co-opted steroid synthesis gene, maintained in sorghum but not maize, is associated with a divergence in leaf wax chemistry

Affiliations

A co-opted steroid synthesis gene, maintained in sorghum but not maize, is associated with a divergence in leaf wax chemistry

Lucas Busta et al. Proc Natl Acad Sci U S A. .

Abstract

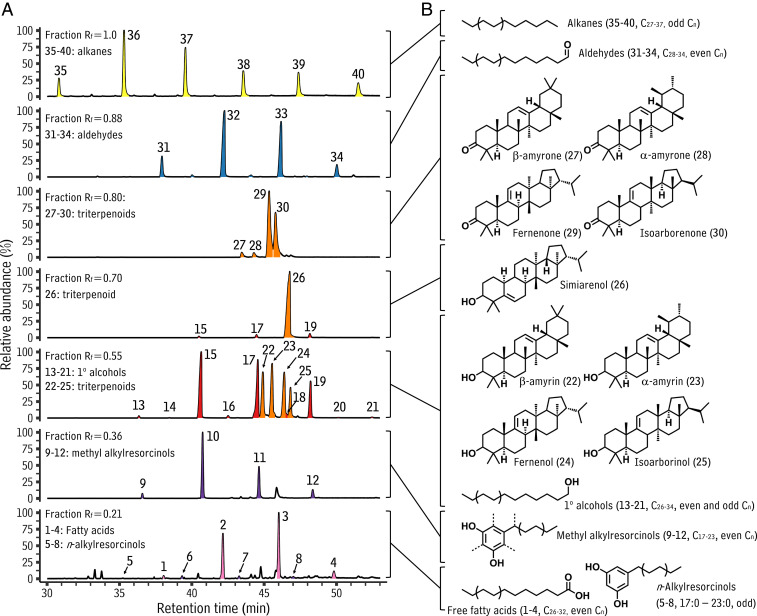
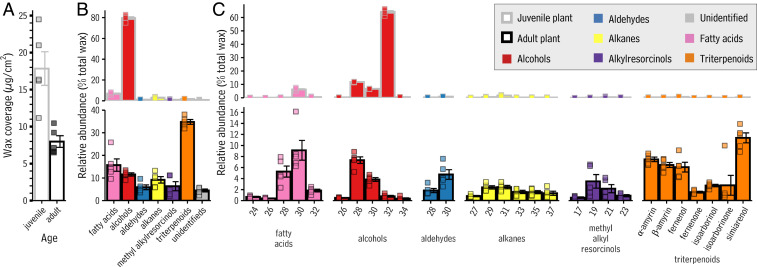
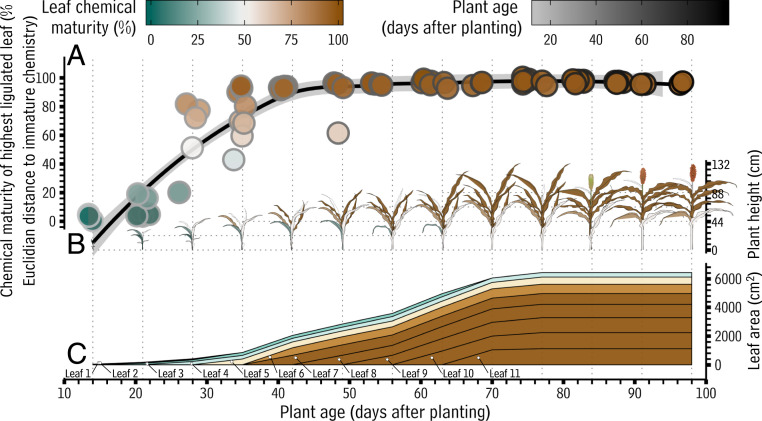
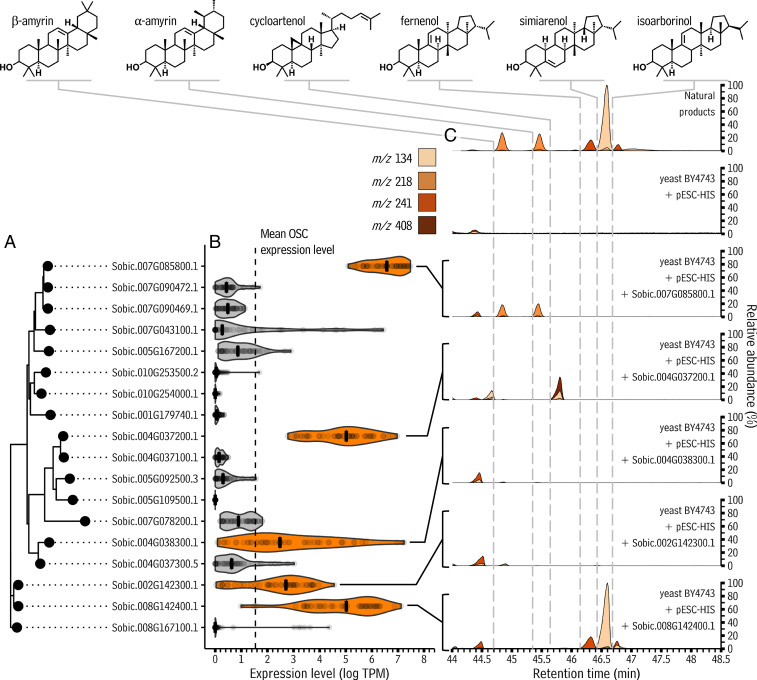
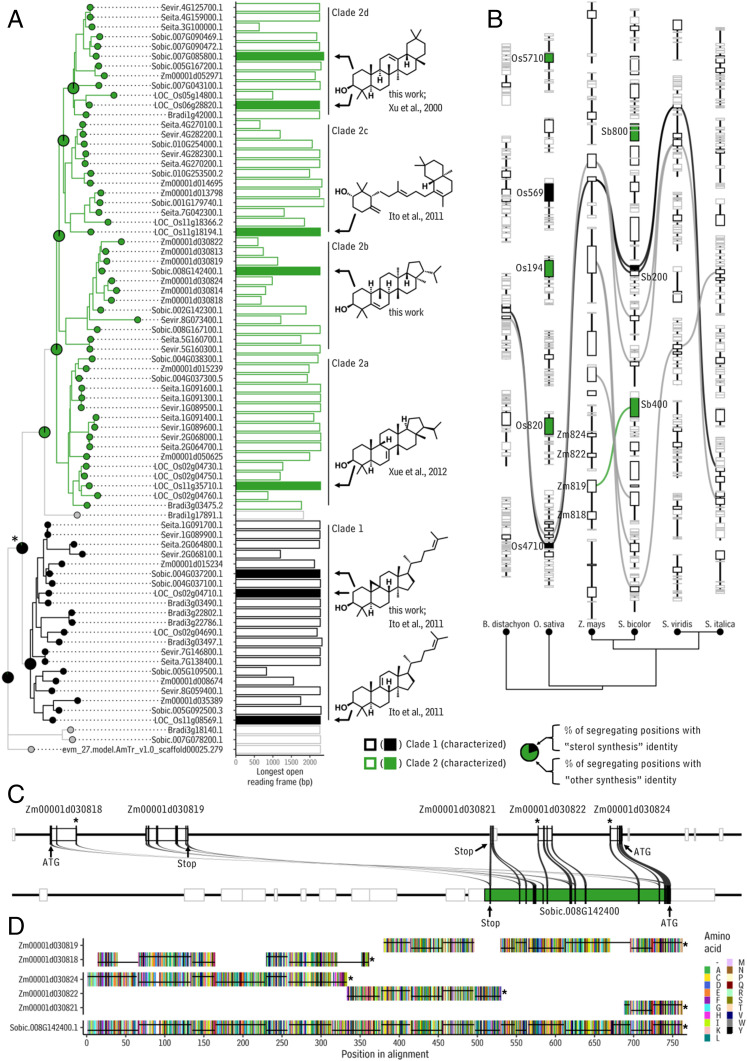
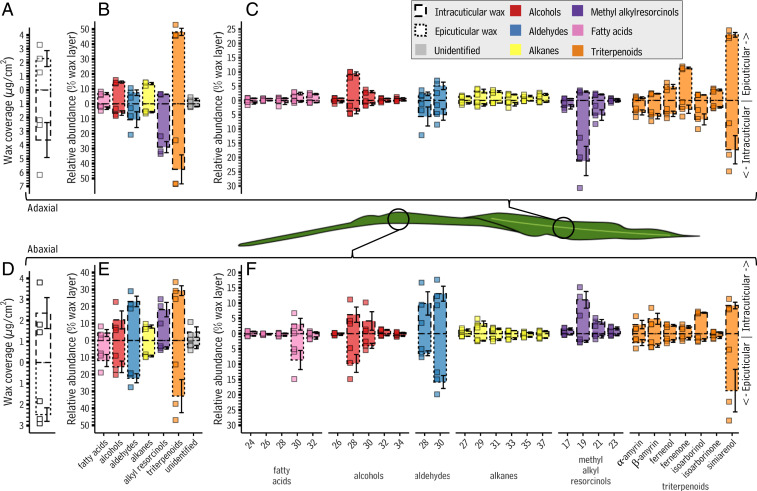
Virtually all land plants are coated in a cuticle, a waxy polyester that prevents nonstomatal water loss and is important for heat and drought tolerance. Here, we describe a likely genetic basis for a divergence in cuticular wax chemistry between Sorghum bicolor, a drought tolerant crop widely cultivated in hot climates, and its close relative Zea mays (maize). Combining chemical analyses, heterologous expression, and comparative genomics, we reveal that: 1) sorghum and maize leaf waxes are similar at the juvenile stage but, after the juvenile-to-adult transition, sorghum leaf waxes are rich in triterpenoids that are absent from maize; 2) biosynthesis of the majority of sorghum leaf triterpenoids is mediated by a gene that maize and sorghum both inherited from a common ancestor but that is only functionally maintained in sorghum; and 3) sorghum leaf triterpenoids accumulate in a spatial pattern that was previously shown to strengthen the cuticle and decrease water loss at high temperatures. These findings uncover the possibility for resurrection of a cuticular triterpenoid-synthesizing gene in maize that could create a more heat-tolerant water barrier on the plant's leaf surfaces. They also provide a fundamental understanding of sorghum leaf waxes that will inform efforts to divert surface carbon to intracellular storage for bioenergy and bioproduct innovations.

Keywords: cuticular wax; drought tolerance; juvenile-to-adult transition; sorghum bicolor; triterpenoids.


Conflict of interest statement

The authors declare no competing interest.

Figures

Fig. 1.
Fig. 1.
Leaf wax constituents from S. bicolor. (A) Line plot depicting total ion GC-MS chromatograms of TLC-separated waxes of pooled S. bicolor leaves from plants at a range of ages (14 to 98 d after planting). Plotted is the relative abundance (y axis) of the signal as a function of retention time (x axis). Peak fill corresponds to compound class, yellow: alkanes, blue: aldehydes, orange: triterpenoids, red: primary alcohols, purple: methyl and n-alkylresorcinols, and pink: fatty acids. (B) Diagram showing the structure of each compound or homologous series identified, each of which is linked, using brackets, to the TLC fraction in which it was most abundant.
Fig. 2.
Fig. 2.
Coverage and composition of wax on juvenile and adult leaves of S. bicolor. (A) Bar chart showing total wax coverage (in μg/cm2; y axis) on leaves produced by juvenile (Left bar) and adult (Right bar) S. bicolor plants. Each bar is given a border to reflect plant maturity, where those colored gray correlate to data for juvenile plants and those bordered black are adult plants. (B) Bar chart showing the relative abundance (percent total wax from that leaf; y axis) of each compound class (x axis) present on leaves produced by juvenile (Top, gray bordered bars) and adult (Bottom, black bordered bars) S. bicolor plants. Bars are color filled according to compound class, and as defined in Fig. 1A: yellow: alkanes, blue: aldehydes, orange: triterpenoids, red: primary alcohols, purple: methyl alkylresorcinols, pink: fatty acids, and gray: unidentified. (C) Bar chart showing the relative abundance (percent total wax from that leaf; y axis) of each compound identified on juvenile (Top, gray bordered bars) and adult (Bottom, black bordered bars) leaves of S. bicolor. Numbers below each bar indicate the total carbon number of that compound, and the text below each group of bars indicates the compound class represented by those bars. The chemical structures of these compounds are presented in Fig. 1B. Throughout, bar heights and error bars represent the mean and SE of five independent samples, respectively.
Fig. 3.
Fig. 3.
Surface area covered by juvenile versus adult wax chemistry on developing S. bicolor plants. In this figure, a previously defined color scheme (gray to black: juvenile-to-adult plant age) is used along with a new scheme (green to brown). The new scheme defines the progression of leaf chemical maturity, rather than plant age, as indicated in the green to brown legend. This legend indicates the meaning of the colors of 1) the points in A, 2) the leaves in B, and 3) the layers in C. (A) Scatterplot showing the surface wax chemical maturity of the highest leaf with an exposed ligule on developing S. bicolor plants. Each point represents one gas chromatography-mass spectrometry sample prepared from one sorghum leaf, with each being plotted according to its Euclidian distance from juvenile to adult chemistry (“leaf chemical maturity,” Left y axis, juvenile and adult chemistry defined as the profiles shown in Fig. 2C). These points are also plotted as a function of the age of the plant from which the sample was taken (“plant age,” x axis). Thus, each point represents with both color and y position the chemical maturity of the leaves with the same color at the same position on the x axis in the plant diagrams below. (B) Diagram showing plant height (in cm, Top Right y axis) at each week during development. Leaf color corresponds to the chemical maturity of the leaf’s surface, as indicated in the legend. Plant images in B were reprinted with permission from Kansas State University Agricultural Experiment Station and Cooperative Extension Service. (C) Area chart depicting the cumulative leaf surface area (cm2; Lower Right y axis) of a sorghum plant over the course of development. Each leaf is represented with a track, as indicated with the “leaf 1”–“leaf 11” labels. The height of each track corresponds to the area of that leaf as a function of time, with the total height of all tracks corresponding to the total leaf area of the plant. Each track is shaded according to the chemical maturity of that leaf’s surface, with green corresponding to juvenile leaf chemistry and brown corresponding to adult leaf chemistry, as indicated in the legend. Leaf surface areas shown are the average of three independent plants.
Fig. 4.
Fig. 4.
Bioinformatic analysis and heterologous expression of OSCs from S. bicolor. (A) An unrooted phylogenetic tree showing relationships between OSCs annotated in the S. bicolor genome. (B) Violin plot showing the distribution of expression levels of each S. bicolor OSC as determined from 50 different publicly available RNA-sequencing samples. The mean OSC expression level across all samples is shown with a vertical dotted line, and the median expression level of each OSC is shown with a vertical cross bar inside each violin. OSCs with a median expression level greater than the mean expression level of all OSCs across all samples are highlighted in orange. (C) Line plot showing single ion chromatograms from gas chromatography-mass spectrometry analyses of transgenic S. cerevisiae cultures expressing the S. bicolor OSC genes highlighted in B as indicated by lines and brackets. Peak fill corresponds to the single ion trace from which they arise, as indicated in the legend. Vertical, dotted gray lines indicate the retention times of each peak of interest: the time point at which the signal leaves the baseline to form the beginning of each peak. To preclude batch effects, heterologous expression experiments in yeast were performed in two independent batches of three replicates each, yielding similar results both times.
Fig. 5.
Fig. 5.
Evolution of monocot OSCs. (A) Rooted phylogenetic tree (Left) showing relationships between annotated OSC-like gene models in six grass genomes (B. distaychon, accessions “Bradi[…]”; O. sativa, accessions “Loc_Os[…]”; Z. mays, accessions “Zm[…]”; S. bicolor, accessions “Sobic.[…]”; S. viridis, accessions “Sevir.[…]”; and S. italica, accessions “Seita.[…]”). The bar chart shows the longest open reading frame within each gene. Color-filled bars correspond to functionally characterized genes, with the structures of their major products shown to the Right of the bar chart. Colored tip labels, branches, and bars denote particular clades within the tree as indicated by clade markers (vertical lines to the Right of the bar chart) and as denoted in the legend. (B) Diagram showing syntenic relationships between OSCs in the six grass genomes (Top). Bezier curves connect syntenic orthologs and are colored if one of the orthologs has been functionally characterized, according to the product profile of the enzyme encoded by that gene. Phylogenetic tree showing the relationships between the species in the synteny diagram (Bottom). Abbreviations: Sb200: Sobic.004G037200.1, Sb400: Sobic.008G142400.1, Sb800: Sobic.007G085800.1, Zm819: Zm00001d030819, Os710: LOC_Os11g35710.1, Os569: LOC_Os11g08569.1. In both B and C, black lines represent chromosomal segments, while boxes on those lines indicate gene boundaries. Boxes with black outlines are OSC genes, while boxes with gray outlines are not OSC genes. Color-filled boxes indicate functionally characterized genes as denoted in the legend. (C) Diagram showing portions of the maize genome with high homology to Sobic.008G142400.1. Black bars superimposed on top gene boxes indicate coding sequence segments. Gray curves connect regions with high homology. Asterisks indicate premature stop codons in the coding sequences of the maize homologs of Sobic.008G142400.1. (D) Multiple sequence alignment of amino acid sequences encoded by Sobic.008G142400.1, Zm00001d030818, Zm00001d030819, Zm00001d030821, Zm00001d030822, and Zm00001d030824. Colored vertical bars correspond to amino acids as indicated in the legend. Black lines in each lane connect amino acids encoded by the same exon. Asterisks indicate stop codons.
Fig. 6.
Fig. 6.
Epicuticular and intracuticular wax composition on leaves produced by adult S. bicolor plants. Bar charts showing the abundance and composition of epicuticular and intracuticular waxes from both the adaxial and abaxial sides of leaves made by adult sorghum leaves. Throughout, bar correspondence with intracuticular versus epicuticular wax components is coded using both the direction the bar projects from the x axis (toward center: intracuticular wax, away from center: epicuticular wax) and the bar border (dashed border: intracuticular wax, dotted border: epicuticular wax). The direction of bar projection in each panel series (AC and DF) reflects the location of each epicuticular and intracuticular layer when viewing a S. bicolor leaf through a sagittal plane. The borders for both epicuticular and intracuticular observations are dots and dashes, respectively; this formatting is used to show both epicuticular (dots) and intracuticular (dashes) components. Together, these make up the total wax coverage observed (solid border, shown in Fig. 4) of S. bicolor leaves. Bars are colored according to compound class, as set precedent by Fig. 1A: yellow: alkanes, blue: aldehydes, orange: triterpenoids, red: primary alcohols, purple: methyl alkylresorcinols, and pink: fatty acids, gray: unidentified. Numbers below each bar indicate the total carbon number of that compound, and the text below each group of bars indicates the compound class represented by those bars. Shown is the total amount of epicuticular and intracuticular wax on (A) the adaxial surface and (D) the abaxial surface (y axis; shown in mg/cm2), the relative abundance of each wax compound class in the epicuticular and intracuticular wax layers on (B) the adaxial surface and (E) the abaxial surface, and the relative abundance of each wax compound in the epicuticular and intracuticular layer on (C) the adaxial surface and (F) the abaxial surface. Bar heights and error bars indicate the mean and SE of three independent analyses, respectively. To preclude batch effects, the entire experiment was performed in two batches of three replicates each, yielding similar results both times.

References

    1. Alexandratos N., Bruinsma J., “World agriculture towards 2030/2050, the 2012 revision” (2012).
    1. Foley J. A., et al. ., Solutions for a cultivated planet. Nature 478, 337–342 (2011). - PubMed
    1. Winchell F., Stevens C. J., Murphy C., Champion L., Fuller D., Evidence for sorghum domestication in fourth millennium BC Eastern Sudan: Spikelet morphology from Ceramic impressions of the Butana group. Curr. Anthropol. 58, 673–683 (2017).
    1. Wet J. M. J. D., Harlan J. R., The origin and domestication of Sorghum bicolor. Econ. Bot. 25, 128–135 (1971).
    1. Morris G. P., et al. ., Population genomic and genome-wide association studies of agroclimatic traits in sorghum. Proc. Natl. Acad. Sci. U.S.A. 110, 453–458 (2013). - PMC - PubMed

Publication types

MeSH terms

LinkOut - more resources