. 2021 Mar 23;118(12):e2023613118.
doi: 10.1073/pnas.2023613118.

The synaptonemal complex imposes crossover interference and heterochiasmy in Arabidopsis

Affiliations

The synaptonemal complex imposes crossover interference and heterochiasmy in Arabidopsis

Laia Capilla-Pérez et al. Proc Natl Acad Sci U S A. .

Abstract

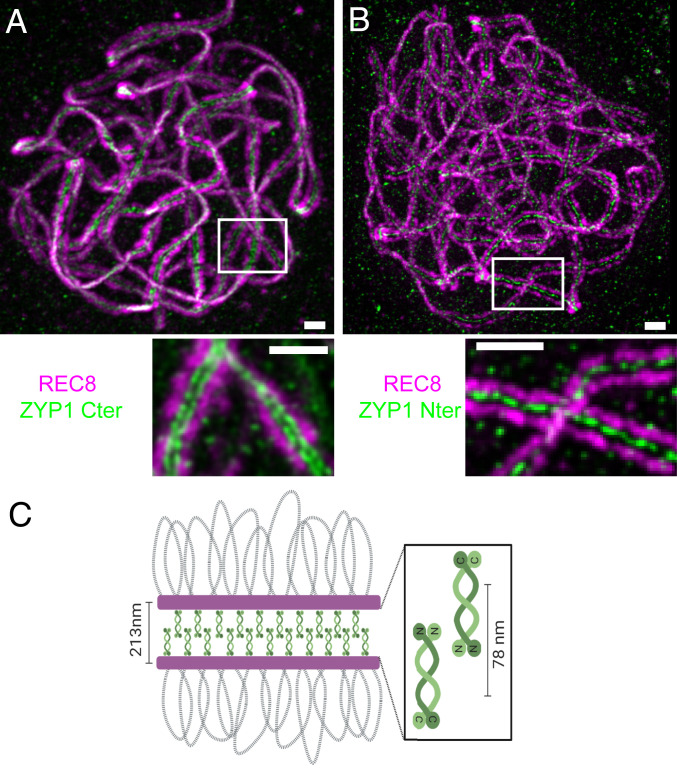
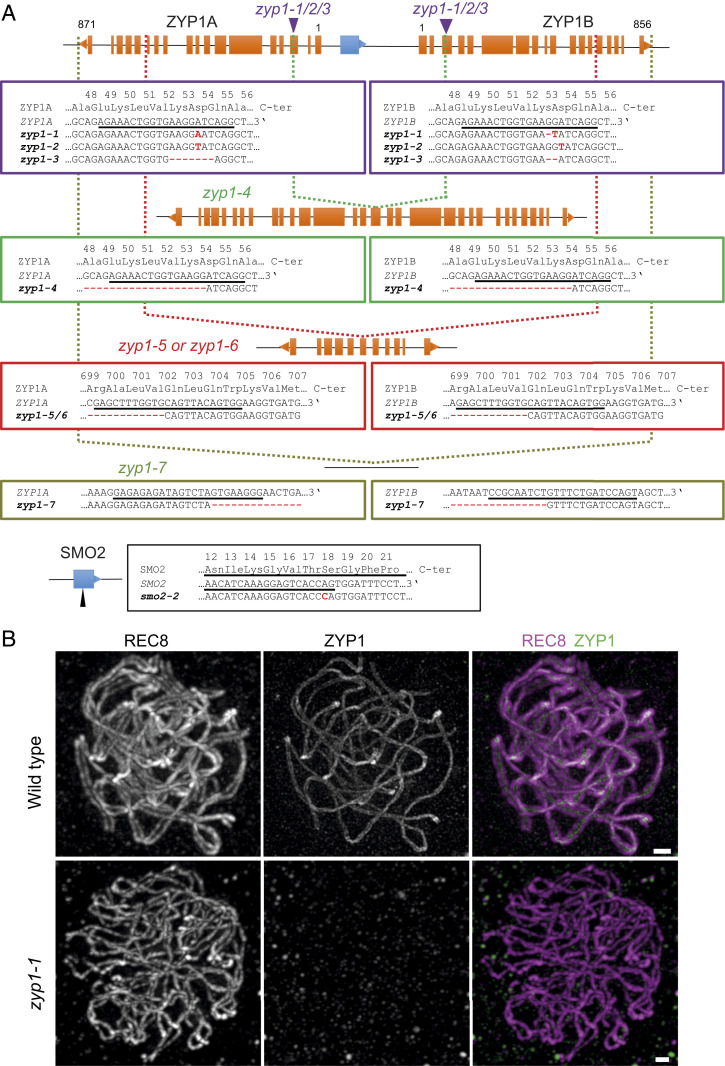
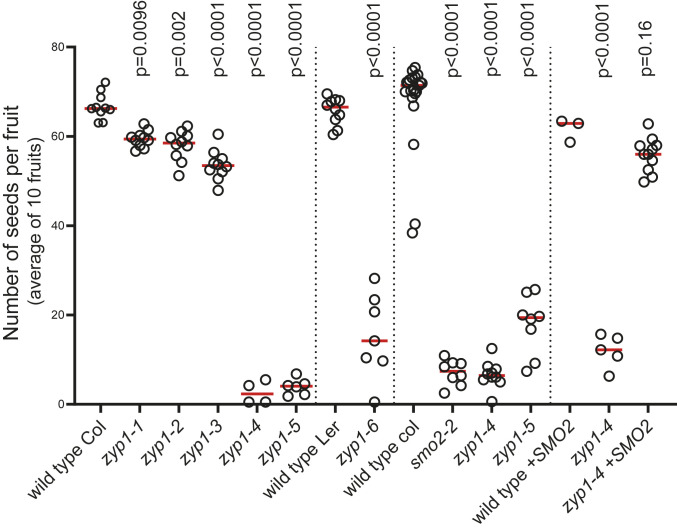
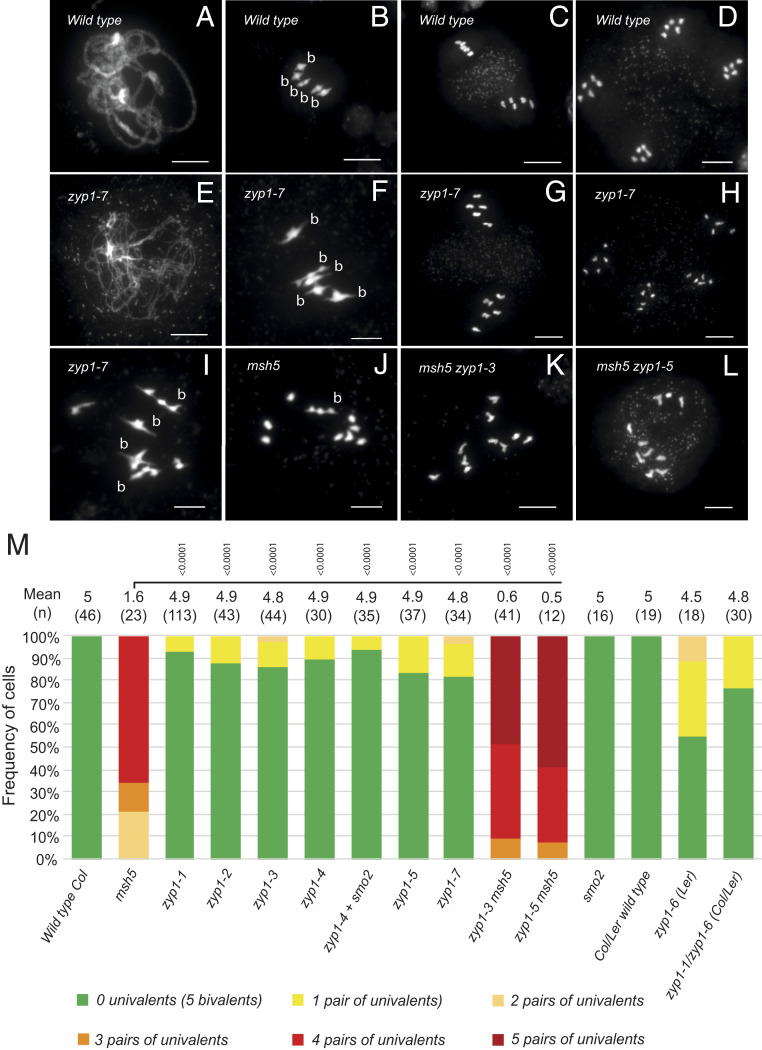
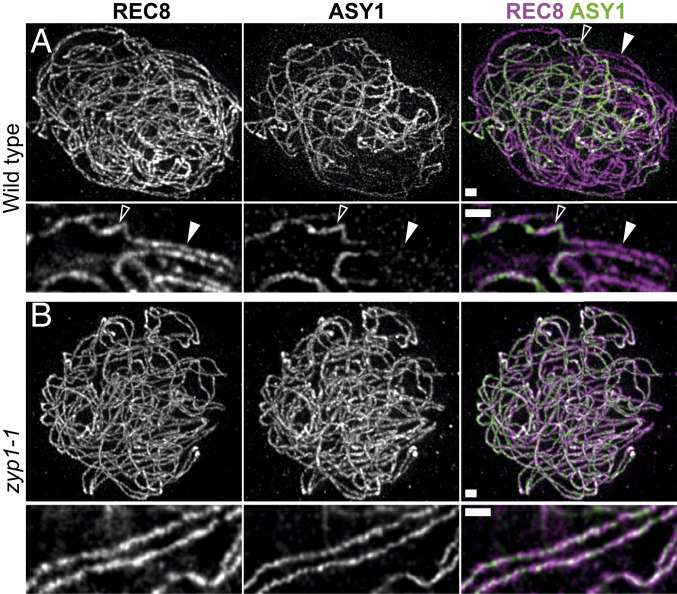
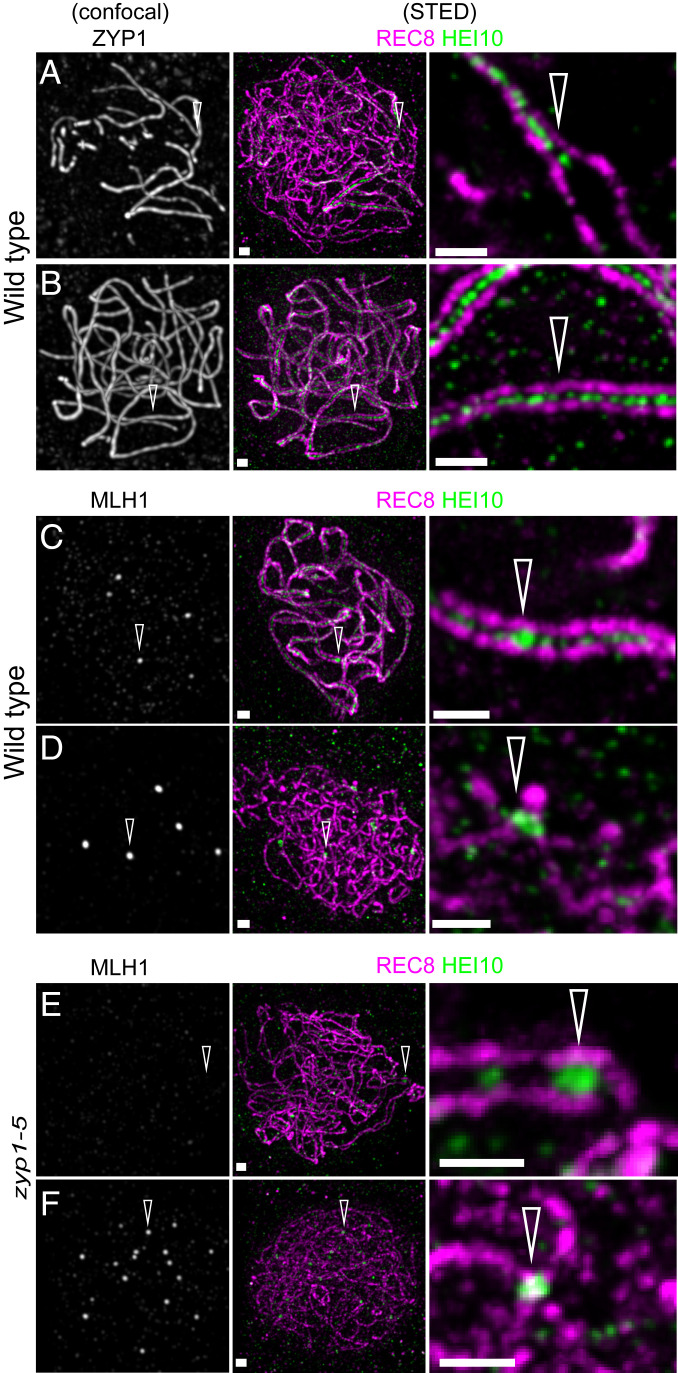
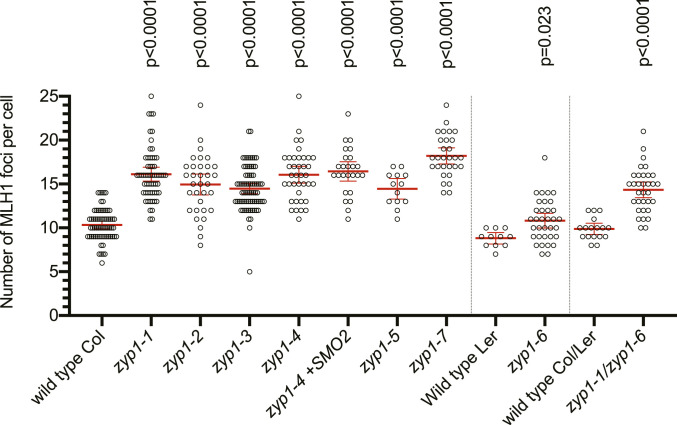
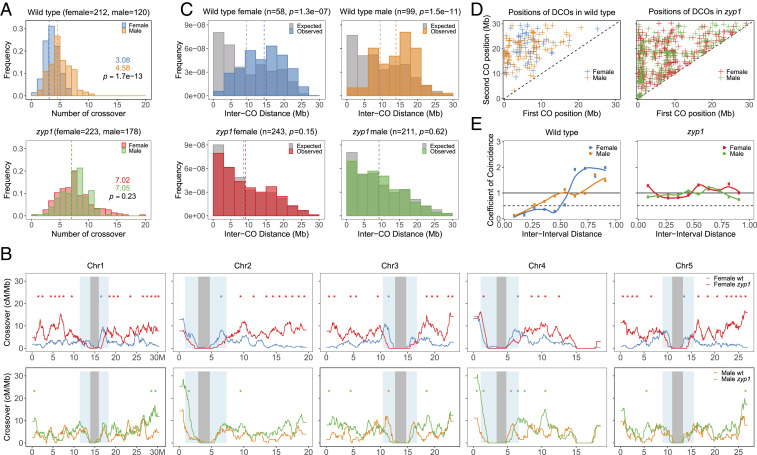
Meiotic crossovers (COs) have intriguing patterning properties, including CO interference, the tendency of COs to be well-spaced along chromosomes, and heterochiasmy, the marked difference in male and female CO rates. During meiosis, transverse filaments transiently associate the axes of homologous chromosomes, a process called synapsis that is essential for CO formation in many eukaryotes. Here, we describe the spatial organization of the transverse filaments in Arabidopsis (ZYP1) and show it to be evolutionary conserved. We show that in the absence of ZYP1 (zyp1azyp1b null mutants), chromosomes associate in pairs but do not synapse. Unexpectedly, in absence of ZYP1, CO formation is not prevented but increased. Furthermore, genome-wide analysis of recombination revealed that CO interference is abolished, with the frequent observation of close COs. In addition, heterochiasmy was erased, with identical CO rates in males and females. This shows that the tripartite synaptonemal complex is dispensable for CO formation and has a key role in regulating their number and distribution, imposing CO interference and heterochiasmy.

Keywords: crossover; heterochiasmy; interference; meiosis; synaptonemal complex.


Conflict of interest statement

The authors declare no competing interest.

Figures

Fig. 1.
Fig. 1.
Immunolocalization of the C and N termini of ZYP1 on male meiocytes. A double immunolocalization was performed against REC8 (purple) and ZYP1 (green). The ZYP1 antibody was raised against either the carboxyl (A) or N terminus (B) of the protein. The images were acquired with STED microscopy. The maximum intensity projection is shown. The complete series of plans is shown in Movies S1 and S2. (Scale bar, 0.5 µm.) (C) A schematic representation of the SC organization.
Fig. 2.
Fig. 2.
Identification of a series of zyp1a zyp1b double mutants. (A) A diagram of the ZYP1 locus, showing the exon organization of the ZYP1A, ZYP1B, and SMO2 genes. The orientations of the genes are indicated by a triangle at the end. The two purple arrows show the positions of the mutations in zyp1-1, zyp1-2, and zyp1-3. The green, red, and khaki vertical dotted lines show the position of the deletions in zyp1-4, zyp1-5/6, and zyp1-7, respectively. (B) ZYP1 is not detected in zyp1-1 mutant. A double immunolocalization was performed against REC8 (purple) and ZYP1 (green). The images at pachytene were acquired with STED microscopy. Maximum intensity projection: The individual plans are shown in Movies S3 and S4. (Scale bar, 0.5 µm.)
Fig. 3.
Fig. 3.
Analysis of fertility of zyp1 mutants. Each dot represents the fertility of an individual plant, measured as the number of seeds per fruit averaged on 10 fruits. The red bar shows the mean for a given genotype. The vertical lines separate independent experiments. In each experiment, all plants have been grown in parallel, and the wild-type controls are siblings of the mutants. The tests are one-way ANOVA followed by Fisher’s least significant difference (LSD) test compared with the respective wild-type control.
Fig. 4.
Fig. 4.
Chromosome spreads of male meiocytes. (AD) Wild type. (A) Pachytene, (B) Metaphase I with 5 bivalents, (C) Metaphase II, and (D) telophase II. (EI) zyp1-7. (E) Prophase I, (F) Metaphase I with five bivalents (B), (G) Metaphase II, (H) Telophase II, and (I) Metaphase I with four bivalents and one pair of univalents. (J) Metaphase I in msh5, (K) Metaphase I in msh5 zyp1-3, and (L) Metaphase I in msh5 zyp1-5. (Scale bar, 10 µm.) (M) Quantification of bivalents at metaphase I. Cells were categorized according to the number of pairs of univalents/bivalents. The average number of bivalents per cell and the number of analyzed cells are indicated above the bar. The tests are one-way ANOVA followed by Fisher’s LSD test compared with msh5.
Fig. 5.
Fig. 5.
REC8 and ASY1 localization in wild type and zyp1. A double immunolocalization was performed against REC8 (purple) and ASY1 (green). The images were acquired with STED microscopy. In wild-type zygotene (A), the ASY1 signal (green) is associated with unsynapsed axes. When the two REC8 axes (purple) are synapsed (aligned at ∼200 nm), the ASY1 signal is barely detectable. The open and closed arrows show unsynapsed and synapsed axes, respectively. (Scale bar, 0.5 µM.) In the zyp1 mutant (B), synapsis is not observed, but axes are paired with a loose alignment at ∼400 nM. See Movie S6 to visualize the pairing more clearly. The ASY1 signal is still present on aligned chromosomes. Maximum intensity projection: The individual plans are shown in Movies S5 and S6. (Scale bar, 0.5 µm.)
Fig. 6.
Fig. 6.
HEI10 localization in wild type and zyp1. A triple immunolocalization was performed against REC8 (purple), HEi10 (green), and either ZYP1 (A and B) or MLH1 (CF) on male meiocytes of wild type (AD) and zyp1-5 (E and F). REC8 and HEi10 were imaged with STED, while ZYP1 and MLH1 were imaged with confocal microscopy. (A) Wild-type zygotene nucleus: The arrow points at the synapsis forks. (B) Wild-type pachytene. (C) Wild-type late pachytene nucleus: The arrow points at MLH1-HEI10 foci. (D) Diplotene: The arrow points at MLH1–HEI10 foci. (E) Prophase stage with forming HEI10 foci, without corresponding MLH1 foci (arrow). (F) Prophase stage with HEI10–MLH1 foci (arrow). (Scale bar, 0.5 µm.)
Fig. 7.
Fig. 7.
MLH1–HEI10 foci are increased in zyp1 mutants. MLH1–HEI10 foci were quantified following a triple immunolocalization REC8–MLH1–HEI10 performed on male meiocytes and imaged with an epifluorescence microscope. Each dot is an individual cell, and the red bar is the mean. Tests are one-way ANOVA followed by Fisher’s LSD test, compared with the respective wild-type control. Fitting of the MLH1 number distribution to a Poisson distribution is shown in SI Appendix, Fig. S2.
Fig. 8.
Fig. 8.
Analysis of CO distribution in male and female zyp1. COs were detected following whole-genome sequencing of male and female backcrosses. (A) Distribution of CO number per gamete. The number of analyzed samples is indicated in brackets. The mean CO number per gamete is given and indicated by a dashed line. The difference was assessed by a two-sided Mann–Whitney test. The CO distribution per chromosome and fitting to a Poisson distribution is shown in SI Appendix, Fig. S3. (B) The distribution of COs along the five chromosomes. The centromere and pericentromeric regions are indicated by gray and blue shading, respectively. Analysis is done with 1-Mb windows and 50-kb sliding steps. Intervals with significant difference between wild type and mutants are indicated by stars (P < 0.05, not overlapping 1-Mb windows, Chi2 test, without correction for multiple testing). (C) Distribution of inter-CO distances for chromosomes having exactly two COs. The gray bars represent the expected distribution of COs in absence of interference, as calculated by permuting the CO positions between gametes. The number of analyzed events and the Mann–Whitney U test comparing observed and expected distributions are indicated in brackets. (D) The positions of first and second COs for double-CO pairs, according to their physical distance. By construction, close CO pairs appear next to the diagonal, and distant COs appear in the top left corner. (E) The CoC Curves. Chromosomes were divided into 11 intervals, and the mean CoC was calculated for pairs of intervals separated by a certain distance (proportion of chromosome length).

Comment in

  • Crossover interference: Just ZYP it.
    Crismani W, Girard C, Lloyd A. Crismani W, et al. Proc Natl Acad Sci U S A. 2021 Apr 27;118(17):e2103433118. doi: 10.1073/pnas.2103433118. Proc Natl Acad Sci U S A. 2021. PMID: 33785514 Free PMC article. No abstract available.

References

    1. Hunter N., Meiotic recombination: The essence of heredity. Cold Spring Harb. Perspect. Biol. 7, 1–35 (2015). - PMC - PubMed
    1. Muller H. J., The mechanism of crossing over II. Am. Nat. 50, 284–305 (1916).
    1. Zickler D., Kleckner N., A few of our favorite things: Pairing, the bouquet, crossover interference and evolution of meiosis. Semin. Cell Dev. Biol. 54, 135–148 (2016). - PMC - PubMed
    1. Mercier R., Mézard C., Jenczewski E., Macaisne N., Grelon M., The molecular biology of meiosis in plants. Annu. Rev. Plant Biol. 66, 297–327 (2015). - PubMed
    1. Zickler D., Kleckner N. E., Recombination, pairing, and synapsis of homologs during meiosis. Cold Spring Harb. Perspect. Biol. 7, a016626 (2015). - PMC - PubMed

Publication types