. 2021 Mar 23;118(12):e2025196118.
doi: 10.1073/pnas.2025196118.

Chromatin remodelers and lineage-specific factors interact to target enhancers to establish proneurosensory fate within otic ectoderm

Affiliations

Chromatin remodelers and lineage-specific factors interact to target enhancers to establish proneurosensory fate within otic ectoderm

Jinshu Xu et al. Proc Natl Acad Sci U S A. .

Abstract

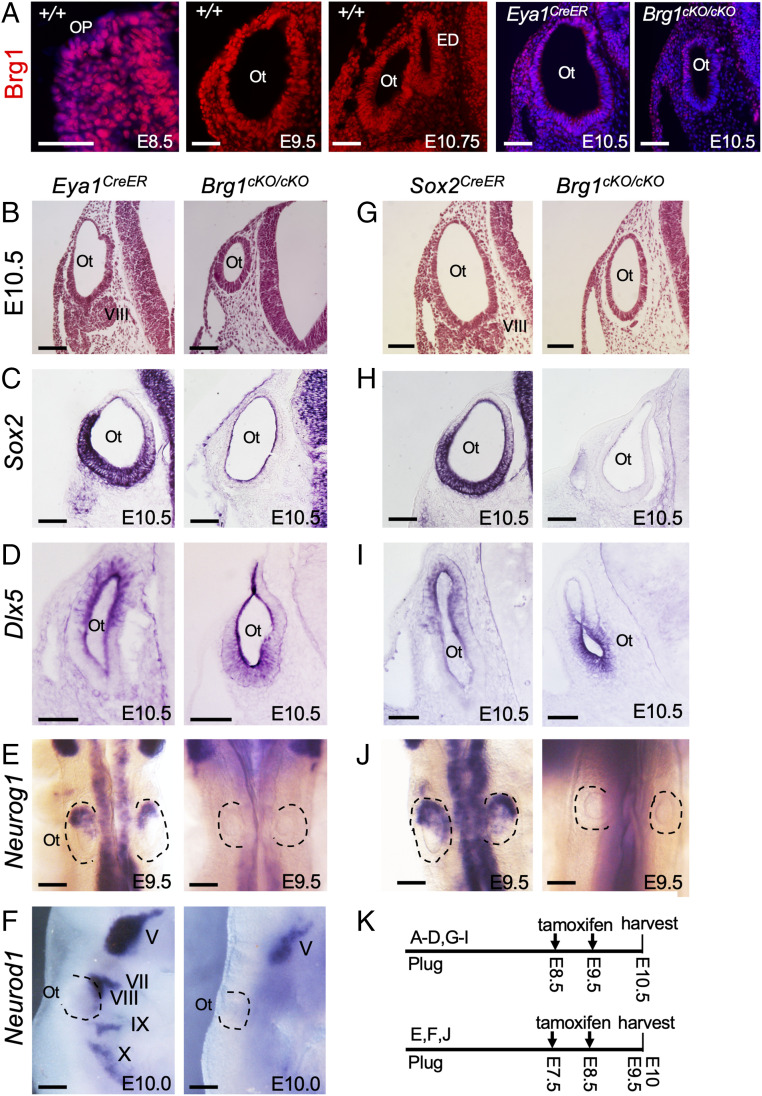
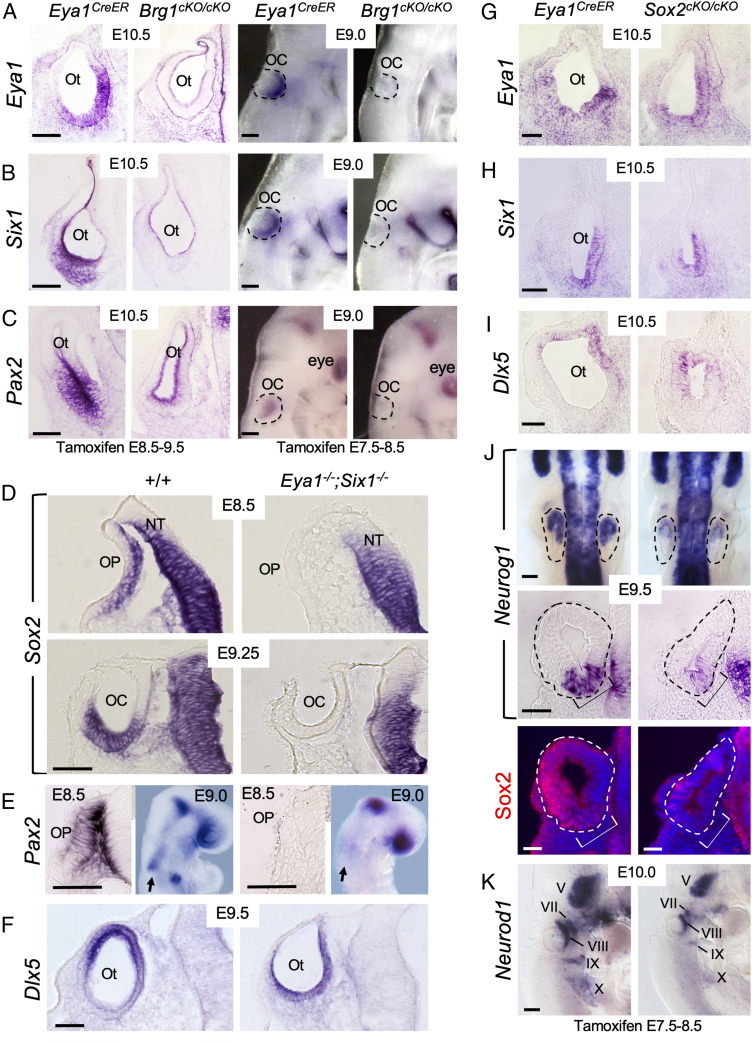
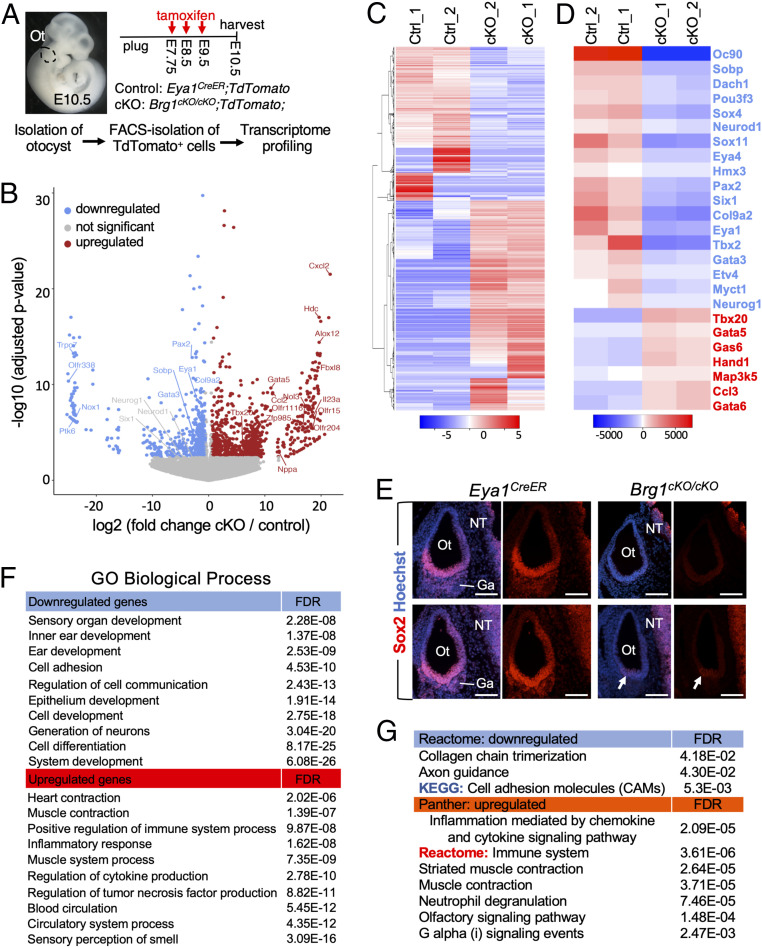
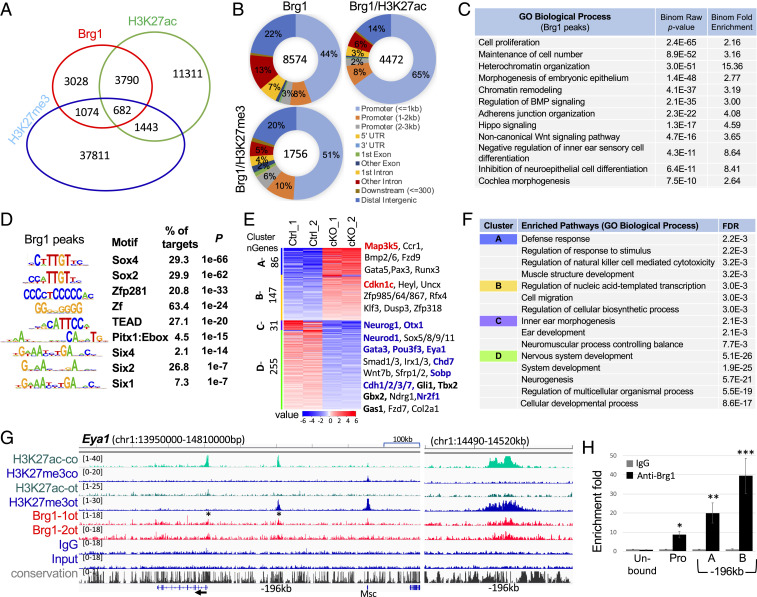
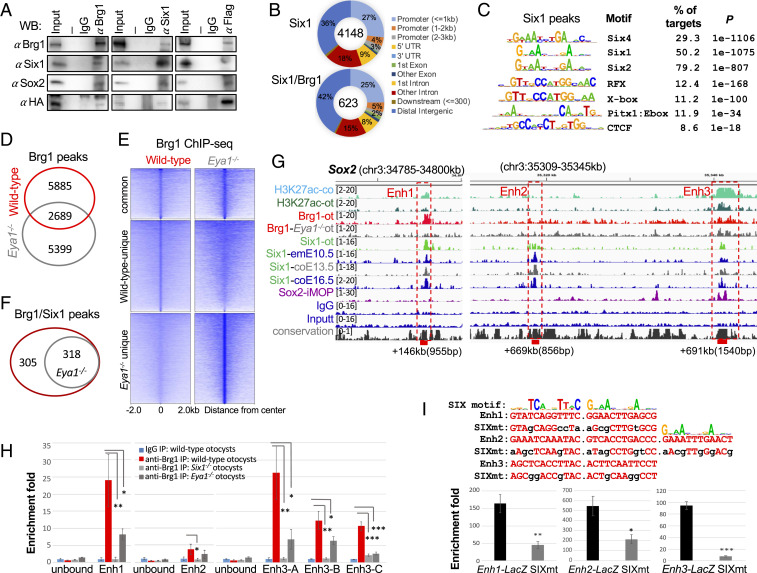
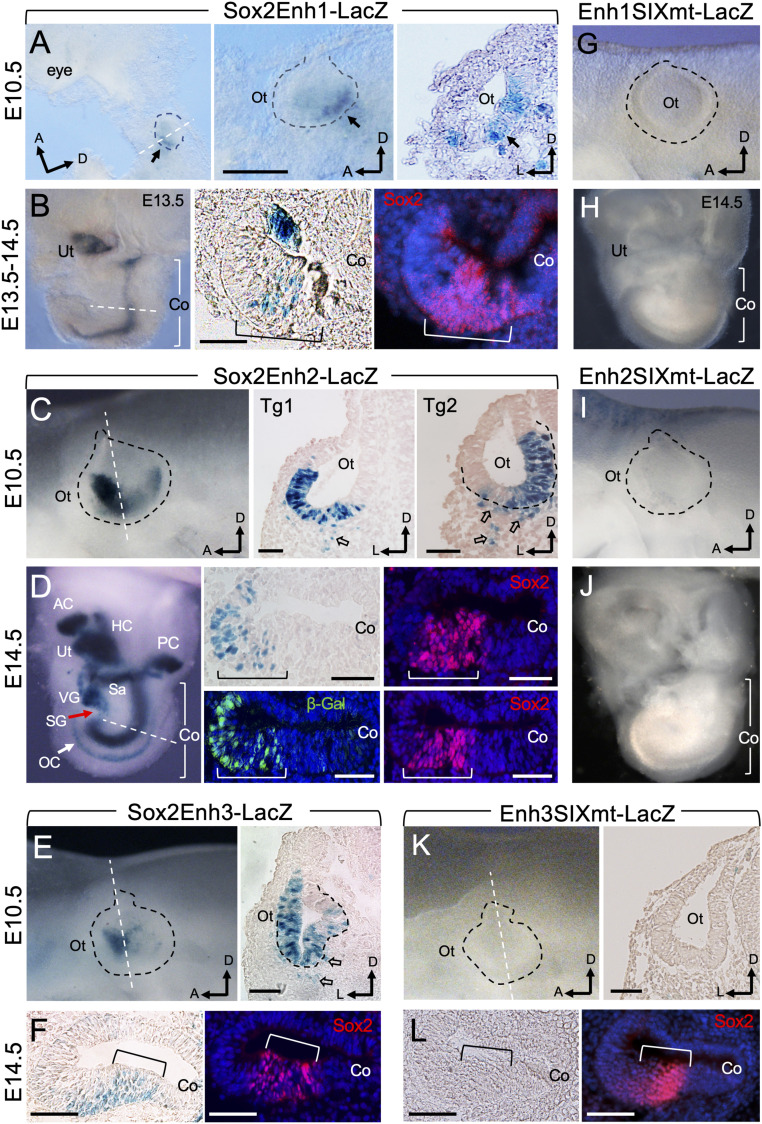
Specification of Sox2+ proneurosensory progenitors within otic ectoderm is a prerequisite for the production of sensory cells and neurons for hearing. However, the underlying molecular mechanisms driving this lineage specification remain unknown. Here, we show that the Brg1-based SWI/SNF chromatin-remodeling complex interacts with the neurosensory-specific transcriptional regulators Eya1/Six1 to induce Sox2 expression and promote proneurosensory-lineage specification. Ablation of the ATPase-subunit Brg1 or both Eya1/Six1 results in loss of Sox2 expression and lack of neurosensory identity, leading to abnormal apoptosis within the otic ectoderm. Brg1 binds to two of three distal 3' Sox2 enhancers occupied by Six1, and Brg1-binding to these regions depends on Eya1-Six1 activity. We demonstrate that the activity of these Sox2 enhancers in otic neurosensory cells specifically depends on binding to Six1. Furthermore, genome-wide and transcriptome profiling indicate that Brg1 may suppress apoptotic factor Map3k5 to inhibit apoptosis. Together, our findings reveal an essential role for Brg1, its downstream pathways, and their interactions with Six1/Eya1 in promoting proneurosensory fate induction in the otic ectoderm and subsequent neuronal lineage commitment and survival of otic cells.

Keywords: Sox2 enhancers; chromatin remodelers; otic neurosensory lineage; regulation of otic Sox2 expression; transcription factors.


Conflict of interest statement

The authors declare no competing interest.

Figures

Fig. 1.
Fig. 1.
Deletion of Brg1 using Eya1CreER or Sox2CreER in otic placode results in lack of neurosensory cell fate specification. Sections are transverse and dorsal is up. For whole-mount images, anterior is up. (A) Anti-Brg1 immunostaining on sections showing Brg1 expression in otic placode (Op) and otocyst (Ot). The Left is a merge of red and Hoechst nuclear staining. (Scale bars, 50 μm.) (B and G) H&E-stained sections of otocyst of Eya1CreER and Brg1cKO/cKO (Eya1CreER;Brg1fl/fl) or Sox2CreER and Brg1cKO/cKO (Sox2CreER;Brg1fl/fl). (Scale bars, 50 μm.) (C, D, H, and I) ISH on sections for Sox2 or Dlx5. (Scale bars, 50 μm.) (E, F, and J) Whole-mount ISH for Neurog1 (dorsal view, E and J) or Neurod1 (lateral view, F) in otic and cranial ganglia. (Scale bars, 120 μm.) (K) Schedules for tamoxifen administration. n = 6 embryos for each genotype. ED, endolymphatic duct; V to X, Vth to Xth cranial ganglion.
Fig. 2.
Fig. 2.
Brg1 is necessary for the expression of Eya1/Six1, both of which are necessary for the activation of Sox2 expression in otic ectoderm. Sections are transverse and dorsal is up. For whole-mount images, anterior is up. (AC) Left panels are section views of otic vesicle (Ot) and Right panels are whole-mount lateral views of invaginating otic placode (OP)/cup (OC) (outlined by dashed lines) showing ISH for Eya1, Six1, and Pax2. Note that sections were cut from ISH embryos. (Scale bars, 50 μm.) (D) Section ISH for Sox2. Note that Sox2 expression in the neural tube (NT) was not affected. (Scale bar, 50 μm.) (E) Section (E8.5) and whole-mount (E9.0, lateral view) ISH for Pax2. Arrows indicate Pax2 mRNA in otic ectoderm in wild-type and no detectable expression in Eya1−/−;Six1−/−. (Scale bars, 50 μm.) (F) Section ISH for Dlx5. (Scale bar, 50 μm.) (GJ) Deletion of Sox2 does not alter Eya1+Six1+ ventromedial (G and H) or Dlx5+ dorsal (I) region in the otocyst but leads to reduction in Neurog1 expression within the neurogenic domain (brackets) of the otocyt (dashed lines). Upper panels in J are dorsal views of whole-mount embryos, and Middle panels are section view. Bottom panels are dark-field images showing sections of the Middle panels coimmunostained with anti-Sox2. A few Sox2+ cells were observed in the dorsal region of the otocyst but not in the neurogenic Neurog1+ domain (brackets). (Scale bars, 50 μm for Bottom and 120 μm for Upper panels.) (K) Lateral view of whole-mount embryos stained for Neurod1 riboprobe. Note the reduction of Neurod1 in V-X ganglia is due to loss of Sox2. (Scale bars, 120 μm.).
Fig. 3.
Fig. 3.
Transcriptome analysis reveals the requirement of Brg1 for specifying otic neurosensory lineage and a repressive function of nonotic gene expression. (A) Schematic drawing of TdTomato+ cell isolation. Otocysts (n = 8) were isolated from control and Brg1cKO/cKO littermates (n = 4 for each genotype harvested from 3 pregnant females) and dissociated into single cells. Five thousand FACS-sorted TdTomato+ cells were used for each biological replicate (samples “1” and “2”). Magnification, 6×. (B) Volcano plot showing transcripts differentially responding to depletion of Brg1. (C and D) Heatmap showing expression of all 3,092 (C) or 25 selected (D) differentially expressed genes. Blue or red indicates down- or up-regulated genes in Brg1cKO/cKO. Twenty-five selected genes include otic genes (in blue) known to be important for neurosensory progenitor development and TFs critical for heart as well as apoptotic and inflammatory proteins (in red). (E) Anti-Sox2 immunostaining on sections at E10.5. Arrows point to weak Sox2 signal in a few cells in the ventral otocyst (Ot). No Sox2+ progenitors in VII–VIIIth ganglionic region (Ga) were detectable in Brg1cKO/cKO, but Sox2 expression in the neural tube (NT) is unaffected. Scale bars, 100 μm. (F and G) GO (F) and pathway (G) enrichment analysis for differentially expressed genes. Blue or red indicates down- or up-regulated genes. GO, Panther and reactome pathway annotation tools (geneontology.org), heatmap and KEGG pathway tools (bioinformatics.sdstate.edu).
Fig. 4.
Fig. 4.
Genome-wide occupancy by Brg1 in the otocyst. (A) Venn diagram indicating overlap of Brg1-binding sites and of H3K27ac or H3K27me3 deposition. (B) Pie charts (Galaxy toolkits) showing genomic distribution. UTR, untranslated region. (C) GREAT analysis showing association of Brg1-enriched regions with terms in GO database. (D) Sequence logos of the significantly enriched top motifs from Homer Known motif analysis, letter size indicates nucleotide frequency. Percent of target sites in Brg1 peaks with significance of motif occurrence (P value) are indicated. (E) Heatmap (Kmeans clustering) showing expression of 4 clusters of the 519 Brg1 target genes (identified in ChIP-seq datasets). Selected genes in each cluster were also listed on the right. Red or blue indicates up- or down-regulated genes. Several important genes related to apoptosis, cell-cycle or otic neurosensory cell development are shown in bold. (F) Kmeans GO enrichment analysis for each cluster of the 519 genes. (G) Genomic browser visualization of Brg1-bound sites at proximal-promoter and an upstream intergenic region at −196 kb of Eya1 (asterisks). Higher magnification of the −196-kb region on (Right) showing Brg1-enrichment with H3K27me3 deposition in the otocyst (ot) but with H3K27ac deposition in E13.5 cochlea (co). (H) ChIP-qPCR for the proximal-promoter and the −196-kb regions. “A” and “B” represent two different primer sets (SI Appendix, Table S3) within the peak region. Brg1 unbound region was used as a negative control. qPCR was performed in triplicates and repeated three times for each group. Data were normalized with mock IgG control, which was considered to be onefold. *P < 0.05, **P < 0.01, and ***P < 0.001.
Fig. 5.
Fig. 5.
Brg1 physically forms protein complex with Eya1/Six1 and Brg1 enrichment at distal 3′ Sox2 enhancer regions is disrupted in the absence of Eya1 or Six1. (A) CoIP analysis using nuclear extracts prepared from E10.5 otocysts of Eya1HA-Flag embryos. Anti-Brg1, -Flag, or -Six1 was used for IP and antibodies used for Western blot are indicated. Input was 5% of the amount used for IP. Row Western blots are shown in SI Appendix, Fig. S5A. (B) Pie charts showing genomic distribution of Six1-binding sites and its overlapping peaks with Brg1. (C) Sequence logos of the significantly enriched top motifs from Homer Known motif analysis, letter size indicates nucleotide frequency. Percent of target sites in Brg1 peaks with significance of motif occurrence (P value) are indicated. (D) Venn diagram indicating overlap of Brg1 sites in wild-type and Eya1−/− otocyst. (E) Heatmaps of Brg1 peaks shown in D within a −2-kb/+2-kb window centered on Brg1 peaks. (F) Venn diagram indicating overlap of sites cooccupied by Brg1/Six1. (G) Genome browser visualization of overlapping occupancy of H3K27ac, Brg1, Six1, and Sox2 to the three distal 3′ Sox2 enhancer elements (boxes). Samples used for comparison: H3K27ac-co, E13.5 cochleae; H3K27ac-ot, E10.5 otocysts (ot); Brg1-ot, E10.5 otocysts; Brg1-Eya1−/−-ot, Eya1−/− otocysts; Six1-ot, E10.5 otocysts; Six1-emE10.5, E10.5 embryos; Six1-coE13.5 or -coE16.5, E13.5 or E16.5 cochleae; Sox2-iMOP, immortalized iMOP. (H) ChIP-qPCR confirms Brg1-binding to the Enh1 to -3 regions in E10.5 otocyst and a large decrease in Brg1-enrichment in Eya1−/− or Six1−/− otocyst. Primers for two Brg1 unbound regions as negative controls and three different primer sets (SI Appendix, Table S3) within the Enh3 region (”A,” “B,” and “C”) were used for qPCR. qPCR was performed in triplicates and the enrichment of mock IP (IgG) was considered onefold. *P < 0.05, **P < 0.01, and ***P < 0.001 determined by Student’s t test. (I) Sox2 Enh1 and Enh3 contain two SIX motifs, while Enh2 has three SIX motifs. Mutations introduced into the predicted SIX-motifs for each enhancer is indicated. Six1-binding to these reporters were assessed by ChIP-qPCR using chromatin prepared from 293 cells cotransfected with His-Six1 expression plasmid and each reporter, respectively. The enrichment of mock IP was considered onefold. *P < 0.05, **P < 0.01, and ***P < 0.001 determined by Student’s t test.
Fig. 6.
Fig. 6.
Brg1/Six1-bound 3′ Sox2 distal enhancers direct overlapping or complimentary patterns of expression in otic neurosensory cells in response to binding of Six1. (AF) X-gal–stained G0 transgenic embryo at E10.5 (A, C, and E) or inner ear at E14.5 (B, D, and F) of each transgene driven by Sox2 Enh1-3. E14.5 cochlear sections were stained with anti-Sox2 (red) to label the prosensory domain (brackets). Otocysts are outlined by black dashed line and orientation of anterior (a), dorsal (d), or lateral (l) is indicated. Dashed white lines indicate regions where sections were generated. (A) Left and Center (higher-magnification panel) are whole-mount and Right is section view showing β-Gal+ cells (arrows) in the otocyst (Ot). Scale bar, 200 μm. (B) Whole inner ear (Left) showing β-Gal+ cells in the utricle (Ut) and cochlea (Co) sensory epithelium, which is marked by Sox2 on cochlear sections (Center and Right). Note that diffuse Sox2 staining was due to longer duration of the samples in the X-gal staining solution, which contains detergents that may cause leakage of nuclear proteins. (C) Whole-mount (Left) and section (Center and Right) view showing β-Gal+ cells in the ventral region of the otocyst (Ot) with strong activity in the anterior neurogenic domain. Open arrows point to migratory neuroblast progenitors. (D) Whole-mount inner ear (Left) and section (Center and Right) view showing β-Gal+ cells in all neurosensory structures. Arrow points to the cochlear organ of Corti. (E) Whole-mount (Left) and section (Right) view showing β-Gal activity in the otocyst (Ot) with stronger activity in the anterior neurogenic domain. Open arrows point to migratory neuroblasts. (F) Sections of Enh3-LacZ cochlea (Co) costained with anti-Sox2. (GK) X-gal–stained G0 transgenic embryo at E10.5 (G, I, and K) or inner ear at E14.5 (H, J, and L) of each transgene driven by the different SIXmt enhancer. Transgenic lines: Enh1SIXmt, E10.5 (n = 4) and E14.5 (n = 5); Enh2SIXmt, E10.5 (n = 5) and E14.5 (n = 4); Enh3SIXmt, E10.5 (n = 3) and E14.5 (n = 3). (GJ) Whole-mount views of E10.5 otocyst or E14.5 inner ear. (K) Whole-mount (Left) or section (Right) view of otocyst (K) or cochlear sections (L). All transgenic lines showed consistent expression in the sensory progenitors. (Scale bars, 50 μm.)

References

    1. Wong E. Y., Ahmed M., Xu P. X., EYA1-SIX1 complex in neurosensory cell fate induction in the mammalian inner ear. Hear. Res. 297, 13–19 (2013). - PMC - PubMed
    1. Ma Q., Chen Z., del Barco Barrantes I., de la Pompa J. L., Anderson D. J., neurogenin1 is essential for the determination of neuronal precursors for proximal cranial sensory ganglia. Neuron 20, 469–482 (1998). - PubMed
    1. Ma Q., Anderson D. J., Fritzsch B., Neurogenin 1 null mutant ears develop fewer, morphologically normal hair cells in smaller sensory epithelia devoid of innervation. J. Assoc. Res. Otolaryngol. 1, 129–143 (2000). - PMC - PubMed
    1. Macova I., et al., Neurod1 is essential for the primary tonotopic organization and related auditory information processing in the midbrain. J. Neurosci. 39, 984–1004 (2019). - PMC - PubMed
    1. Kim W. Y., et al., NeuroD-null mice are deaf due to a severe loss of the inner ear sensory neurons during development. Development 128, 417–426 (2001). - PMC - PubMed

Publication types

MeSH terms