. 2021 Mar 23;118(12):e2026336118.
doi: 10.1073/pnas.2026336118.

The aryl hydrocarbon receptor facilitates the human cytomegalovirus-mediated G1/S block to cell cycle progression

Affiliations

The aryl hydrocarbon receptor facilitates the human cytomegalovirus-mediated G1/S block to cell cycle progression

Pooya Naseri-Nosar et al. Proc Natl Acad Sci U S A. .

Abstract

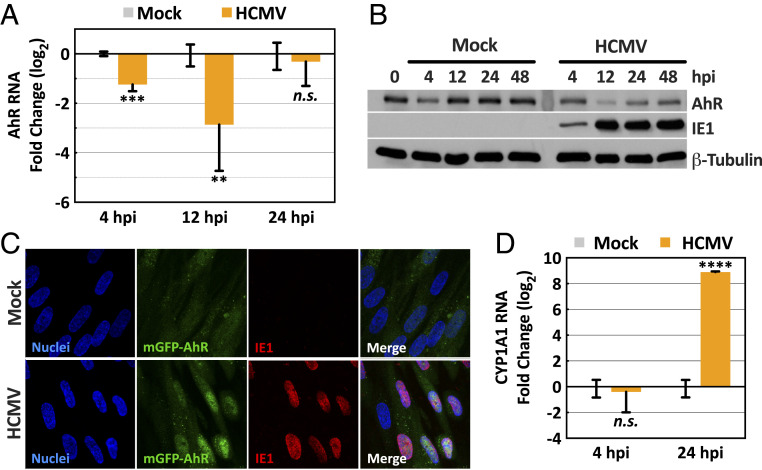
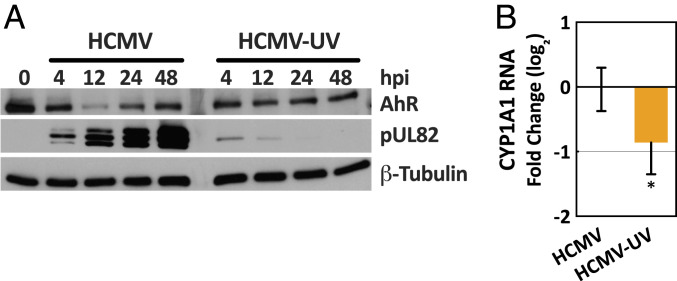
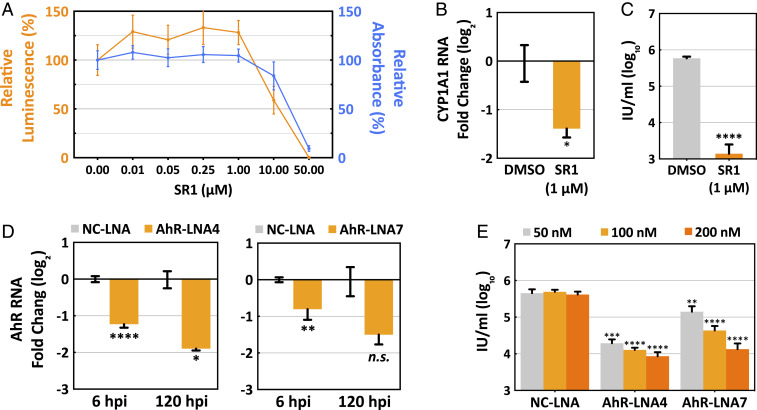
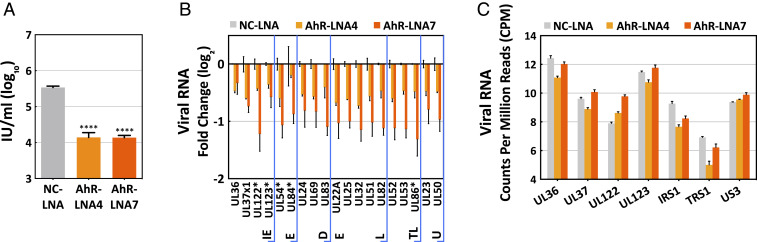
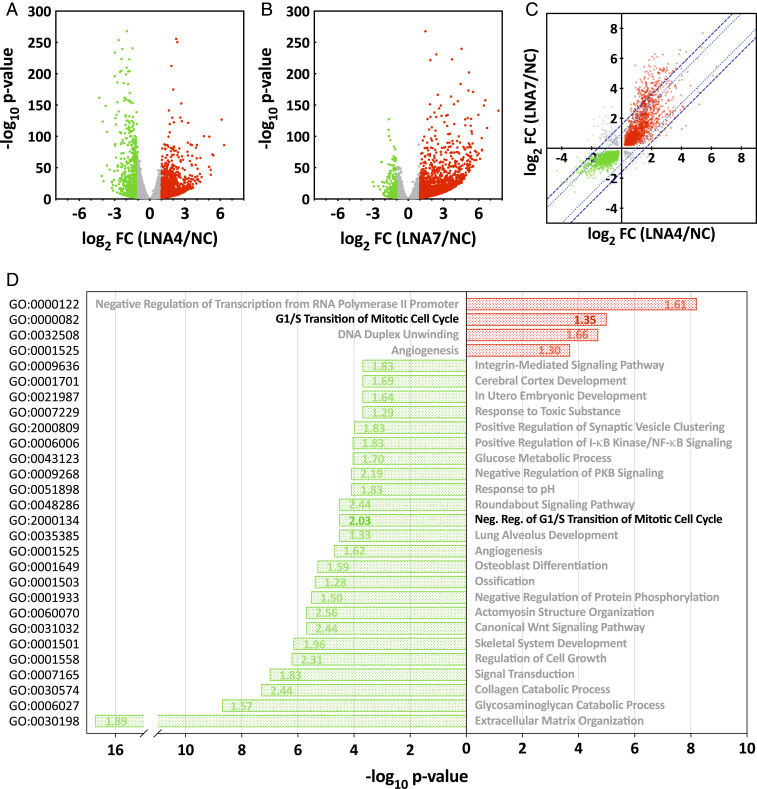
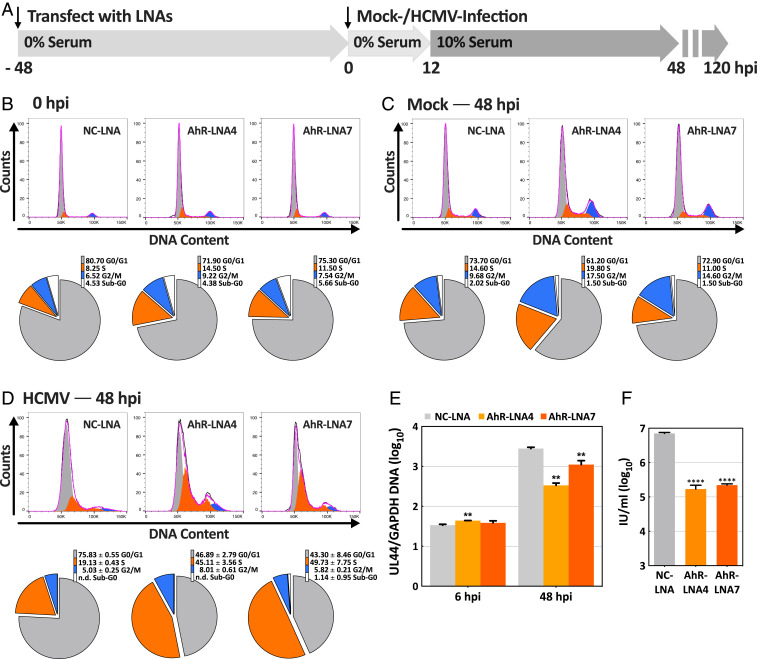
The tryptophan metabolite, kynurenine, is known to be produced at elevated levels within human cytomegalovirus (HCMV)-infected fibroblasts. Kynurenine is an endogenous aryl hydrocarbon receptor (AhR) ligand. Here we show that the AhR is activated following HCMV infection, and pharmacological inhibition of AhR or knockdown of AhR RNA reduced the accumulation of viral RNAs and infectious progeny. RNA-seq analysis of infected cells following AhR knockdown showed that the receptor alters the levels of numerous RNAs, including RNAs related to cell cycle progression. AhR knockdown alleviated the G1/S cell cycle block that is normally instituted in HCMV-infected fibroblasts, consistent with its known ability to regulate cell cycle progression and cell proliferation. In sum, AhR is activated by kynurenine and perhaps other ligands produced during HCMV infection, it profoundly alters the infected-cell transcriptome, and one outcome of its activity is a block to cell cycle progression, providing mechanistic insight to a long-known element of the virus-host cell interaction.

Keywords: aryl hydrocarbon receptor; cell cycle; human cytomegalovirus; kynurenine.


Conflict of interest statement

The authors declare no competing interest.

Figures

Fig. 1.
Fig. 1.
HCMV infection of fibroblasts modulates AhR expression and activity. Confluent HFFs were starved in serum-free medium for 48 h, and then mock infected or infected at a multiplicity of 3 IU/cell. (A) Modulation of AhR RNA levels by HCMV. Cultures were harvested at the indicated times and AhR RNA was quantified relative to actin RNA by RT-qPCR assay with infected normalized to mock-infected samples (n = 2, assayed in triplicate). (B) Modulation of AhR protein levels by HCMV. Cultures were harvested at the indicated times and AhR protein was quantified by immunoblot assay. IE1 was monitored as a marker of infection and β-tubulin served as a loading control. (C) Accumulation of AhR in the nuclei of HCMV-infected cells. Cells were fixed at 16 hpi and mGFP-tagged AhR fluorescence was monitored. Infected cells were identified by indirect immunofluorescence assay of the viral IE1 protein, and nuclei were counterstained using Hoechst 33342 dye (representative of three independent experiments). (D) Induction of AhR-responsive CYP1A1 RNA by HCMV. Cultures were harvested at the indicated times and CYP1A1 RNA was quantified relative to actin RNA by RT-qPCR assay with infected normalized to mock-infected samples (n = 2, assayed in triplicate). All RT-qPCR data, normalized to mock-infected samples, are shown as mean ± SD; **P < 0.01; ***P < 0.001; ****P < 0.0001; n.s., not significant (unpaired Student’s t test).
Fig. 2.
Fig. 2.
HCMV gene expression is required to activate AhR. Confluent HFFs were starved in serum-free medium for 48 h, and then mock infected or infected at a multiplicity of 3 IU/cell. (A) Modulation of AhR protein levels by HCMV but not UV-inactivated HCMV (HCMV-UV). Cultures were harvested at the indicated times and AhR protein was quantified by immunoblot assay. pUL82 was monitored as a marker of infection and β-tubulin served as a loading control. (B) Induction of AhR-responsive CYP1A1 RNA by HCMV versus HCMV-UV. Cultures were harvested at 24 hpi and CYP1A1 RNA was quantified relative to actin RNA by RT-qPCR assay with HCMV-UV-infected normalized to HCMV-infected samples. Data are shown as mean ± SD (n = 3, assayed in triplicate); *P < 0.05 (unpaired Student’s t test).
Fig. 3.
Fig. 3.
AhR supports the efficient production of HCMV progeny. Confluent HFFs were starved in serum-free medium for 48 h before the initiation of experiments. (A) Toxicity of the AhR inhibitor, SR1. Serum-starved HFFs were treated with DMSO (1% wt/wt) and increasing concentrations of SR1 in DMSO. After 96 h, cell viability (orange) and cell proliferation (blue) were monitored (n = 4). (B) SR1 (1 μM) inhibits CYP1A1 RNA accumulation. Serum-starved HFFs were infected at a multiplicity of 3 IU/cell, drug or solvent was added 2 h post viral absorption, and 24 h later cells were harvested and CYP1A1 RNA was quantified relative to actin RNA by RT-qPCR assay with drug-treated normalized to DMSO-treated samples (n = 3, assayed in triplicate). (C) SR1 (1 μM) reduces HCMV yield at 96 hpi. Serum-starved HFFs were infected at a multiplicity of 1 IU/cell, drug or solvent was added at 2 h post viral absorption, and cell-free virus was assayed (n = 3, assayed in triplicate). (D) LNAs reduce AhR RNA levels. Serum-starved HFFs were treated with nonspecific control NC-LNA (200 nM), AhR-LNA4 (100 nM, Left) or AhR-LNA7 (200 nM, Right) for 48 h, then infected and harvested for analysis of AhR RNA by RT-qPCR at the times indicated. (E) AhR-specific LNAs reduce HCMV yield at 120 hpi. Serum-starved HFFs were treated with LNAs at indicated concentrations for 48 h, then infected at a multiplicity of 1 IU/cell, and cell-free virus was assayed (n = 3, assayed in triplicate). Data are shown as mean ± SD; *P < 0.05; **P < 0.01; ***P < 0.001; ****P < 0.0001; n.s., not significant (unpaired Student’s t test).
Fig. 4.
Fig. 4.
AhR supports efficient accumulation of HCMV RNAs during the late but not immediate-early phase of infection. (A) Treatment with AhR-specific (LNA4 and LNA7), but not nonspecific control (NC) LNAs, reduce HCMV yield at 120 hpi. Serum-starved HFFs were treated with NC-LNA and LNA7 at 200 nM and LNA4 at 100 nM for 48 h, then infected at a multiplicity of 3 IU/cell, and cell-free virus was assayed (n = 3, assayed in triplicate). (B) Treatment with AhR-specific LNAs reduce the accumulation of HCMV RNAs at 120 hpi. Serum-starved HFFs were infected at a multiplicity of 3 IU/cell, and viral RNAs were quantified relative to peptidylprolyl isomerase A (PPIA) RNA by RT-qPCR assay with AhR-specific LNA normalized to nonspecific LNA samples (n = 2, assayed in triplicate). Kinetic classes of viral RNAs are designated: IE, immediate early; E, early; DE, delayed early; L, late; TL, true late; U, unclassified. RNAs marked with an asterisk are coded by genes that do not contain a potential XRE/DRE motif in their known regulatory regions. (C) Treatment with AhR-specific LNAs does not perturb the accumulation of HCMV immediate-early RNAs at 6 hpi. Serum-starved HFFs were infected at a multiplicity of 3 IU/cell, and viral RNAs were quantified by RNA-seq analysis. Data are shown as mean ± SD; ****P < 0.0001 (unpaired Student’s t test).
Fig. 5.
Fig. 5.
AhR modulates the HCMV infected-cell transcriptome. (A and B) Volcano plots showing the effect of AhR KD with two different AhR-specific LNAs. Fibroblasts were transfected with an AhR-specific LNA (A, LNA4 or B, LNA7) or a nonspecific control LNA (NC), and maintained in serum-free medium for 48 h, after which cultures were infected with HCMV at a multiplicity of 3 IU/cell. At 6 hpi, poly(A)+ RNA was prepared from infected cells and subjected to RNA-seq analysis (n = 2). Fold-change ratios (AhR-LNA/NC-LNA) and P values were determined. RNAs with a significant (P < 0.01) change of ≥ 2-fold in their expression levels are depicted by red (elevated) and green (lowered) dots; RNAs that did not meet these criteria are gray. (C) Fold change of cell-coded transcripts with significantly altered expression levels (q < 0.01) were plotted for LNA4- versus LNA7-treated cultures. RNAs with a significant (q < 0.01) change in their expression levels are depicted by red (elevated in response to both LNAs), green (lowered in response to both LNAs) and gray dots (LNAs generated opposing changes). The dotted (light blue) and dashed (dark blue) lines show the thresholds for two- and threefold variance between the AhR-KD LNA treatments, respectively. (D) Bar graph showing enriched biological process gene ontology terms of differentially expressed genes following treatment with AhR-specific LNAs. Green bars show GOs enriched within the group of transcripts negatively affected by AhR knockdown and red bars show GOs enriched within the group of transcripts up-regulated in AhR knockdown cells. The numbers within bars report the AhR target gene fold-enrichment values. Data are derived from the RNA-seq results presented in AC.
Fig. 6.
Fig. 6.
AhR facilitates the HCMV-induced cell cycle block in fibroblasts. (A) Experimental plan. After treatment with AhR-specific LNA (LNA4 or LNA7) or a nonspecific control LNA (NC) for 48 h in serum-free medium, HFFs were mock-infected or HCMV-infected at a multiplicity of 3 IU/cell and fed with serum-free medium. At 12 hpi, cultures were refed with medium containing 10% serum. Cell cycle distributions were determined at 48 h after mock- or HCMV-infection by staining DNA with propidium iodide and flow cytometry. (B) Cell cycle analysis of uninfected fibroblasts following treatment with LNAs for 48 h in serum-free medium (n = 1). Flow cytometry data (Upper) and pie charts showing the percentages of cells in different cell cycle compartments (Lower) are displayed. (C) Cell cycle analysis of LNA-treated fibroblasts that were mock infected in serum-free medium and maintained in medium with 10% serum from 12 to 48 h after mock infection (n = 1). (D) Cell cycle analysis of LNA-treated fibroblasts that were infected with HCMV in serum-free medium and maintained in medium with 10% serum from 12 to 48 hpi (n = 3). The pie charts report the averages of three determinations; n.d., not detected. (E) Control experiment monitoring the relative amounts of cell versus viral DNA in infected cells following knockdown of AhR. Cells harvested at 48 hpi were infected and fed with serum-free medium, refed with medium containing 10% serum at 12 hpi. Viral UL44 and host GAPDH DNA copy numbers were quantified by qPCR (n = 3). (F) Control experiment monitoring HCMV yield following knockdown of AhR. Cells were infected and fed with serum-free medium, refed with medium containing 10% serum at 12 hpi and cell-free virus was assayed at 120 hpi (n = 3). **P < 0.01; ****P < 0.0001. Unpaired Welch and Student’s t test were used in E and F, respectively.

References

    1. Britt W. J., Maternal immunity and the natural history of congenital human cytomegalovirus infection. Viruses 10, 405 (2018). - PMC - PubMed
    1. Griffiths P., Baraniak I., Reeves M., The pathogenesis of human cytomegalovirus. J. Pathol. 235, 288–297 (2015). - PubMed
    1. Cobbs C., Cytomegalovirus is a tumor-associated virus: Armed and dangerous. Curr. Opin. Virol. 39, 49–59 (2019). - PubMed
    1. Shenk T., Alwine J. C., Human cytomegalovirus: Coordinating cellular stress, signaling, and metabolic pathways. Annu. Rev. Virol. 1, 355–374 (2014). - PubMed
    1. Rodríguez-Sánchez I., Munger J., Meal for two: Human cytomegalovirus-induced activation of cellular metabolism. Viruses 11, 273 (2019). - PMC - PubMed

Publication types