. 2021 Mar 15;11(1):171.
doi: 10.1038/s41398-021-01290-1.

Transcriptome alterations are enriched for synapse-associated genes in the striatum of subjects with obsessive-compulsive disorder

Affiliations

Transcriptome alterations are enriched for synapse-associated genes in the striatum of subjects with obsessive-compulsive disorder

Sean C Piantadosi et al. Transl Psychiatry. .

Abstract

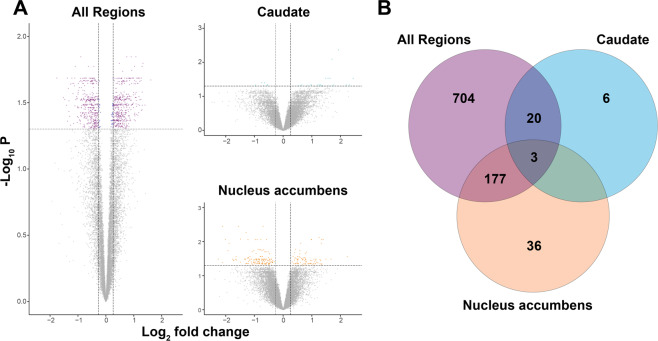
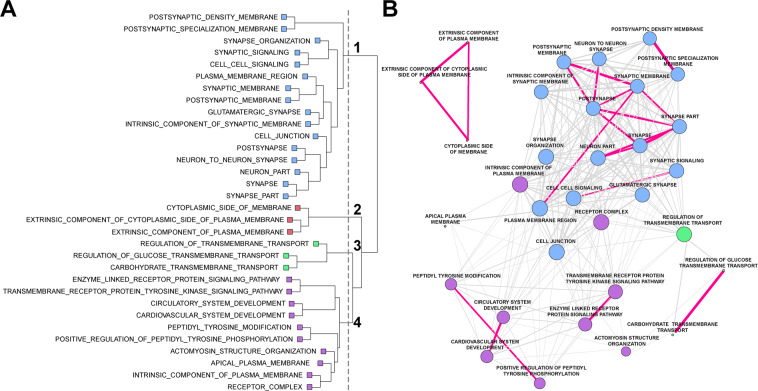
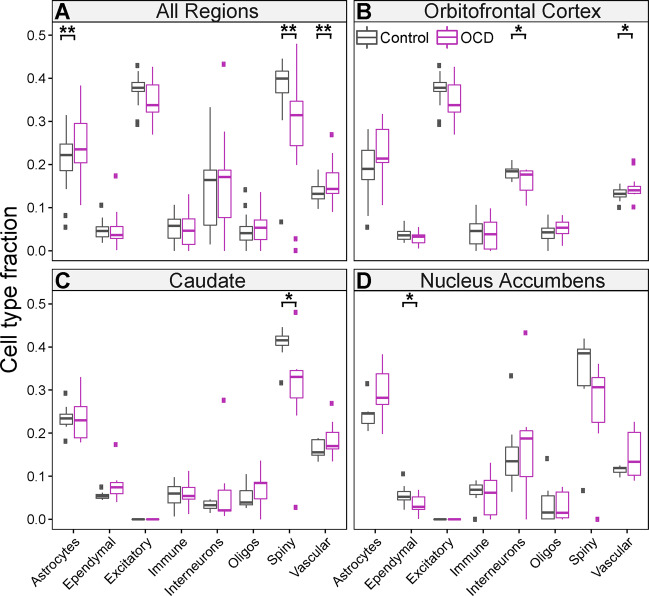
Obsessive-compulsive disorder (OCD) is a chronic and severe psychiatric disorder for which effective treatment options are limited. Structural and functional neuroimaging studies have consistently implicated the orbitofrontal cortex (OFC) and striatum in the pathophysiology of the disorder. Recent genetic evidence points to involvement of components of the excitatory synapse in the etiology of OCD. However, the transcriptional alterations that could link genetic risk to known structural and functional abnormalities remain mostly unknown. To assess potential transcriptional changes in the OFC and two striatal regions (caudate nucleus and nucleus accumbens) of OCD subjects relative to unaffected comparison subjects, we sequenced messenger RNA transcripts from these brain regions. In a joint analysis of all three regions, 904 transcripts were differentially expressed between 7 OCD versus 8 unaffected comparison subjects. Region-specific analyses highlighted a smaller number of differences, which concentrated in caudate and nucleus accumbens. Pathway analyses of the 904 differentially expressed transcripts showed enrichment for genes involved in synaptic signaling, with these synapse-associated genes displaying lower expression in OCD subjects relative to unaffected comparison subjects. Finally, we estimated that cell type fractions of medium spiny neurons were lower whereas vascular cells and astrocyte fractions were higher in tissue of OCD subjects. Together, these data provide the first unbiased examination of differentially expressed transcripts in both OFC and striatum of OCD subjects. These transcripts encoded synaptic proteins more often than expected by chance, and thus implicate the synapse as a vulnerable molecular compartment for OCD.


Conflict of interest statement

D.A.L. currently receives investigator-initiated research funding from Pfizer and Merck and serves as a consultant to Astellas. S.C.P., L.L.M., L.K., J.W., B.L.C., S.A.S., B.D., and S.E.A. declare no conflicts of interest.

Figures

Fig. 1
Fig. 1. Volcano plots of differentially expressed genes between obsessive-compulsive disorder (OCD) subjects and unaffected comparison subjects.
RNA sequencing was performed on post-mortem brain tissue originating from Brodmann areas 11 and 47 (OFC), the caudate, and the nucleus accumbens of 7 OCD subjects and 8 unaffected comparison subjects. A Left panel: differentially expressed genes were determined for all brain regions analyzed together. Upper right panel: differentially expressed genes in caudate. Lower right panel: differentially expressed genes in nucleus accumbens. The y-axis represents the (−log10P-value) and the x-axis represents the gene expression log2fold change. Vertical dashed lines (±0.26 log2 fold change) indicate gene expression differences between OCD subject and unaffected comparison subject cohorts, where upregulated genes are positive and downregulated genes are negative. The horizontal line demarcates significantly different gene expression differences between OCD subjects and unaffected comparison subjects (false discovery rate q-value <0.05; purple (≥0.26 or ≤ −0.26 log2 fold change)/blue (≤0.26 and ≥ −0.26 log2 fold change) dots = significant, gray dots = non-significant). Note: the volcano plot for the cortical regions (Brodmann areas 11 and 47) is shown in Fig. S3. B Venn diagram depicting the overlapping differentially expressed genes between all brain regions (purple), caudate (cyan), and nucleus accumbens (orange). There were no overlapping differentially expressed genes at the intersection between caudate and nucleus accumbens.
Fig. 2
Fig. 2. Gene set enrichment analysis for obsessive-compulsive disorder (OCD).
Following RNA sequencing, global differentially expressed genes were determined between OCD subjects and unaffected comparison subjects (904 genes). Significant gene sets from the gene ontology (GO) pathways were determined using Fisher’s exact test. A Gene co-occurrence cluster dendrogram for gene set enrichment in OCD. Following gene set enrichment analysis, the number of co-occurring genes among the GO pathways were assessed. Four main branches were identified on the basis of the cut-point (vertical gray dashed line) established by visual inspection and color-coded per branch (blue: cluster 1; red: cluster 2, green: cluster 3, purple: cluster 4). B Cluster plot of gene sets associated with OCD. Genes were assessed using hierarchical clustering on the distances computed per gene set. The edges (lines) connecting nodes indicate the number of co-occurring OCD genes, where magenta lines have at least half of the genes co-occurring between the nodes (gene pathways), and gray lines indicate less than half of the OCD genes were co-occurring. Co-occurring genes were defined as the fraction of genes present in two pathways given the total number of unique genes represented in both pathways. The thickness of the magenta lines indicates more (thicker) or less (thinner) gene co-occurrence between two given gene sets. Note, the length of connecting vertices does not indicate distance between nodes.
Fig. 3
Fig. 3. Cell type fractions in OCD subjects and unaffected comparison subjects.
Cell type fractions were determined across all brain regions for OCD subjects (purple) and unaffected comparison subjects (grey) separately. Gene expression patterns in single-cell data were used to estimate the fraction of eight broadly defined cell types: astrocytes, ependymal cells, excitatory neurons, immune cells, interneurons, oligodendrocytes, medium spiny neurons (a.k.a. spiny projection neurons), and vascular cells. A Cell type fractions for global analysis (combined OFC, caudate, and nucleus accumbens). B Cell type fractions in the OFC, C Caudate, and D Nucleus accumbens. Boxplots are displayed, where ** indicates p < 0.01 and * indicates p < 0.05 (uncorrected for multiple comparisons). The mean cell type fractions were computed based on all four brain regions; however, when the cell type did not exist in the brain region, it was not included in the calculation. Thus, the mean cell type fraction for the excitatory neurons was based only on the cortical regions and the mean cell type fraction for spiny projection neurons was based on the caudate and nucleus accumbens regions.

References

    1. Koran LM, et al. Practice guideline for the treatment of patients with obsessive-compulsive disorder. Am. J. Psychiatry. 2007;164:5–53. - PubMed
    1. Koran LM, Thienemann ML, Davenport R. Quality of life for patients with obsessive-compulsive disorder. Am. J. Psychiatry. 1996;153:783–788. doi: 10.1176/ajp.153.6.783. - DOI - PubMed
    1. Koran LM. Quality of life in obsessive-compulsive disorder. Psychiatr. Clin. North Am. 2000;23:509–517. doi: 10.1016/S0193-953X(05)70177-5. - DOI - PubMed
    1. Pauls DL, et al. Obsessive-compulsive disorder: an integrative genetic and neurobiological perspective. Nat. Rev. Neurosci. 2014;15:410–424. doi: 10.1038/nrn3746. - DOI - PubMed
    1. Pittenger C, et al. Clinical treatment of obsessive compulsive disorder. Psychiatry (Edgmont) 2005;2:34–43. - PMC - PubMed

Publication types