. 2021 Mar 15;7(1):53.
doi: 10.1038/s41420-021-00438-8.

Sirt1 coordinates with ERα to regulate autophagy and adiposity

Affiliations

Sirt1 coordinates with ERα to regulate autophagy and adiposity

Zhipeng Tao et al. Cell Death Discov. .

Erratum in

Abstract

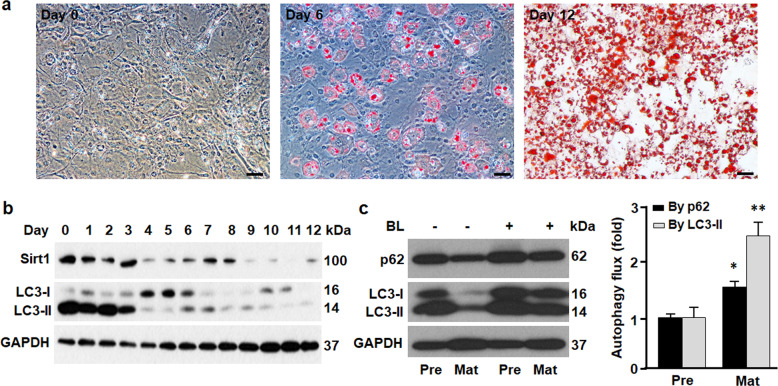
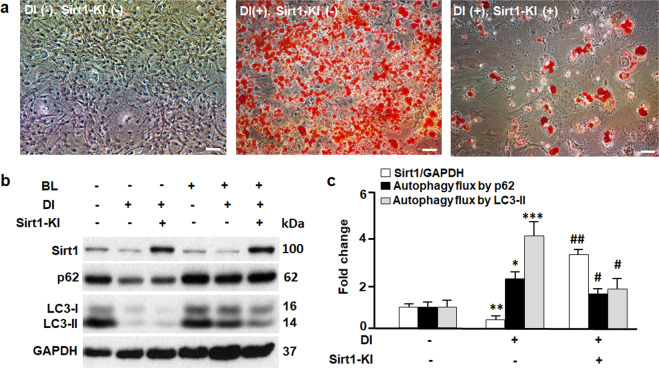
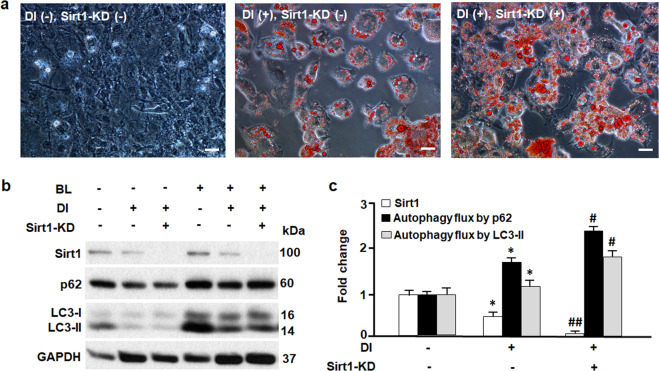
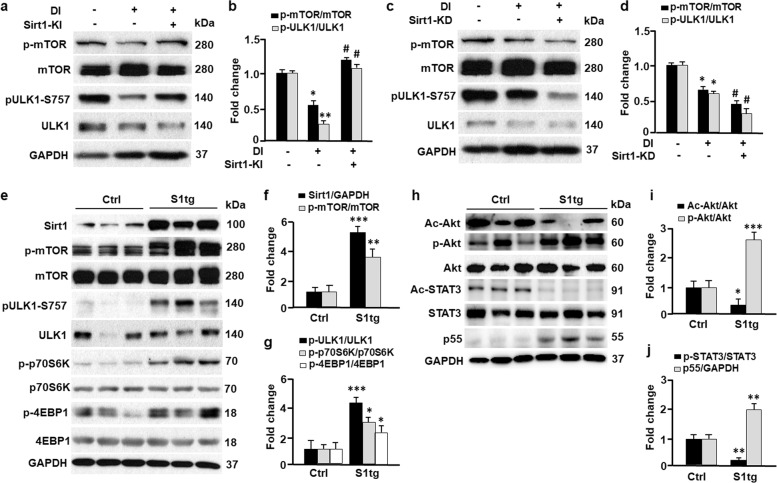
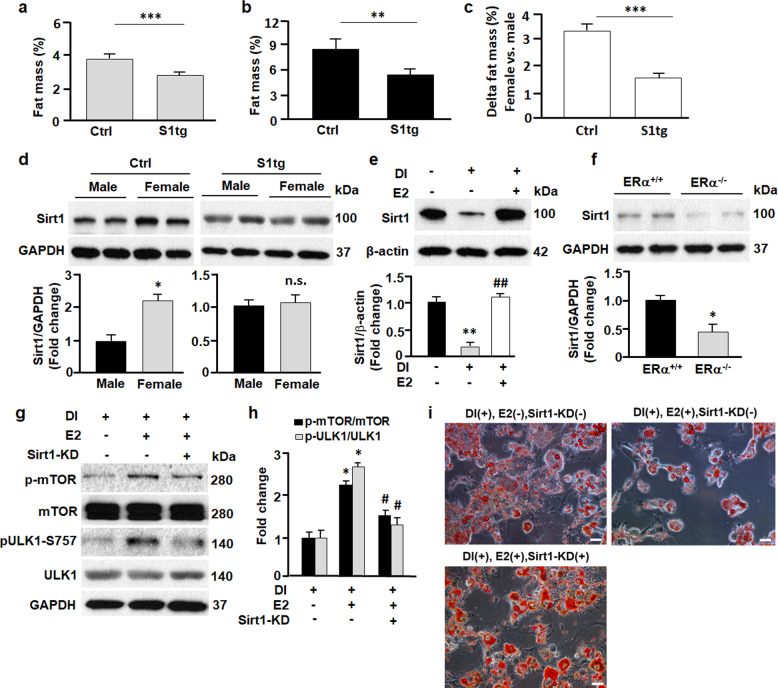
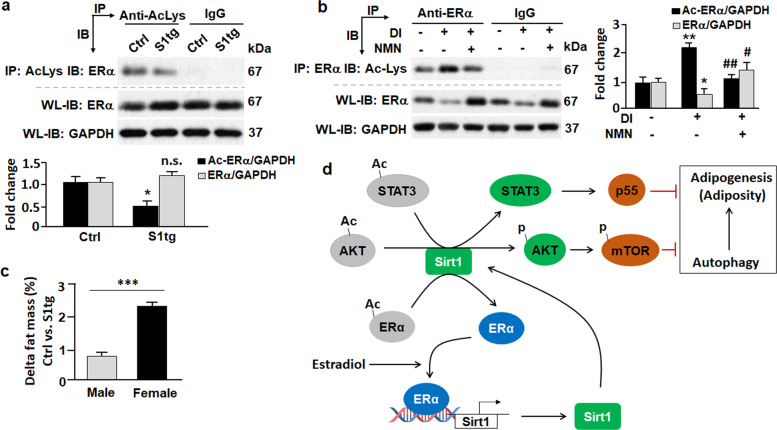
Sex difference in adiposity has long been recognized but the mechanism remains incompletely understood. Previous studies suggested that adiposity was regulated by autophagy in response to energy status change. Here, we show that the energy sensor Sirt1 mediates sex difference in adiposity by regulating autophagy and adipogenesis in partnership with estrogen receptor α (ERα). Autophagy and adipogenesis were suppressed by Sirt1 activation or overexpression, which was associated with reduced sex difference in adiposity. Mechanistically, Sirt1 deacetylated and activated AKT and STAT3, resulting in suppression of autophagy and adipogenesis via mTOR-ULK1 and p55 cascades. ERα induced Sirt1 expression and inhibited autophagy in adipocytes, while silencing Sirt1 reversed the effects of ERα on autophagy and promoted adipogenesis. Moreover, Sirt1 deacetylated ERα, which constituted a positive feedback loop in the regulation of autophagy and adiposity. Our results revealed a new mechanism of Sirt1 regulating autophagy in adipocytes and shed light on sex difference in adiposity.


Conflict of interest statement

The authors declare no competing interests.

Figures

Fig. 1
Fig. 1. Adipogenesis was associated with downregulation of Sirt1 and activation of autophagy.
a Oil red O staining of 3T3L1 cells during differentiation, showing the data of day 0 (preadipocyte), day 6 (differentiating adipocyte), and day 12 (differentiated or mature adipocyte). Scale bar, 50 µm. b Western blotting analysis of Sirt1 and LC3 proteins during 3T3L1 cell differentiation. GAPDH was probed as a loading control. c Autophagy flux was determined by contrasting the rates of removing the substrates LC3-II and p62 by autophagy in the absence and presence of autophagy inhibitors BL (bafilomycin A1 at 0.1 μM and leupeptin at 10 μg/ml). Pre, preadipocyte; Mat, mature adipocyte. *p < 0.05; **p < 0.01. n = 8.
Fig. 2
Fig. 2. The effects of gain of Sirt1 on autophagy and adipogenesis.
a Oil red O staining of 3T3L1 cells on day 12, in the absence (−) or presence (+) of differentiation inducer (DI) and Sirt1 knock-in or overexpression (Sirt1-KI). Scale bar, 50 µm. b Western blotting analysis of Sirt1, p62, and LC3 proteins. GAPDH was probed as a loading control. Autophagy inhibitors bafilomycin A1 at 0.1 μM and leupeptin at 10 μg/ml (BL) were used to treat the cells and measure the turnover of autophagic substrates p62 and LC3-II (i.e., autophagy flux activities). c Densitometric analyses of Sirt1 and autophagy flux. Comparing DI(−)Sirt1-KI(−) with DI(+)Sirt1-KI(−): *p < 0.05; **p < 0.01; ***p < 0.001. Comparing DI(+)Sirt1-KI(−) with DI(+)Sirt1-KI(+): #p < 0.05; ##p < 0.01. n = 8.
Fig. 3
Fig. 3. The effects of loss of Sirt1 on autophagy and adipogenesis.
a Oil red O staining of 3T3L1 cells on day 9, in the absence (−) or presence (+) of differentiation inducer (DI) and Sirt1 knock-down (Sirt1-KD). Scale bar, 100 µm. b Western blotting analysis of Sirt1, p62, and LC3 proteins. GAPDH was probed as a loading control. Autophagy inhibitors bafilomycin A1 at 0.1 μM and leupeptin at 10 μg/ml (BL) were used to treat the cells and measure the turnover of autophagic substrates p62 and LC3-II (i.e., autophagy flux activities). c Densitometric analyses of Sirt1 and autophagy flux. Comparing DI(−)Sirt1-KD(−) with DI(+)Sirt1-KD(−): *p < 0.05. Comparing DI(+)Sirt1-KD(−) with DI(+)Sirt1-KD(+): #p < 0.05; ##p < 0.01. n = 8.
Fig. 4
Fig. 4. Sirt1 suppressed autophagy by activating AKT-mTOR and STAT3-p55 pathways.
a, b The effects of Sirt1 knock-in (Sirt1-KI) on the mTOR-ULK1 cascade were measured by Western blotting (a) and densitometric analyses (b). Control and Sirt1-KI 3T3L1 cells were treated with differentiation inducer (DI), and the cells were harvested on day 12 for Western blotting analysis. GAPDH was probed as a loading control. Comparing DI(−)Sirt1-KI(−) with DI(+)Sirt1-KI(−): *p < 0.05; **p < 0.01. Comparing DI(+)Sirt1-KI(−) with DI(+)Sirt1-KI(+): #p < 0.05. n = 8. c, d The effects of Sirt1 knock-down (Sirt1-KD) on the mTOR-ULK1 cascade were determined by Western blotting (c) and densitometric analyses (d). Control and Sirt1-KD 3T3L1 cells were treated with differentiation inducer (DI), and cells were harvested on day 9 for Western blotting analysis. Comparing DI(−)Sirt1-KD(−) with DI(+)Sirt1-KD(−): *p < 0.05. Comparing DI(+)Sirt1-KD(−) with DI(+)Sirt1-KD(+): #p < 0.05. n = 8. eg The effects of Sirt1 on mTOR and downstream targets (ULK1, p70S6K, and 4EBP1) in inguinal adipose tissues were determined by Western blotting (e) and densitometric analyses (f, g). S1tg, Sirt1 transgenic mice; Ctrl, control mice. Comparing Ctrl with S1tg mice: *p < 0.05; **p < 0.01; ***p < 0.001. n = 6. hj The effects of Sirt1 on protein kinase B (AKT) and signal transducer and activator of transcription 3 (STAT3) in inguinal adipose tissues were determined by Western blotting (h) and densitometric analyses (ij). Ac-Akt, acetylated Akt; Ac-STAT3, acetylated STAT3. Comparing Ctrl with S1tg mice: *p < 0.05; **p < 0.01; ***p < 0.001. n = 6.
Fig. 5
Fig. 5. Sirt1 regulated sex difference in adiposity.
a, b Fat mass in male (a) and female (b) mice. **p < 0.01; ***p < 0.001; n = 6–10. c Sex difference (females vs males) in adiposity was greater in Ctrl mice compared to S1tg mice. ***p < 0.001; n = 6–10. d Sirt1 expression in inguinal adipose tissues was analyzed by Western blotting and densitometric analyses. *p < 0.05; n.s., not significant; n = 6. e The effects of estradiol (E2, 0.1 μM) on Sirt1 in 3T3L1 cells were analyzed by Western blotting and densitometric analyses. β-actin was probed as a loading control. **p < 0.01 by comparing DI(−)E2(−) with DI(+)E2(−). ##p < 0.01 by comparing DI(+)E2(−) with DI(+)E2(+). n = 8. f The effects of estrogen receptor α knockout (ERα−/−) on Sirt1 in inguinal adipose tissues were analyzed by Western blotting and densitometric analyses. GAPDH was probed as a loading control. *p < 0.05 by comparing estrogen receptor α knockout (ERα/) mice with wild type (ERα+/+) mice. n = 8. g The effects of E2 (0.1 μM) and Sirt1 knockdown (Sirt1-KD), alone or combined, on mTOR-ULK1 cascade (day 9). Western blotting (g) and densitometric analyses (h) were employed to determine the effects. *p < 0.05 by comparing DI(+)E2(−)Sirt1-KD(−) with DI(+)E2(+)Sirt1-KD(−). #p < 0.05 by comparing DI(+)E2(+)Sirt1-KD(−) with DI(+)E2(+)Sirt1-KD(+). n = 8. i The effects of E2 and Sirt1-KD, alone or combined, on adipogenesis (day 9). Scale bar, 100 µm.
Fig. 6
Fig. 6. Sirt1-induced deacetylation of ERα and reduction of adiposity in mice.
a Effects of Sirt1 overexpression on ERα acetylation in mice. Upper, acetylated ERα was analyzed by immunoprecipitation (IP) with an anti-acetylated lysine (anti-acLys) antibody that pulled down acetylated proteins, followed by immunoblot (IB) with an anti-ERα antibody. Normal rabbit IgG (non-specific IgG) was used as negative control. Middle, whole lysates (WL) were analyzed by IB with anti-ERα and anti-GAPDH antibodies. Lower, densitometric analyses were used to quantify acetylated and total ERα in control (Ctrl) and Sirt1 transgenic (S1tg) mice. *p < 0.05; n = 8. b Effects of Sirt1 activator nicotinamide mononucleotide (NMN, 100 µM) on ERα acetylation in 3T3L1 cells. Left-upper, acetylated ERα was analyzed by IP with an anti-ERα antibody that pulled down ERα protein, followed by IB with an anti-acetylated lysine (anti-acLys) antibody. Normal rabbit IgG (non-specific IgG) was used as the negative control. Left-lower, whole lysates (WL) were analyzed by IB with anti-ERα and anti-GAPDH antibodies. Right, densitometric analyses were used to quantify acetylated and total ERα in 3T3L1 cells. DI, differentiation inducer. *p < 0.05 and **p < 0.01 by comparing DI(−) NMN(−) with DI(+) NMN(−). #p < 0.05 and ##p < 0.01 by comparing DI(+) NMN(−) with DI(+) NMN(+). n = 8. c Sirt1-induced reduction of adiposity was greater in female than in male mice. ***p < 0.001; n = 6–10. d A schematic view of Sirt1 coordinating with ERα to regulate autophagy and adipogenesis (adiposity).

References

    1. Mizushima N, Komatsu M. Autophagy: renovation of cells and tissues. Cell. 2011;147:728–741. - PubMed
    1. Boya, P., Codogno, P. & Rodriguez-Muela, N. Autophagy in stem cells: repair, remodelling and metabolic reprogramming. Development145, 10.1242/dev.146506 (2018). - PubMed
    1. Cheng Z. The FoxO-autophagy axis in health and disease. Trends Endocrinol. Metab.: TEM. 2019;30:658–671. - PubMed
    1. Singh R, et al. Autophagy regulates adipose mass and differentiation in mice. J. Clin. Investig. 2009;119:3329–3339. - PMC - PubMed
    1. Zhang Y, et al. Adipose-specific deletion of autophagy-related gene 7 (atg7) in mice reveals a role in adipogenesis. Proc. Natl Acad. Sci. USA. 2009;106:19860–19865. - PMC - PubMed

LinkOut - more resources