. 2021 Mar 15;9(1):17.
doi: 10.1038/s41413-021-00141-5.

Mapping the immune microenvironment for mandibular alveolar bone homeostasis at single-cell resolution

Affiliations

Mapping the immune microenvironment for mandibular alveolar bone homeostasis at single-cell resolution

Weimin Lin et al. Bone Res. .

Abstract

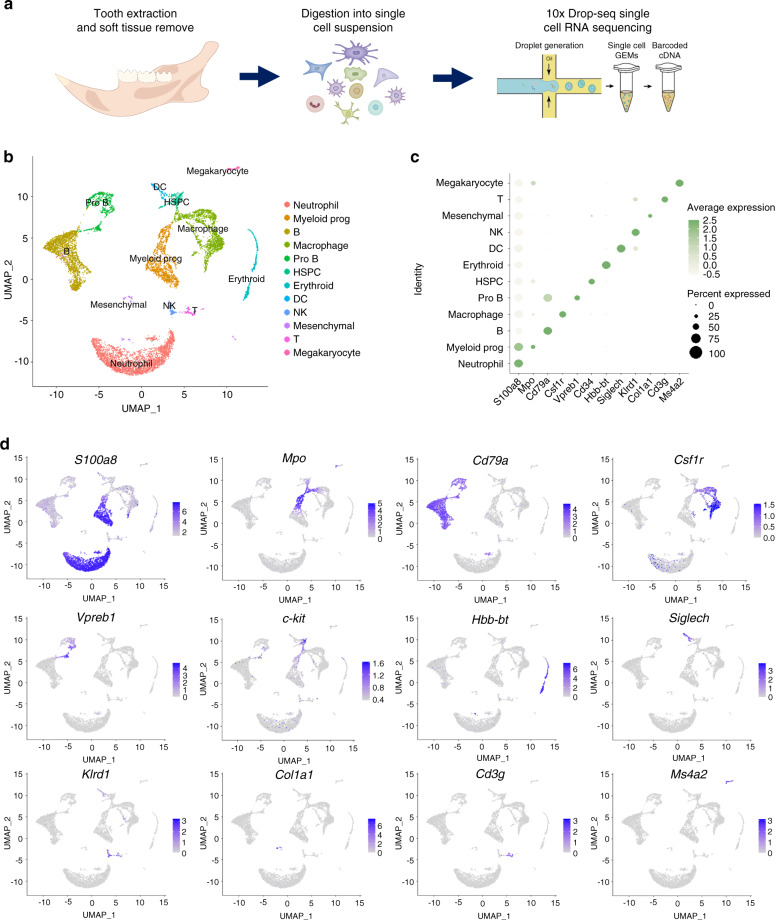
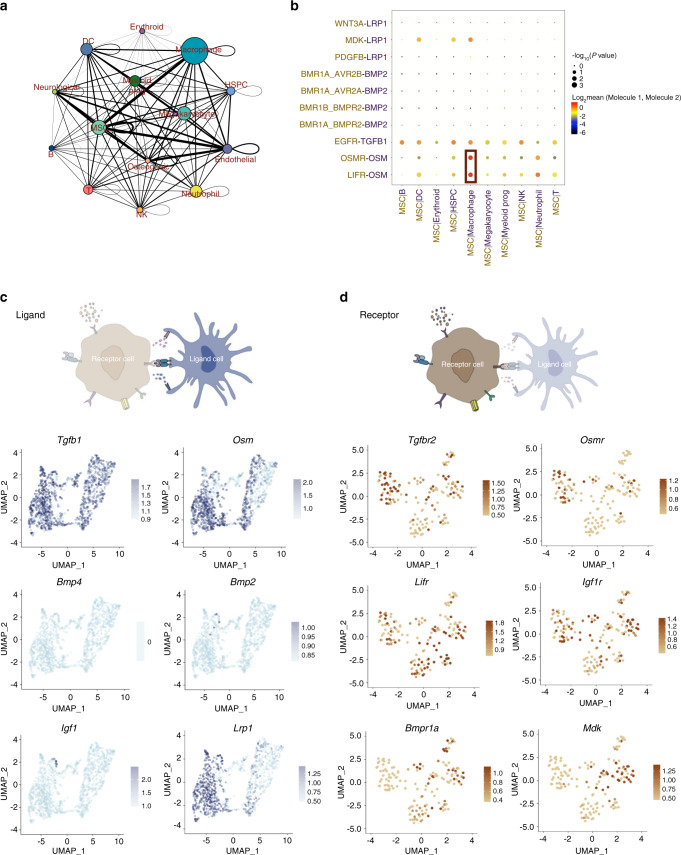
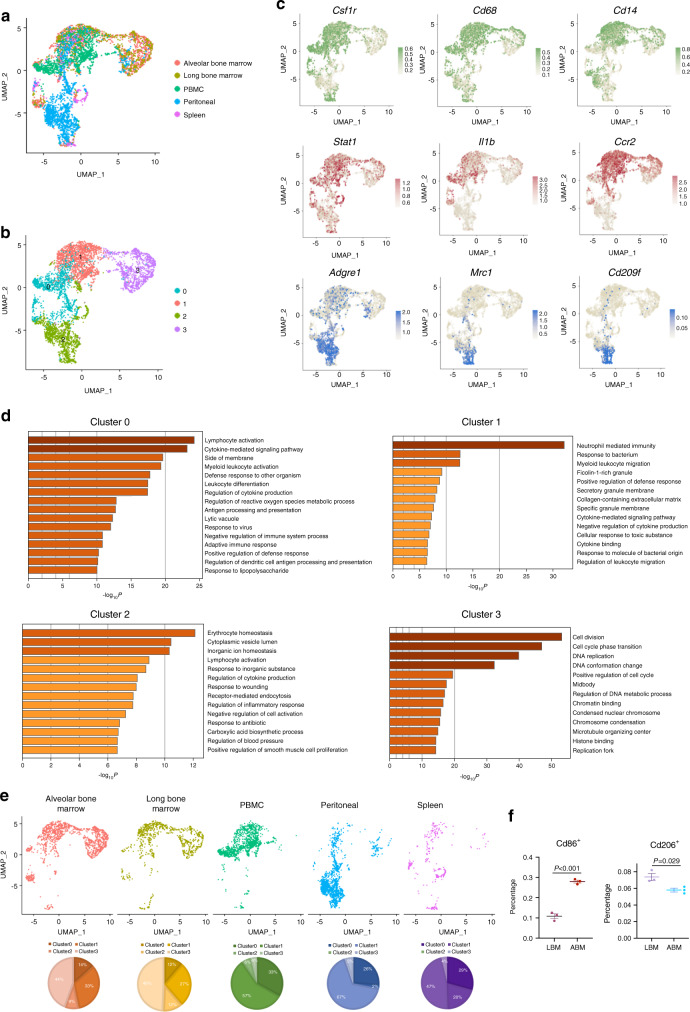
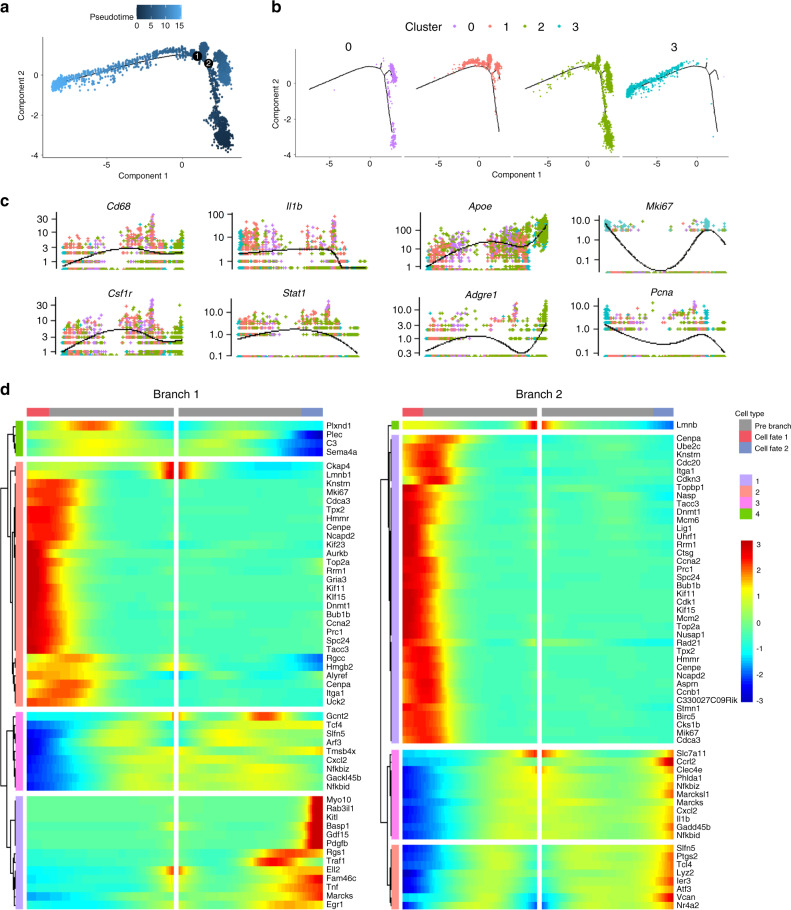
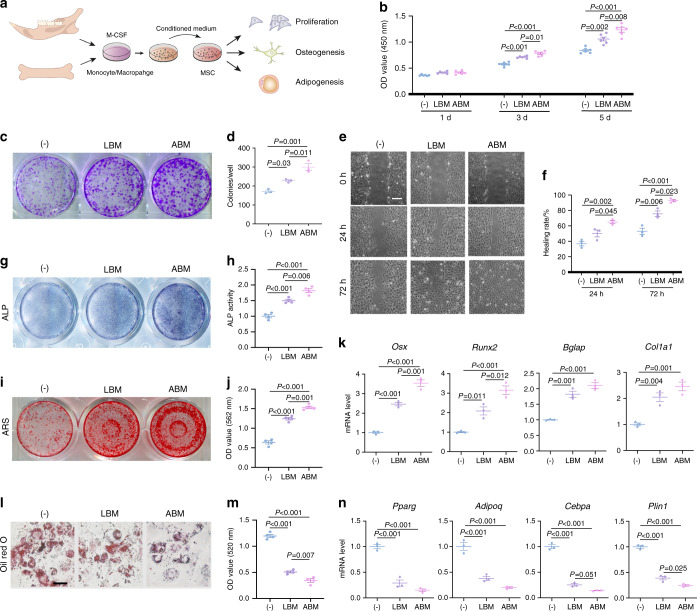
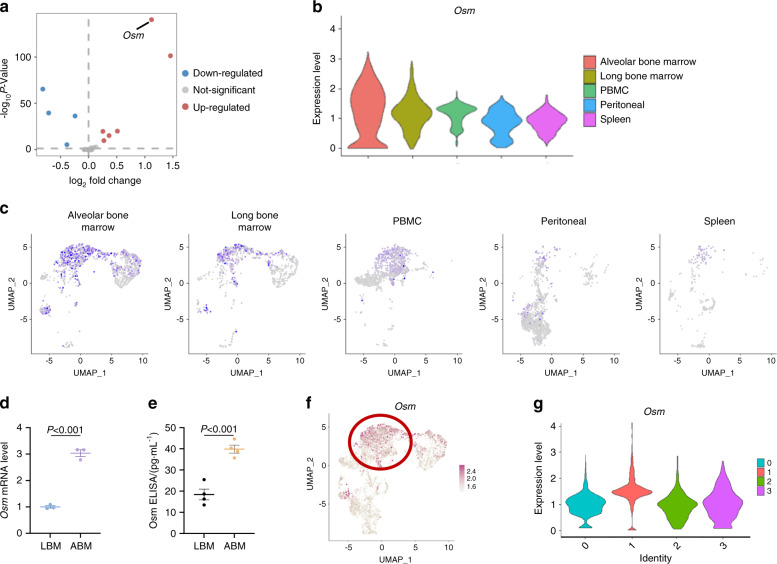
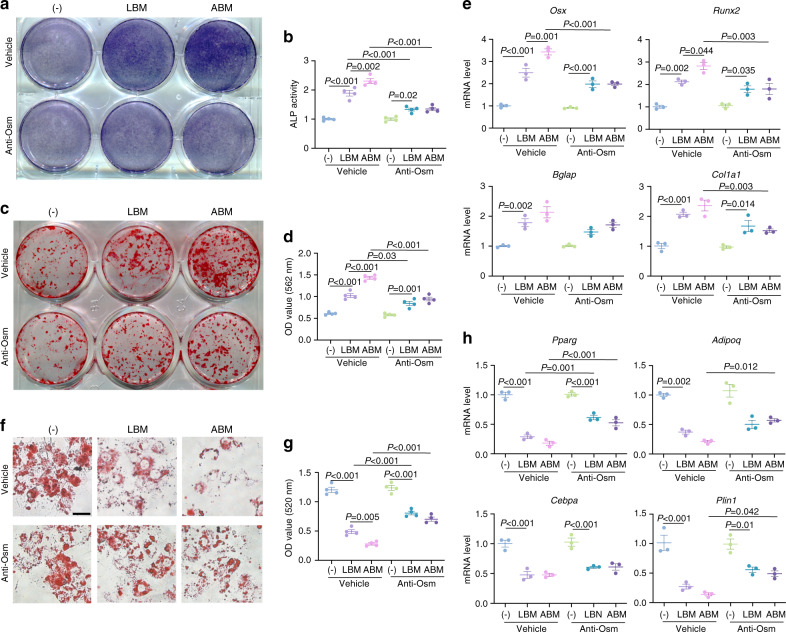
Alveolar bone is the thickened ridge of jaw bone that supports teeth. It is subject to constant occlusal force and pathogens invasion, and is therefore under active bone remodeling and immunomodulation. Alveolar bone holds a distinct niche from long bone considering their different developmental origin and postnatal remodeling pattern. However, a systematic explanation of alveolar bone at single-cell level is still lacking. Here, we construct a single-cell atlas of mouse mandibular alveolar bone through single-cell RNA sequencing (scRNA-seq). A more active immune microenvironment is identified in alveolar bone, with a higher proportion of mature immune cells than in long bone. Among all immune cell populations, the monocyte/macrophage subpopulation most actively interacts with mesenchymal stem cells (MSCs) subpopulation. Alveolar bone monocytes/macrophages express a higher level of Oncostatin M (Osm) compared to long bone, which promotes osteogenic differentiation and inhibits adipogenic differentiation of MSCs. In summary, our study reveals a unique immune microenvironment of alveolar bone, which may provide a more precise immune-modulatory target for therapeutic treatment of oral diseases.


Conflict of interest statement

The authors declare no competing interests.

Figures

Fig. 1
Fig. 1
Characterization of the single-cell atlas of alveolar bone. a Flow chart of preparation of scRNA-seq samples from mouse mandibular alveolar bone. b Cells identified by scRNA-seq were visualized with UMAP. Different cell populations were defined and distinguished by color. Each point represented an independent cell. c Specific expression of marker genes in different cell types. d The expression levels of marker genes were projected onto UMAP atlas
Fig. 2
Fig. 2
Cell–cell interaction between immune cells and stromal cells in alveolar bone marrow. a Network diagram of the cell–cell interaction of different cells in the alveolar bone marrow. The size of the circle represented the number of interactions with all other types of cells, and the thickness of the line represented the interaction number of cells between the line. b Visualization of the selected macrophage-MSC crosstalk pathway. c Expression of the ligands in monocytes/macrophages. d Expression of the receptors in stromal cells (MSC, osteoblasts, endothelial cells, neurological cells)
Fig. 3
Fig. 3
Comparative analysis of the heterogeneity of monocytes/macrophages. a Monocyte/macrophage population after merging five scRNA-seq datasets was visualized with umap plot. b Identification of the 4 subclusters of Monocyte/Macrophage population. c The expression of classic macrophage polarization markers in monocyte/macrophage population. d GO enrichment analysis of the biological functions of different subclusters. e Distribution of cells on umap plot split by tissue origins. f Flow cytometry analysis of the ratio of Cd86+ and Cd206+ macrophages in alveolar bone marrow and long bone marrow
Fig. 4
Fig. 4
Pseudotime analysis of monocyte/macrophage population. a Trajectory order of the monocyte/macrophage populations by pseudotime value. b Distribution of monocytes/macrophages on the developmental tree by clusters. c Cluster-defined monocyte/macrophage marker gene expression of different subclusters. d Clustered heatmap of differential genes at two trajectory branch points (P < 1.0−8e)
Fig. 5
Fig. 5
Regulatory effect of monocytes/macrophages on MSCs. a Flow chat of the experimental procedures. Conditioned mediums of ABM- and LBM-derived monocytes/macrophages were supplemented into the MSCs culture, respectively. b Proliferation assay of MSCs at 1d, 3d, and 5d by CCK8. c, d Colony formation of MSCs at 14 days via crystal violet staining and quantitative analyses. e, f Effects of macrophage-conditioned medium on the migration of MSCs. Scale bar, 200 μm. g, h ALP staining and ALP activity measurement of MSCs after induction for 7 days. i, j ARS staining and quantitative analyses after 21 days induction. k RT-qPCR results for the osteogenesis-related genes after 7 days induction. l, m Oil red O staining and quantitative analyses of MSCs. Scale bar, 50 μm. n RT-qPCR results for the adipogenesis-related genes after 21 days induction
Fig. 6
Fig. 6
Osm is highly expressed in ABM. a The volcano plot shows 59 cytokines between ABM and LBM-derived monocyte/macrophage populations. Red symbol, significantly upregulated cytokines. Blue symbol, significantly downregulated cytokines. b Violin plot for the expression levels of Osm in monocytes/macrophages from different tissues. c Osm expression in monocytes/macrophages split by tissue origin. d RT-qPCR results of Osm levels in monocytes/macrophages derived from ABM and LBM. e ELISA for Osm in ABM and LBM homogenates. f Osm expression levels in different cells projected on UMAP plot. g Violin plot for the expression levels of Osm in different monocyte/macrophage subclusters
Fig. 7
Fig. 7
The regulatory effect of macrophages on MSCs is Osm-dependent. a, b ALP staining and ALP activity quantitative analyses of MSCs after Osm neutralization. c, d ARS staining and quantitative analyses of MSCs after Osm neutralization. e RT-qPCR for the osteogenesis-related genes after Osm neutralization. f, g Oil red O staining and quantitative analyses of MSCs after Osm neutralization. Scale bar, 50 μm. h RT-qPCR for the adipogenesis-related genes after Osm neutralization

References

    1. Gruber R. Osteoimmunology: Inflammatory osteolysis and regeneration of the alveolar bone. J. Clin. Periodontol. 2019;46:52–69. doi: 10.1111/jcpe.13056. - DOI - PubMed
    1. Lerner UH, Kindstedt E, Lundberg P. The critical interplay between bone resorbing and bone forming cells. J. Clin. Periodontol. 2019;46:33–51. doi: 10.1111/jcpe.13051. - DOI - PubMed
    1. Connizzo BK, et al. Nonuniformity in periodontal ligament: mechanics and matrix composition. J. Dental Res. 2021;100:179–186. doi: 10.1177/0022034520962455. - DOI - PMC - PubMed
    1. Huja SS, Fernandez SA, Hill KJ, Li Y. Remodeling dynamics in the alveolar process in skeletally mature dogs. Anat. Rec. Part A, Discoveries Mol. Cell.Evolut. Biol. 2006;288:1243–1249. doi: 10.1002/ar.a.20396. - DOI - PMC - PubMed
    1. Chai Y, et al. Fate of the mammalian cranial neural crest during tooth and mandibular morphogenesis. Development. 2000;127:1671–1679. - PubMed

LinkOut - more resources