

Umbilical cord-derived mesenchymal stromal cells immunomodulate and restore actin dynamics and phagocytosis of LPS-activated microglia via PI3K/Akt/Rho GTPase pathway
- PMID: 33723246
- PMCID: PMC7961004
- DOI: 10.1038/s41420-021-00436-w
Umbilical cord-derived mesenchymal stromal cells immunomodulate and restore actin dynamics and phagocytosis of LPS-activated microglia via PI3K/Akt/Rho GTPase pathway
Abstract
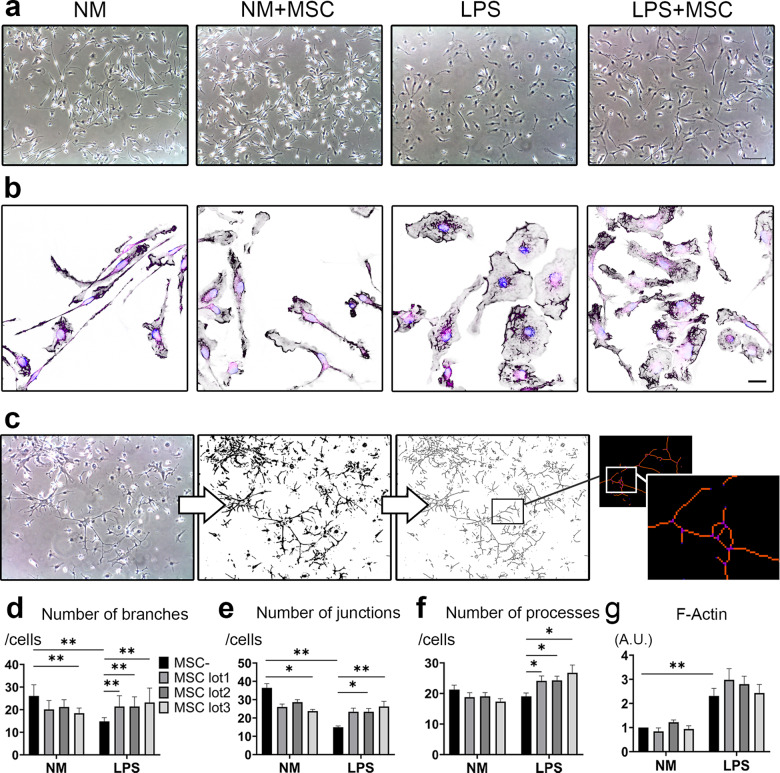
Microglia are the immune cells in the central nervous system surveying environment and reacting to various injuries. Activated microglia may cause impaired synaptic plasticity, therefore modulating and restoring them to neutral phenotype is crucial to counteract a pro-inflammatory, neurotoxic state. In this study, we focused on elucidating whether human umbilical cord (UC) -derived mesenchymal stromal cells (MSCs) can exert immunomodulatory effect and change the phenotype of activated microglia. Primary culture of microglia was activated by lipopolysaccharide (LPS) and was co-cultured with three lots of MSCs. We investigated immunomodulation, actin dynamics and phagocytic capacity of activated microglia, and examined change of Rho GTPase in microglia as the mechanism. MSCs suppressed the expression of IL-1β and pNFκB in LPS-activated microglia, and conversely elevated the expression of IL-1β in resting-surveying microglia with lot-to-lot variation. Morphological and phagocytotic analyses revealed that LPS stimulation significantly increased active Rho GTPase, Rac1, and Cdc42 levels in the microglia, and their morphology changed to amoeboid in which F-actin spread with ruffle formation. The F-actin spreading persisted after removal of LPS stimulation and reduced phagocytosis. On the other hand, MSC co-culture induced bimodal increase in active Rac1 and Cdc42 levels in LPS-activated microglia. Moreover, extended ruffles of F-actin shrinked and concentrated to form an actin ring, thereby restoring phagocytosis. We confirmed inhibition of the PI3K/Akt pathway attenuated F-actin dynamics and phagocytosis restored by MSCs. Overall, we demonstrated that MSCs immunomodulated microglia with lot-to-lot variation, and changed the phenotype of LPS-activated microglia restoring actin dynamics and phagocytosis by increase of active Rho GTPase.
Conflict of interest statement
The authors declare no competing interests.
Figures


Similar articles
-
Umbilical Cord Blood Mesenchymal Stem Cells Enhance Lipopolysaccharide-Induced IL-10 and IL-37 Production in THP-1 Cells.Inflammation. 2019 Jun;42(3):987-993. doi: 10.1007/s10753-019-00960-z. Inflammation. 2019. PMID: 30707387
-
In Vitro Priming and Hyper-Activation of Brain Microglia: an Assessment of Phenotypes.Mol Neurobiol. 2019 Sep;56(9):6409-6425. doi: 10.1007/s12035-019-1529-y. Epub 2019 Feb 25. Mol Neurobiol. 2019. PMID: 30805836
-
TLR4 (toll-like receptor 4) activation suppresses autophagy through inhibition of FOXO3 and impairs phagocytic capacity of microglia.Autophagy. 2019 May;15(5):753-770. doi: 10.1080/15548627.2018.1556946. Epub 2018 Dec 13. Autophagy. 2019. PMID: 30523761 Free PMC article.
-
FilGAP and its close relatives: a mediator of Rho-Rac antagonism that regulates cell morphology and migration.Biochem J. 2013 Jul 1;453(1):17-25. doi: 10.1042/BJ20130290. Biochem J. 2013. PMID: 23763313 Review.
-
Ras-related GTPases and the cytoskeleton.Mol Biol Cell. 1992 May;3(5):475-9. doi: 10.1091/mbc.3.5.475. Mol Biol Cell. 1992. PMID: 1611153 Free PMC article. Review.
Cited by
-
A Natural Small Molecule Mitigates Kidney Fibrosis by Targeting Cdc42-mediated GSK-3β/β-catenin Signaling.Adv Sci (Weinh). 2024 Apr;11(13):e2307850. doi: 10.1002/advs.202307850. Epub 2024 Jan 19. Adv Sci (Weinh). 2024. PMID: 38240457 Free PMC article.
-
Preventing Brain Damage from Hypoxic-Ischemic Encephalopathy in Neonates: Update on Mesenchymal Stromal Cells and Umbilical Cord Blood Cells.Am J Perinatol. 2022 Dec;39(16):1754-1763. doi: 10.1055/s-0041-1726451. Epub 2021 Apr 14. Am J Perinatol. 2022. PMID: 33853147 Free PMC article. Review.
-
Extracellular Vesicles From Bone Marrow-Derived Macrophages Enriched in ARG1 Enhance Microglial Phagocytosis and Haematoma Clearance Following Intracerebral Haemorrhage.J Extracell Vesicles. 2025 Jan;14(1):e70041. doi: 10.1002/jev2.70041. J Extracell Vesicles. 2025. PMID: 39868438 Free PMC article.
-
Cell Therapies for Autism Spectrum Disorder Based on New Pathophysiology: A Review.Cell Transplant. 2023 Jan-Dec;32:9636897231163217. doi: 10.1177/09636897231163217. Cell Transplant. 2023. PMID: 36999673 Free PMC article. Review.
-
Reduction of inflammatory biomarkers underlies extracellular vesicle mediated functional recovery in an aged monkey model of cortical injury.Front Aging Neurosci. 2025 Jul 9;17:1605144. doi: 10.3389/fnagi.2025.1605144. eCollection 2025. Front Aging Neurosci. 2025. PMID: 40703679 Free PMC article.
References
Grants and funding
LinkOut - more resources
Full Text Sources
Other Literature Sources
Research Materials
Miscellaneous
