. 2021 Mar 15;12(1):1680.
doi: 10.1038/s41467-021-21962-2.

Branched-chain α-ketoacids are preferentially reaminated and activate protein synthesis in the heart

Affiliations

Branched-chain α-ketoacids are preferentially reaminated and activate protein synthesis in the heart

Jacquelyn M Walejko et al. Nat Commun. .

Abstract

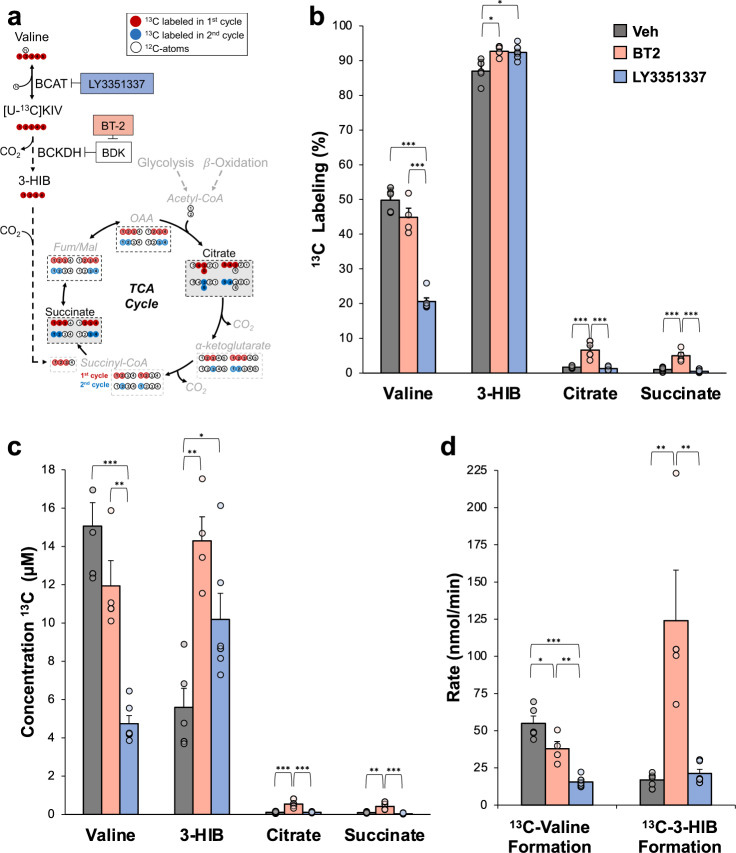
Branched-chain amino acids (BCAA) and their cognate α-ketoacids (BCKA) are elevated in an array of cardiometabolic diseases. Here we demonstrate that the major metabolic fate of uniformly-13C-labeled α-ketoisovalerate ([U-13C]KIV) in the heart is reamination to valine. Activation of cardiac branched-chain α-ketoacid dehydrogenase (BCKDH) by treatment with the BCKDH kinase inhibitor, BT2, does not impede the strong flux of [U-13C]KIV to valine. Sequestration of BCAA and BCKA away from mitochondrial oxidation is likely due to low levels of expression of the mitochondrial BCAA transporter SLC25A44 in the heart, as its overexpression significantly lowers accumulation of [13C]-labeled valine from [U-13C]KIV. Finally, exposure of perfused hearts to levels of BCKA found in obese rats increases phosphorylation of the translational repressor 4E-BP1 as well as multiple proteins in the MEK-ERK pathway, leading to a doubling of total protein synthesis. These data suggest that elevated BCKA levels found in obesity may contribute to pathologic cardiac hypertrophy via chronic activation of protein synthesis.


Conflict of interest statement

M.W.C., J.T.B., C.D.H., and R.E.G. are employees of Eli Lilly & Co. C.B.N. is a member of the Eli Lilly Global Diabetes Advisory Board. A portion of the work described herein was funded by a sponsored research agreement from Eli Lilly and Co. to C.B.N. The remaining authors declare no competing interests.

Figures

Fig. 1
Fig. 1. Preferential reamination of α-ketoisovalerate (KIV) to valine in the isolated perfused heart.
a Simplified schematic figure diagraming the potential metabolic fates of [U-13C]KIV, as well as the effects of LY3351337 to inhibit BCAT activity, and BT2 to inhibit BDK. Label incorporation from first (red circles) and second (blue circles) passes through the TCA cycle are shown in dashed boxes. Measured metabolites in the TCA cycle are highlighted with a gray background and black dashed border. b The fractional percent labeling with 13C is shown for the indicated metabolites; (c) The absolute amounts of 13C-labeled valine, 3-HIB, citrate, and succinate are shown. Data in b–d are from hearts isolated from Wistar rats and perfused with [U-13C]KIV (100 μM) in the absence (Veh; n = 5; gray) or presence of the BDK inhibitor, BT2 (n = 4; red) or the BCAT inhibitor, LY3351337 (n = 6; blue). d Rate of reamination (nmol/min) of [U-13C]KIV to valine and rate of formation of 13C-labeled 3-HIB from [U-13C]KIV in isolated hearts following treatment with LY3351337 or BT2. Data represent mean ± SEM. Statistical differences indicated by Tukey’s HSD post-hoc test following one-way ANOVA: *P < 0.05, **P < 0.005, ***P < 0.0005.
Fig. 2
Fig. 2. KIV reamination across tissues in living rats.
Thirty minutes after a single injection of BCAT inhibitor, LY3351337 (10 mg/kg i.p.; n = 5; blue), or Veh (DMSO; n = 5; gray), Wistar rats received an i.p. injection of [U-13C]KIV (100 mg/kg), followed by blood sampling from the tail vein at 2, 5, 10, 15, 30, and 60 min. Fractional percent labeling with 13C of (a) plasma KIV and (b) plasma valine. N = 5–6 per group. A separate cohort of Wistar rats was treated with LY3351337 (10 mg/kg i.p.) or vehicle and received an i.p. injection of [U-13C]KIV (100 mg/kg) 30 min later. Tissues were harvested 30 min after the [U-13C]KIV injection. c Fractional percent labeling with 13C of valine in plasma and the indicated tissues in the absence (Veh; n = 8) or presence of LY3351337 (n = 10). The dashed line indicates the plasma enrichment level. Data represent mean ± SEM. Statistical differences indicated by a two-way paired Student’s t-test: *P < 0.05, **P < 0.005.
Fig. 3
Fig. 3. Over-expression of SLC25A44 decreases KIV reamination in the isolated perfused mouse heart.
a Correlation of 13C-valine concentration with Bcat1, Bcat2, and Slc25a44 mRNA levels across rat heart (n = 6; red), liver (n = 5; blue), kidney (n = 6; green), and gastrocnemius (n = 5; orange). Data for tissue labeling of 13C valine was obtained in rats injected with [U-13C] KIV, as summarized in Fig. 2C. b Experimental design for the study of AAV-mediated overexpression of SLC25A44 in mouse heart. c Relative mRNA expression of Slc25a44 in isolated perfused hearts following treatment with AAV9-CMV-SLC25A44 (n = 7; purple) versus AAV9-CMV-GFP (n = 7; navy). The concentration of 13C-labeled valine in the heart (d), the total rate of formation of 13C-labeled valine (e), perfusate concentration of 13C-labeled valine (f), and concentrations of 13C-labeled TCA cycle intermediates from [U-13C]KIV (100 μM) (g) following treatment with AAV9-CMV-SLC25A44 or AAV9-CMV-GFP. h Relative levels of transcripts encoding BCAA transporters in AAV9-CMV-SLC25A44 versus AAV9-CMV-GFP-treated hearts N = 7 per group. i Correlations of Scl25a44 with Slc7a5 mRNA levels in rat heart, liver, kidney, or gastrocneminus (gastroc) muscle. N = 5–6 per group. Data represent mean ± SEM. Statistical differences indicated by Pearson correlation (a, i) or a two-way, paired Student’s t-test (c–h): *P < 0.05, ***P < 0.0005.
Fig. 4
Fig. 4. High concentrations of BCKA activate protein synthesis in isolated perfused hearts in concert with increased 4E-BP1 phosphorylation.
Wistar rat hearts were isolated and perfused with buffers containing no BCKA (n = 3; gray), BCKA at concentrations found in the plasma of lean rats (n = 3; light blue) or BCKA at concentrations found in the plasma of obese rats (n = 3; dark blue). a Upper panel–immunoblot analysis of the incorporation of puromycin into newly synthesized proteins. Lower panel—immunoblot of total and phosphorylated ribosomal protein S6 and 4E-BP1. b Densitometric quantification of puromycin labeling (normalized to actin loading control), phosphorylated ribosomal protein S6 (normalized to total S6), and phosphorylated 4E-BP1 (normalized to total 4E-BP1). Data represent mean ± SEM. Statistical differences indicated by Tukey’s HSD post-hoc test following one-way ANOVA: *P < 0.05, **P < 0.005.
Fig. 5
Fig. 5. Effect of BCKA exposure on the cardiac phosphoproteome.
a Volcano plot depicting the 9057 phosphopeptides detected using isobaric tandem mass tags (TMT) labeling and one-dimensional liquid chromatography, tandem mass spectrometry (1D-LC-MS/MS) in hearts perfused with levels of BCKA found in lean (LoBCKA; n = 4) or obese (HiBCKA; n = 5) rats. Each data point represents the −Log10 P-value (y-axis) and Log2 fold change HiBCKA/LoBCKA (x-axis) for each phosphopeptide following a two-way, paired Student’s t-test. A significance threshold of >2 fold change and P-value <0.01 was used. Significantly upregulated phosphopeptides are colored red, significantly downregulated phosphopeptides are colored blue. Phosphopeptides that did not meet the significance threshold are colored gray. b The top five overrepresented gene ontology (GO) terms for the significantly upregulated (red) and downregulated (blue) phosphopeptides are shown. Consensus phosphosite motif sequences generated for down and upregulated phosphosites are shown in panels c and d, respectively. ef Protein-protein interaction networks generated in STRING v11 for significantly downregulated (e) and upregulated (f) phosphoproteins.
Fig. 6
Fig. 6. Schematic of KIV fate in the heart.
Stable isotope-resolved metabolomics in isolated hearts perfused with [U-13C] KIV demonstrates that the major fates of KIV are not oxidation to TCA cycle intermediates but rather reamination to valine and conversion to 3-hydroxyisobutyrate (3-HIB). Acute exposure of isolated hearts to increased supply of BCKA is sufficient to promote inhibitory phosphorylation of the translational repressor 4E-BP1 and increase protein synthesis.

References

    1. Felig P, Marliss E, Cahill GF. Plasma amino acid levels and insulin secretion in obesity. N. Engl. J. Med. 1969;281:811–816. doi: 10.1056/NEJM196910092811503. - DOI - PubMed
    1. Newgard CB, et al. A branched-chain amino acid-related metabolic signature that differentiates obese and lean humans and contributes to insulin resistance. Cell Metab. 2009;9:311–326. doi: 10.1016/j.cmet.2009.02.002. - DOI - PMC - PubMed
    1. Wang TJ, et al. Metabolite profiles and the risk of developing diabetes. Nat. Med. 2011;17:448–453. doi: 10.1038/nm.2307. - DOI - PMC - PubMed
    1. Newgard CB. Metabolomics and metabolic diseases: where do we stand? Cell Metab. 2017;25:43–56. doi: 10.1016/j.cmet.2016.09.018. - DOI - PMC - PubMed
    1. White PJ, et al. Branched-chain amino acid restriction in Zucker-fatty rats improves muscle insulin sensitivity by enhancing efficiency of fatty acid oxidation and acyl-glycine export. Mol. Metab. 2016;5:538–551. doi: 10.1016/j.molmet.2016.04.006. - DOI - PMC - PubMed

Publication types