. 2021 Mar 15;12(1):1676.
doi: 10.1038/s41467-021-21903-z.

SARS-CoV-2 hijacks folate and one-carbon metabolism for viral replication

Affiliations

SARS-CoV-2 hijacks folate and one-carbon metabolism for viral replication

Yuchen Zhang et al. Nat Commun. .

Abstract

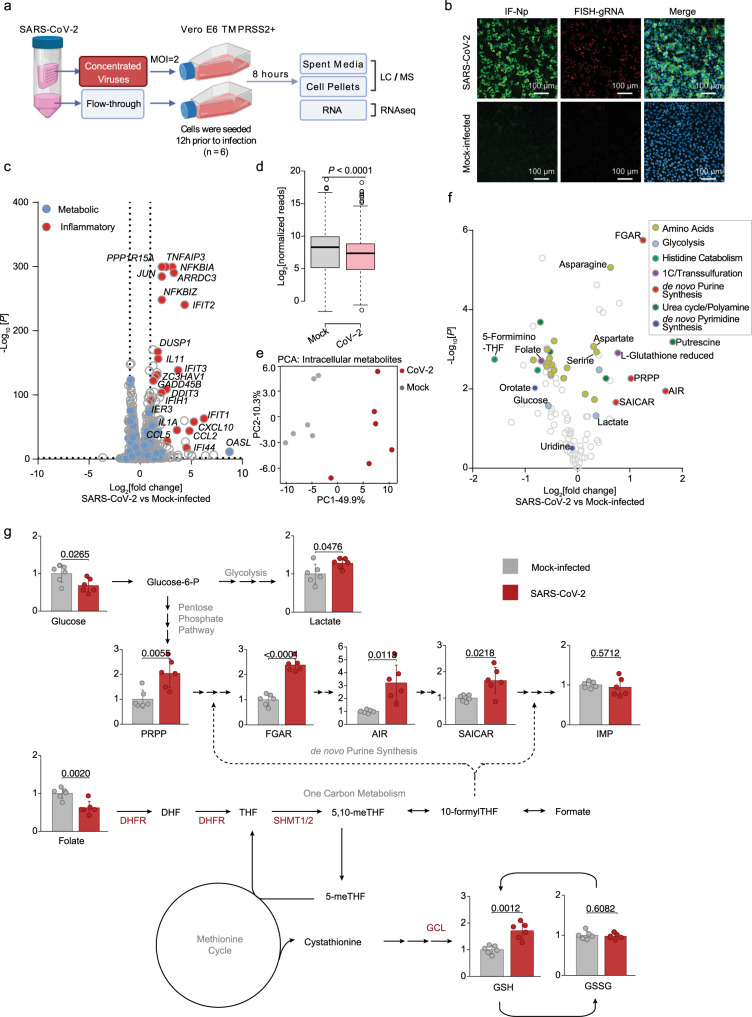
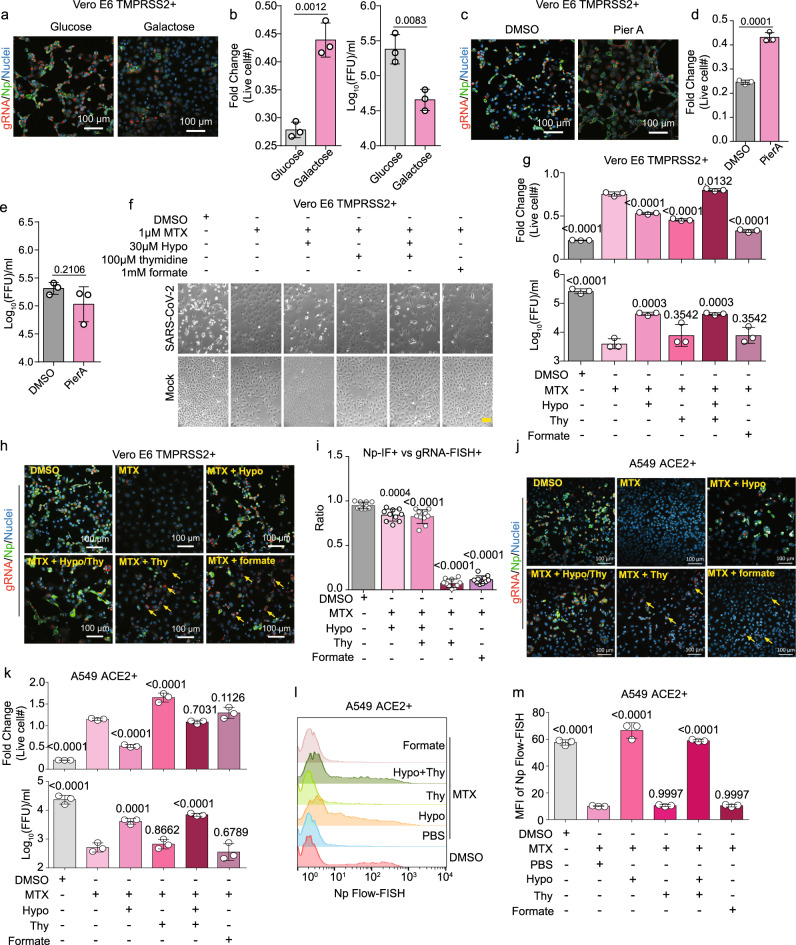
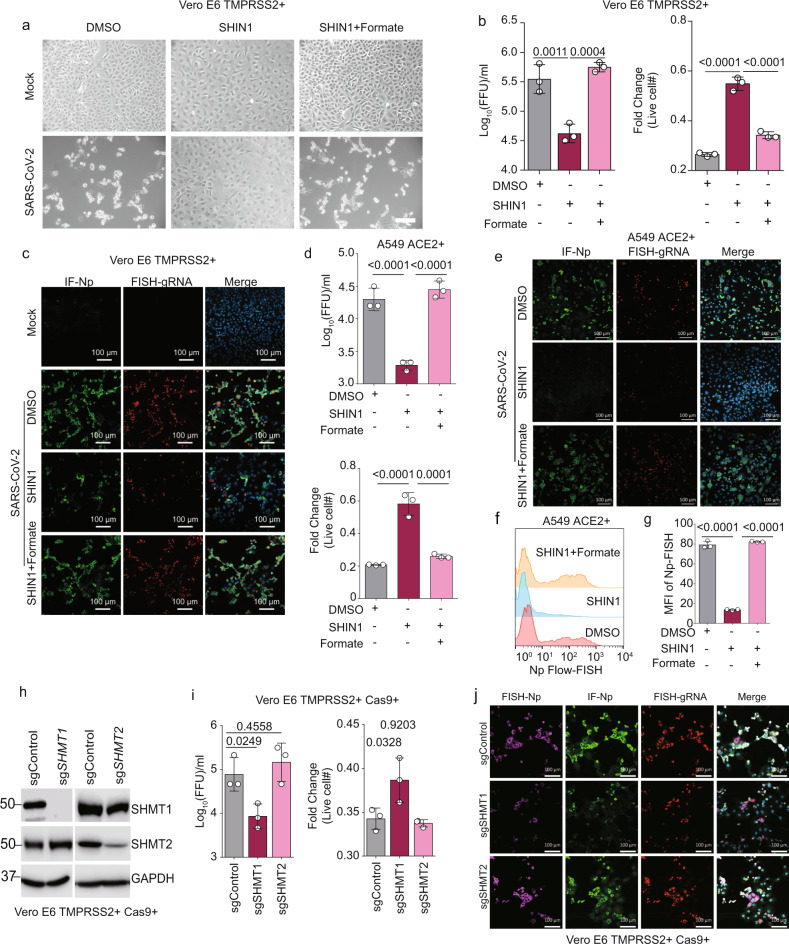
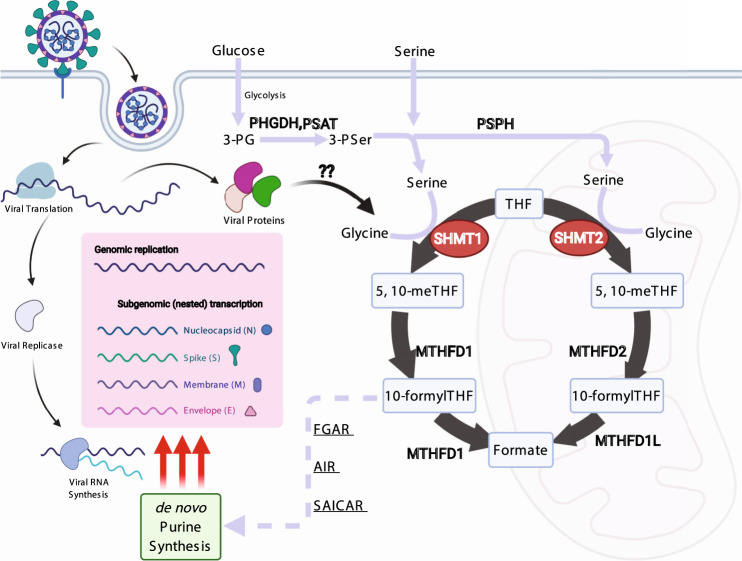
The recently identified Severe Acute Respiratory Syndrome Coronavirus 2 (SARS-CoV-2) is the cause of the COVID-19 pandemic. How this novel beta-coronavirus virus, and coronaviruses more generally, alter cellular metabolism to support massive production of ~30 kB viral genomes and subgenomic viral RNAs remains largely unknown. To gain insights, transcriptional and metabolomic analyses are performed 8 hours after SARS-CoV-2 infection, an early timepoint where the viral lifecycle is completed but prior to overt effects on host cell growth or survival. Here, we show that SARS-CoV-2 remodels host folate and one-carbon metabolism at the post-transcriptional level to support de novo purine synthesis, bypassing viral shutoff of host translation. Intracellular glucose and folate are depleted in SARS-CoV-2-infected cells, and viral replication is exquisitely sensitive to inhibitors of folate and one-carbon metabolism, notably methotrexate. Host metabolism targeted therapy could add to the armamentarium against future coronavirus outbreaks.


Conflict of interest statement

V.K.M. and B.E.G. are listed as inventors on a patent application filed by the Broad Institute based on results from this manuscript. V.K.M. is on the scientific advisory board and receives compensation from Janssen Pharmaceuticals and 5am Ventures and owns equity in Raze Therapeutics. B.E.G. receives research support from Abbvie. S.J.E. is a founder of TSCAN Therapeutics, MAZE Therapeutics, and Mirimus. S.J.E. is a founder of TSCAN Therapeutics, MAZE Therapeutics, ImmuneID, and Mirimus. S.J.E. serves on the scientific advisory board of Homology Medicines, TSCAN Therapeutics, MAZE Therapeutics, XChem, and is an advisor for MPM, none of which affect this work. Y.Z., R.G., S.H.K., H.S., S.Z., J.H.L., Y.F., M.G., C.N.O., and D.T.H. declare no competing interests.

Figures

Fig. 1
Fig. 1. Metabolic changes induced by early SARS-CoV-2 infection.
a Schematic of the metabolic profiling approach. Vero E6 TMPRSS2 + cells were infected with concentrated SARS-CoV-2 at a MOI = 2 or mock-infected with virus-depleted flow-through, infected for 8 h and profiled by LC/MS and RNAseq in parallel. b Immunofluorescence of nucleoprotein (IF-Np) and fluorescence in situ hybridization (FISH) for + strand viral genomic RNA (FISH-gRNA) and merge with Hoechst stained nuclei in infected vs mock-infected cells. See also Supplementary Fig. 1b. The experiment was reproduced in at least six independent experiments. c Volcano plot visualization of 8 h SARS-CoV-2 versus mock vs infected Vero E6 RNAseq from n = 3 datasets. Selected inflammatory (red) and metabolism (blue) pathway genes are shown. P-value generated with DESeq under default setting. d Box plot visualization of RNAseq reads in SARS-CoV-2 versus mock-infected cells. n = 3 biologically independent samples were examined over one independent experiment. Data are presented as mean values ± SD. One-way ANOVA with multiple comparison using the Sidak method. e PCA of 106 intracellular metabolites, as determined by LC-MS in SARS-CoV-2-infected (red) or mock-infected (gray) cells, from n = 6 biologically independent replicates. f Volcano plot visualization of log2 fold change (x-axis) and -log10(P value; y-axis) of intracellular metabolites measured by LC-MS. Significantly increased or decreased metabolites related to glycolysis, de novo purine synthesis, 1C metabolism/ transsulfuration pathway, amino acids, histidine catabolism, urea cycle/polyamine metabolism, and de novo pyrimidine synthesis are labeled. n = 6 biologically independent samples were examined over one independent experiment, P-values were generated with two-tailed P value from Student’s t test. g Fold change of intracellular glucose, lactate, de novo purine, and one-carbon metabolite levels detected by LC-MS in SARS-CoV-2 and mock-infected cells. Mock-infected levels were set to 1. All barplots show mean ± standard deviation (SD). *P < 0.05, **P < 0.01, or ***P < 0.001 from Student’s two-tailed t test. Druggable targets are labeled in red. See also Supplementary Fig. 4. Source data are provided as a Source Data file.
Fig. 2
Fig. 2. SARS-CoV-2 induced glycolysis and one-carbon metabolism supports viral RNA and protein expression, replication, and cytopathic effect.
a +strand gRNA FISH, Np IF, and merge with Hoechst stained nuclei of Vero-E6 TMPRSS2 + cells cultured in media with 25 mM glucose versus galactose as the sugar source and infected with SARS-CoV-2. b Mean ± SD fold change of live Vero E6 TMPRSS2 + cell number and median tissue culture infectious dose (TCID50) presented as fluorescent-focus units (FFU) per ml of culture supernatant at 48 h post infection of cells cultured in glucose versus galactose from n = 3 biologically independent replicates. c FISH analysis of +strand gRNA, IF for Np, and merge with Hoechst stained nuclei in SARS-CoV-2-infected Vero E6 TMPRSS2 + cells treated with DMSO or 100 nM piericidin A (PierA). d Mean ± SD fold change live cell number from n = 3 biologically independent replicates, as in c. e Mean ±  TCID50 from n = 3 biologically independent replicates in Vero E6 TMPRSS2 + , as in b. f Phase microscopic images of SARS-CoV-2 versus mock-infected Vero E6 TMPRSS + cells cultured for 48 h with DMSO, 1 μM of methotrexate (MTX), 30 μM hypoxanthine (hypo), 100 μM thymidine, or 1 mM formate, as indicated. Yellow scale bar indicates 100 μm. g Mean ± fold change live cell # and TCID50/ml from samples collected as in f from three biologically independent replicates. h FISH microscopic analysis of viral gRNA, IF of Np, and merge with Hoechst stained nuclei in SARS-CoV-2-infected Vero E6 TMPRSS2 + cells treated for 48 h with the indicated conditions. Yellow arrows indicate representative cells with high gRNA (red) but low Np (green) signal. i Ratios of +strand gRNA FISH versus Np IF signals from 500 Vero E6 TMPRSS2 + cells from 20 random fields for each condition in h are shown. j FISH microscopic analysis of viral gRNA, IF of Np, and merge with Hoecshst stained nuclei in SARS-CoV-2-infected A549 ACE2 + cells treated with the indicated conditions. Yellow arrows indicate representative cells with high gRNA (red) but low Np (green) signal. k Fold change mean ± SD live cell # and TCID50/ml from A549 ACE2 + samples collected as in j from n = 3 biologically independent replicates. l Flow-FISH analysis of Np subgenomic RNA in SARS-CoV-2-infected A549 ACE2 + cells treated with the indicated conditions. Of note, the leftmost peak in each row indicates uninfected cells. m Mean ± SD of Np subgenomic RNA mean fluorescence intensity (MFI) values from n = 3 biologically independent replicates, as in l. In all panels, cells were infected at MOI = 0.1 for 48 h. Microscopy images are representative of at least n = 3 biologically independent values. P-values in this figure were calculated by one-way ANOVA with multiple comparisons using Sidak method. Source data are provided as a Source Data file.
Fig. 3
Fig. 3. SARS-CoV-2 induced serine one-carbon metabolism supports viral RNA and protein expression, replication, and cytopathic effect.
a Phase microscopic images of SARS-CoV-2 versus mock infected Vero E6 TMPRSS2 + cells cultured with DMSO, 10 μM of the dual SHMT1/2 inhibitor SHIN1 or 10 μM SHIN1 + 1 μM formate, as indicated. White scale bar indicates 100 μm. The experiment was reproduced in at least six independent experiments. b Mean ± SD fold change TCID50 (left) and live cell (right) from n = 3 biologically independent replicates, as in a. c IF of Np, FISH for +strand gRNA, and merge with Hoechst stained nuclei in mock-infected or SARS-CoV-2-infected Vero E6 TMPRSS2 + cells treated with DMSO, SHIN1, or SHIN1 + formate. d Mean ± SD fold change TCID50 (top) and live cell (bottom) values in SARS-CoV-2-infected A549 ACE2 + cells, treated with the indicated conditions, from n = 3 biologically independent replicates. e IF of Np, FISH for +strand gRNA, and merge with Hoechst stained nuclei in mock-infected or SARS-CoV-2-infected A549 ACE2 + cells treated with DMSO, SHIN1, or SHIN1 + formate. f Flow-FISH analysis of Np subgenomic RNA in SARS-CoV-2-infected A549 ACE2 + cells treated with the indicated conditions. g Mean ± SD values from n = 3 biologically independent replicates of viral subgenomic RNA Flow-FISH MFI values, as in f. h Immunoblot analysis of whole cell lysates from Cas9 + TMPRSS2 + Vero E6 expressing control, SHMT1 or SHMT2 sgRNAs. i Mean ± SD fold change TCID50 (left) and live cell (right) values from Vero E6 TMPRSS2 + with control, SHMT1 or SHMT2 targeting sgRNAs infected by SARS-CoV-2 from n = 3 biologically independent replicates are shown. j FISH of subgenomic Np RNA, IF of Np, FISH for +strand gRNA, and merge with Hoechst stained nuclei in cells with control, SHMT1 or SHMT2 targeting sgRNAs infected by SARS-CoV-2. In all panels, cells were infected at MOI = 0.1 for 48 h. Microscopy images are representative of at least n = 3 biologically independent values. P-values in this figure were calculated by one-way ANOVA with multiple comparisons using Sidak method. Source data are provided as a Source Data file.
Fig. 4
Fig. 4. Schematic of SARS-CoV-2 induced one-carbon metabolism in support of viral replication.
SARS-CoV-2 induces glycolysis and one-carbon metabolism at the post-transcriptional level in newly infected cells. Serine metabolism, particularly by cytosolic SHMT1 produces carbon units for de novo purine synthesis in support of massive viral subgenomic RNA synthesis, non-structural protein expression, and viral replication.

References

    1. Viglione G. How many people has the coronavirus killed? Nature. 2020;585:22–24. doi: 10.1038/d41586-020-02497-w. - DOI - PubMed
    1. Zhu N, et al. A novel coronavirus from patients with pneumonia in China, 2019. N. Engl. J. Med. 2020;382:727–733. doi: 10.1056/NEJMoa2001017. - DOI - PMC - PubMed
    1. Sawicki SG, Sawicki DL, Siddell SG. A contemporary view of coronavirus transcription. J. Virol. 2007;81:20–29. doi: 10.1128/JVI.01358-06. - DOI - PMC - PubMed
    1. de Wit E, van Doremalen N, Falzarano D, Munster VJ. SARS and MERS: recent insights into emerging coronaviruses. Nat. Rev. Microbiol. 2016;14:523–534. doi: 10.1038/nrmicro.2016.81. - DOI - PMC - PubMed
    1. Irigoyen N, et al. High-resolution analysis of coronavirus gene expression by RNA sequencing and ribosome profiling. PLoS Pathog. 2016;12:e1005473. doi: 10.1371/journal.ppat.1005473. - DOI - PMC - PubMed

Publication types

MeSH terms