. 2021 Mar 15;12(1):1701.
doi: 10.1038/s41467-021-21655-w.

Threats of global warming to the world's freshwater fishes

Affiliations

Threats of global warming to the world's freshwater fishes

Valerio Barbarossa et al. Nat Commun. .

Abstract

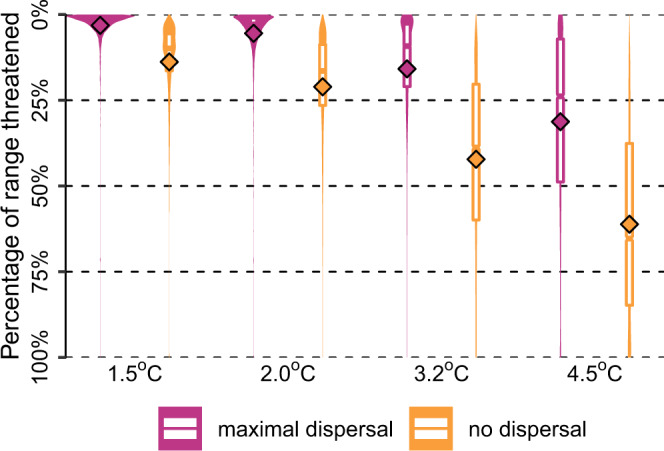
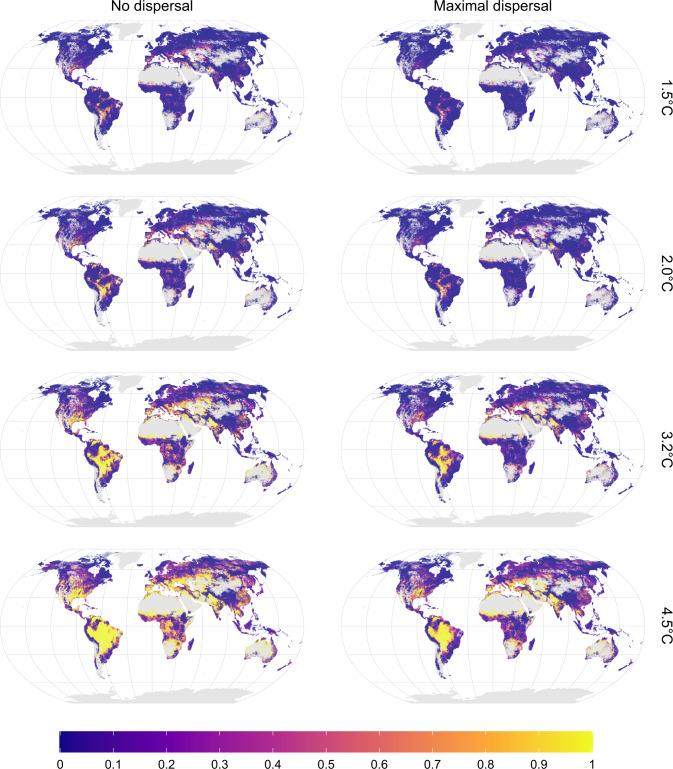
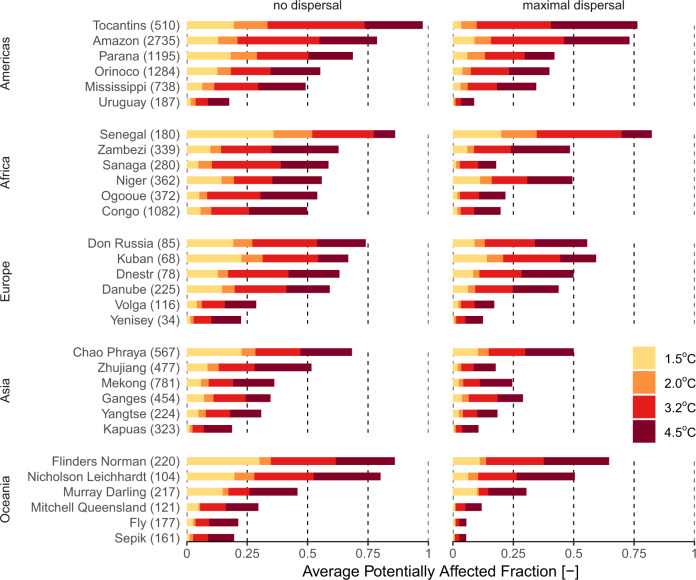
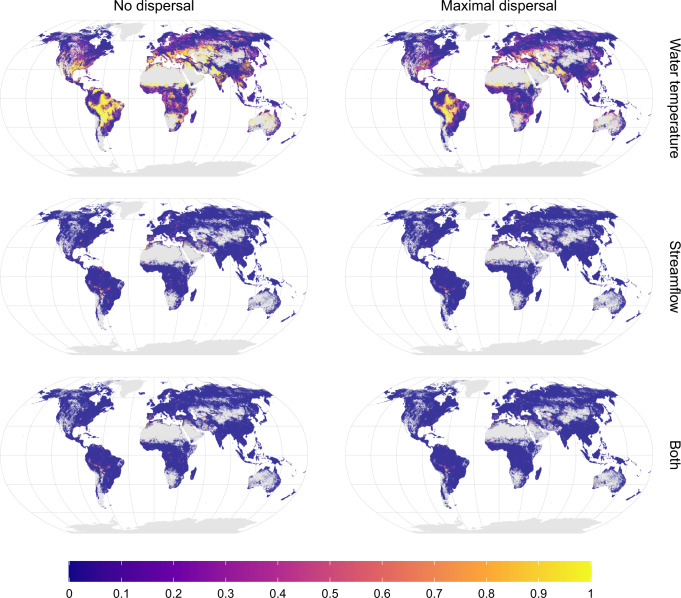
Climate change poses a significant threat to global biodiversity, but freshwater fishes have been largely ignored in climate change assessments. Here, we assess threats of future flow and water temperature extremes to ~11,500 riverine fish species. In a 3.2 °C warmer world (no further emission cuts after current governments' pledges for 2030), 36% of the species have over half of their present-day geographic range exposed to climatic extremes beyond current levels. Threats are largest in tropical and sub-arid regions and increases in maximum water temperature are more threatening than changes in flow extremes. In comparison, 9% of the species are projected to have more than half of their present-day geographic range threatened in a 2 °C warmer world, which further reduces to 4% of the species if warming is limited to 1.5 °C. Our results highlight the need to intensify (inter)national commitments to limit global warming if freshwater biodiversity is to be safeguarded.


Conflict of interest statement

The authors declare no competing interests.

Figures

Fig. 1
Fig. 1. Proportion of geographic range threatened at different global warming levels.
The violin plots show the proportion of geographic range threatened by future climate extremes for 11,425 freshwater fish species, different warming levels and two dispersal assumptions. For each species and warming level, the mean across the different scenarios (GCM–RCP combinations) is calculated. Within each violin, the white boxes show the interquartile range as well as the median, while diamonds represent the mean. Source data are provided as a Supplementary Data 1.
Fig. 2
Fig. 2. Spatial patterns of climate change threat.
Potentially affected fraction (PAF) of freshwater fish species due to exposure to water flow and temperature extremes beyond current levels, for different global warming levels and two dispersal assumptions. Patterns are based on the median PAF across the GCM–RCP combinations at a five arcminutes resolution (~10 km). Gray denotes no data areas (no species occurring or no data available). Source data are provided as Supplementary Data 2 and 3.
Fig. 3
Fig. 3. Climate change threats in large watersheds.
Potentially affected fraction of species averaged across 5 arcminutes grid cells within 30 large watersheds, for four warming levels and two dispersal assumptions. For each continent defined according to the World Bank Development Indicators (www.worldbank.org), we selected the six watersheds with the largest numbers of species and covering at least 50% of the known species richness (according to Tedesco et al. ). A more exhaustive overview of 200 watersheds is available in Supplementary Fig. 4. Numbers in brackets represent the number of species within the watershed. Source data are provided as Supplementary Data 4.
Fig. 4
Fig. 4. Climate change threats due to water temperature versus flow.
Potentially affected fraction (PAF) of species due to changes in water temperature (top), flow conditions (center), or both (i.e., fraction of species threatened by water temperature and flow extremes simultaneously; bottom) for the 3.2 °C warming scenario. The maps represent the median proportion of species affected over the GCM–RCP combinations available for the 3.2 °C warming scenario. Results for the other warming levels are available in Supplementary Fig. 2. A further breakdown of PAF by single variable for the 3.2 °C warming scenario is available in Supplementary Fig. 3. Gray denotes no data areas (no species occurring or no data available). Source data are provided as Supplementary Data 2 and 3.
Fig. 5
Fig. 5. Importance of various species properties in explaining the magnitude of future climate threat.
Variables’ importance is quantified based on the proportion of the geographic range exposed to climate extremes beyond current levels for two dispersal assumptions. Bars report the mean variable importance and confidence intervals represent the standard deviation across the 100 replicates of the stochastic phylogenetic trees. The legend includes the ranges across the different warming levels in Pagel’s λ and Pearson’s r between the predicted and observed percentage of range threatened. Coefficients of the underlying phylogenetic regression models are presented in Supplementary Table 5. Source data are provided as Supplementary Data 5.

References

    1. Dudgeon D, et al. Freshwater biodiversity: importance, threats, status and conservation challenges. Biol. Rev. 2006;81:163. doi: 10.1017/S1464793105006950. - DOI - PubMed
    1. Tedesco PA, et al. Data Descriptor: a global database on freshwater fish species occurrence in drainage basins. Sci. Data. 2017;4:1–6. doi: 10.1038/sdata.2017.141. - DOI - PMC - PubMed
    1. Butchart SHM, et al. Global Biodiversity: Indicators of Recent Declines. Science. 2010;328:1164–1168. doi: 10.1126/science.1187512. - DOI - PubMed
    1. Urban MC. Accelerating extinction risk from climate change. Science. 2015;348:571–573. doi: 10.1126/science.aaa4984. - DOI - PubMed
    1. Reid AJ, et al. Emerging threats and persistent conservation challenges for freshwater biodiversity. Biol. Rev. 2019;94:849–873. doi: 10.1111/brv.12480. - DOI - PubMed

Publication types

LinkOut - more resources