. 2021 Mar 15;11(1):5900.
doi: 10.1038/s41598-021-85252-z.

A modeling study to inform screening and testing interventions for the control of SARS-CoV-2 on university campuses

Affiliations

A modeling study to inform screening and testing interventions for the control of SARS-CoV-2 on university campuses

Ben Lopman et al. Sci Rep. .

Abstract

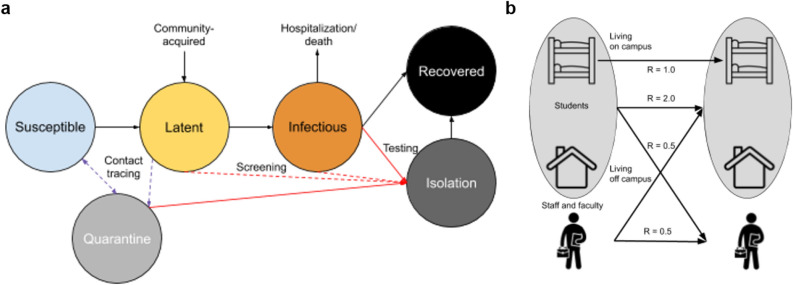
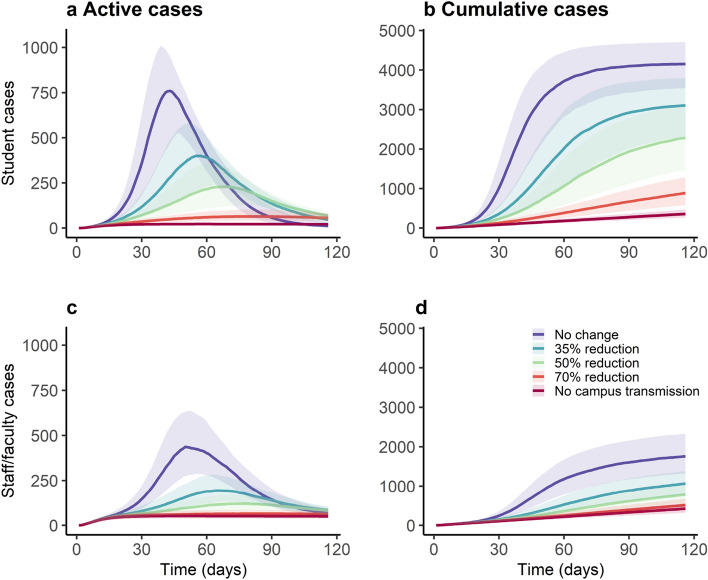
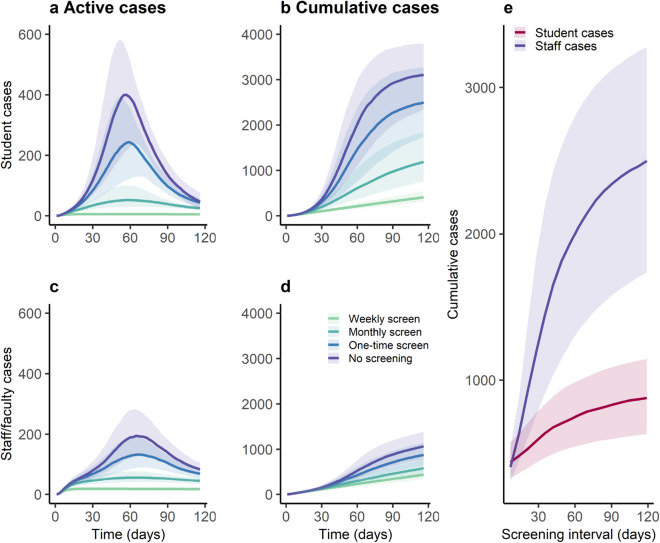
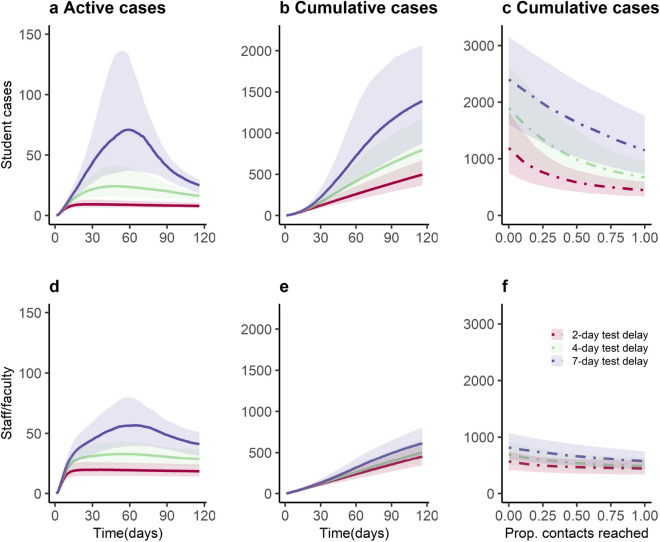
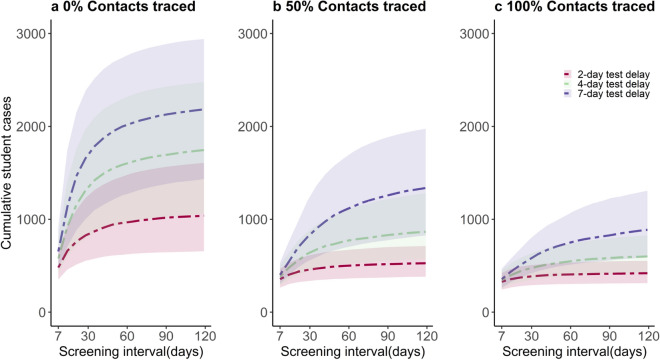
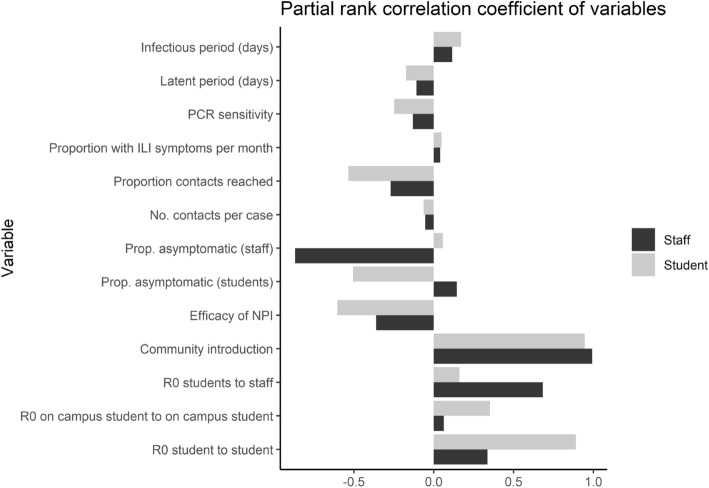
University administrators face decisions about how to safely return and maintain students, staff and faculty on campus throughout the 2020-21 school year. We developed a susceptible-exposed-infectious-recovered (SEIR) deterministic compartmental transmission model of SARS-CoV-2 among university students, staff, and faculty. Our goals were to inform planning at our own university, Emory University, a medium-sized university with around 15,000 students and 15,000 faculty and staff, and to provide a flexible modeling framework to inform the planning efforts at similar academic institutions. Control strategies of isolation and quarantine are initiated by screening (regardless of symptoms) or testing (of symptomatic individuals). We explored a range of screening and testing frequencies and performed a probabilistic sensitivity analysis. We found that among students, monthly and weekly screening can reduce cumulative incidence by 59% and 87%, respectively, while testing with a 2-, 4- and 7-day delay between onset of infectiousness and testing results in an 84%, 74% and 55% reduction in cumulative incidence. Smaller reductions were observed among staff and faculty. Community-introduction of SARS-CoV-2 onto campus may be controlled with testing, isolation, contract tracing and quarantine. Screening would need to be performed at least weekly to have substantial reductions beyond disease surveillance. This model can also inform resource requirements of diagnostic capacity and isolation/quarantine facilities associated with different strategies.


Conflict of interest statement

The authors declare no competing interests.

Figures

Figure 1
Figure 1
Schematic of (a) disease structure and (b) student and staff/faculty transmission pathways.
Figure 2
Figure 2
Effect of non-pharmaceutical interventions on COVID-19 active and cumulative cases among students (a,b) and faculty (c,d). Here we assume no baseline effects of non-pharmaceutical interventions, such that NPI effectiveness ranges from zero (no change) to complete (no on-campus transmission; only introduction from the community). Solid line represents the median of 1000 simulations using probabilistic sensitivity analysis, and shaded area represents the 25th-75th centile range.
Figure 3
Figure 3
Impact of screening frequency on projected COVID-19 daily active and cumulative incidence among students (a,b) and staff/faculty (c,d) and cumulative student and staff/faculty cases over a sweep of varying screening intervals (e). Solid line represents the median of 1000 simulations using probabilistic sensitivity analysis, and shaded area represents the 25th-75th centile range. Legend highlights interventions of weekly screening, monthly screening and one-time screening compared with no screening.
Figure 4
Figure 4
Impact of testing, contact tracing and quarantine at a range of testing delay intervals. Daily and cumulative COVID-19 incidence on university campus (a,b,d,e) and cumulative student and staff/faculty cases from 2-, 4-, 7- day test delay over a sweep of proportions of contacts reached (c,f). Based on ongoing contact-tracing program at Emory, we assume an average of two contacts elicited per case. Solid line represents the median of 1000 simulations using probabilistic sensitivity analysis, and shaded area represents the 25th-75th centile range.
Figure 5
Figure 5
Impact of combined screening, testing and tracing of COVID-19 cases on cumulative cases among students. Panels represent scenarios with (a) 0%, (b) 50% and (c) 100% of contacts traced and successfully quarantined. Solid line represents the median of 1000 simulations using probabilistic sensitivity analysis, and shaded area represents the 25th-75th centile range.
Figure 6
Figure 6
Partial rank correlation coefficient of key model inputs using outputs of cumulative student and staff/faculty cases in our model with combined 30-day screening and 4-day testing interval.

Similar articles

Cited by

References

    1. School closures caused by Coronavirus (Covid-19). https://en.unesco.org/covid19/educationresponse.
    1. Cauchemez S, et al. Role of social networks in shaping disease transmission during a community outbreak of 2009 H1N1 pandemic influenza. Proc. Natl. Acad. Sci. 2011;108:2825–2830. doi: 10.1073/pnas.1008895108. - DOI - PMC - PubMed
    1. Davies, N. G. et al. Age-dependent effects in the transmission and control of COVID-19 epidemics. http://medrxiv.org/lookup/doi/10.1101/2020.03.24.20043018 (2020). - DOI - PubMed
    1. Here’s Our New List of Colleges’ Reopening Plans. https://www.chronicle.com/article/Here-s-a-List-of-Colleges-/248626.
    1. Paltiel AD, Zheng A, Walensky RP. Assessment of SARS-CoV-2 screening strategies to permit the safe reopening of college campuses in the United States. JAMA Netw Open. 2020;3:e2016818. doi: 10.1001/jamanetworkopen.2020.16818. - DOI - PMC - PubMed

Publication types