. 2021 Mar 15;11(1):6044.
doi: 10.1038/s41598-021-85344-w.

All-trans retinoic acid and protein kinase C α/β1 inhibitor combined treatment targets cancer stem cells and impairs breast tumor progression

Affiliations

All-trans retinoic acid and protein kinase C α/β1 inhibitor combined treatment targets cancer stem cells and impairs breast tumor progression

Damian Emilio Berardi et al. Sci Rep. .

Abstract

Breast cancer is the leading cause of cancer death among women worldwide. Blocking a single signaling pathway is often an ineffective therapy, especially in the case of aggressive or drug-resistant tumors. Since we have previously described the mechanism involved in the crosstalk between Retinoic Acid system and protein kinase C (PKC) pathway, the rationale of our study was to evaluate the effect of combining all-trans-retinoic acid (ATRA) with a classical PCK inhibitor (Gö6976) in preclinical settings. Employing hormone-independent mammary cancer models, Gö6976 and ATRA combined treatment induced a synergistic reduction in proliferative potential that correlated with an increased apoptosis and RARs modulation towards an anti-oncogenic profile. Combined treatment also impairs growth, self-renewal and clonogenicity potential of cancer stem cells and reduced tumor growth, metastatic spread and cancer stem cells frequency in vivo. An in-silico analysis of "Kaplan-Meier plotter" database indicated that low PKCα together with high RARα mRNA expression is a favorable prognosis factor for hormone-independent breast cancer patients. Here we demonstrate that a classical PKC inhibitor potentiates ATRA antitumor effects also targeting cancer stem cells growth, self-renewal and frequency.


Conflict of interest statement

The authors declare no competing interests.

Figures

Figure 1
Figure 1
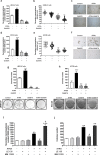
(a) Expression of classical PKC isoforms. Whole cell lysates prepared from LM38-LP and SKBR3 cell lines were resolved on sodium dodecyl sulfate–polyacrylamide gel electrophoresis and blotted with antibodies against PKC α, β and γ. Actin expression levels was used as protein loading control. (b) LM38-LP and SKBR3 cell number was assessed 96 h after treatments with ATRA (0.25–1 µM) and/or Gö6976 (0.25–1 µM) or vehicle as control. (c) LM38-LP mammospheres diameter was measured 96 h after treatments with ATRA (0.5 µM) and/or Gö6976 (0.5 µM) or vehicle as control. (d) LM38-LP cells were treated with ATRA (0.5 µM) and/or Gö6976 (0.5 µM) or vehicle as control for 48 h and then RNA was isolated. Nanog and Sox2 expression was analyzed by RT-qPCR. The fold of change of mRNA levels was calculated using the ΔΔCt method with GAPDH used as an internal control. Histograms represent mean ± S.D. (e) Representative photographs of LM38-LP mammospheres after 96 h treatments. (f) HCC38 mammospheres diameter was measured 96 h after treatments with ATRA (0.5 µM) and/or Gö6976 (0.5 µM) or vehicle as control. (g) HCC38 cells were treated with ATRA (0.5 µM) and/or Gö6976 (0.5 µM) or vehicle as control for 48 h and then RNA was isolated. Nanog and Sox2 expression was analyzed by RT-qPCR. The fold of change of mRNA levels was calculated using the ΔΔCt method with GAPDH used as an internal control. Histograms represent mean ± S.D (h) Representative photographs of HCC38 mammospheres after 96 h treatments. Scale bar 100 µm. Data represent the mean ± S.D. *p < 0.05 versus control, **p < 0.01 versus control, ***p < 0.001 versus control, #p < 0.05 versus Gö6976, ##p < 0.01 versus Gö6976 (ANOVA test). Three independent experiments were performed.
Figure 2
Figure 2
Modulation of self-renewal and clonogenic capacity of LM38-LP mammospheres. (a) Determination of LM38-LP secondary mammosphere number after 5 days in culture. (b) Determination of LM38-LP secondary mammosphere diameter after 5 days in culture. (c) Representative photographs of LM38-LP secondary mammospheres derived from pre-treated primary mammospheres are shown. (d) Determination of HCC38 secondary mammosphere number after 5 days in culture. (e) Determination of HCC38 secondary mammosphere diameter after 5 days in culture. (f) Representative photographs of HCC38 secondary mammospheres derived from pre-treated primary mammospheres are shown. Scale bar 100 µm. (g) Clonogenic capacity of LM38-LP cells derived from pre-treated mammospheres. Inset: Representative photographs of LM38-LP colonies derived from pre-treated mammospheres. (h) Clonogenic capacity of HCC38 cells derived from pre-treated mammospheres Inset: Representative photographs of HCC38 colonies derived from pre-treated mammospheres. (i) Determination of LM38-LP secondary mammosphere number derived from primary mammospheres treated with ATRA (0.5 µM) and/or MM 11,253 (1 µM), LE 135 (200 nM) or vehicle as control. (j) Clonogenic capacity of LM38-LP cells derived from pre-treated mammospheres. Data represent the mean ± S.D., *p < 0.05 versus control, **p < 0.01 versus control, ***p < 0.001 versus control, #p < 0.05 versus ATRA (ANOVA test).
Figure 3
Figure 3
Modulation of cell cycle progression, apoptosis and autophagy. (a) Analysis of LM38-LP and SKBR3 cell cycle by flow cytometry after treatments with ATRA (0.5 µM) and/or Gö6976 (0.5 µM) or vehicle as control for 96 h. Histograms represent the mean ± S.D., *p < 0.05 versus control, **p < 0.01 versus control, #p < 0.05 versus Gö6976 and ATRA (ANOVA test). Three independent experiments were performed. (b) Quantification of Annexin V staining by flow cytometry. LM38-LP cells were treated with ATRA (0.5 µM) and/or Gö6976 (0.5 µM) or vehicle as control for 96 h. Data represent the mean ± S.D, *p < 0.05 versus control, **p < 0.01 versus control, #p < 0.05 versus Gö6976 and ATRA (ANOVA test). Three independent experiments were performed. (c) Immunoblot analysis and quantification of LC3 II/LC3 I and p62/SQSTM1 for LM38-LP and SKBR3 cells pre-treated with ATRA (0.5 µM) and/or Gö6976 (0.5 µM) or vehicle as control during 48 h. Results are representative of 3 independent experiments. Histograms represent mean ± S.D. of triplicate determinations, *p < 0.05 versus control, **p < 0.01 versus control, #p < 0.05 versus Gö6976 and ATRA (ANOVA test).
Figure 4
Figure 4
Modulation of migratory potential and soluble MMP-2 activity. (a) Monolayers pre-treated for 48 h with ATRA (0.5 µM) and/or Gö6976 (0.5 µM) or vehicle alone as control were “wounded” at time 0 and cells were allowed to migrate into the cell-free area for 12 h (LM38-LP cells) or 24 h (SKBR3 cells). Cell migration was quantified by calculating the percentage of area occupied by cells that migrated into the original cell-free wounded area. Data are expressed as mean ± S.D. of triplicate determinations, *p < 0.05 versus control, **p < 0.01 versus control, #p < 0.05 versus Gö6976 and ATRA (ANOVA test). Three independent experiments were performed. Inset: Representative photographs of wounded monolayers at final time are shown (Scale bar = 50 μm): Quantification of MMP-2 secreted activity of pre-treated LM38-LP monolayers. MMP-2 lytic bands were digitalized with a Photo/Analyst Express System and signal intensity was quantified with Gel-Pro Analyzer software. Data represent mean ± S.D. of triplicate determinations, **p < 0.01 versus control, #p < 0.05 versus Gö6976 and ATRA (ANOVA test). At least 3 independent experiments were performed with similar results. Inset: Cropped bands corresponding to a representative zymogram are shown.
Figure 5
Figure 5
Modulation of Retinoic Acid Receptors. (a) LM38-LP monolayers were treated with ATRA (0.5 µM) and/or Gö6976 (0.5 µM) or vehicle as control for 48 h and then RNA was isolated. RARα, RARβ and RARγ expression was analyzed by RT-qPCR. The fold of change of mRNA levels was calculated by normalizing the absolute levels of RARs mRNA, using the ΔΔCt method with GAPDH used as an internal control. Histograms represent mean ± S.D., *p < 0.05 versus control, **p < 0.01 versus control (ANOVA test). Results are representative of three experiments. (b)Evaluation of RARα/RARγ and RARβ/RARγ expression ratio. LM38-LP and SKBR3 cells were treated with ATRA (0.5 µM) and/or Gö6976 (0.5 µM) or vehicle as control for 48 h. GAPDH was used as an internal control. Histograms represents mean ± S.D., *p < 0.05 versus control, **p < 0.01 versus control (ANOVA test).
Figure 6
Figure 6
Evaluation of tumor growth, metastatic dissemination and cancer stem cell frequency. (a) LM38-LP cells were harvested from subconfluent monolayers and orthotopically inoculated into the fat pad of BALB/c mice. Five days later, animals receive the different treatments that consist in a silastic pellet containing ATRA (10 mg) or an empty pellet as control. Mice additionally received a peritumoral injection of Gö6976 (0.2 mg/kg) in physiological solution or physiological solution as control. Size of the two perpendicular diameters was recorded and used to calculate tumor volume. Each data point represents mean ± S.D. (n = 5), *p < 0.05 versus control, **p < 0.01 versus control, #p < 0.05 versus Gö6976 (ANOVA test). Two independent experiments were performed with similar results. (b) Representative photographs of LM38-LP tumors at necropsy are shown. (c) The number and size of surface lung nodules was determined under a dissecting microscope. Each data point represents the number of lung nodules per animal. Median and range are indicated in each experimental group. **p < 0.01 versus control (Kruskall-Wallis test). Figure shows the results of one experiment representative of three independent assays. (d) RNA from LM38-LP tumors harvested post-treatment was isolated. Nanog and Sox2 expression was analyzed by RT-qPCR. The fold of change of mRNA levels was calculated using the ΔΔCt method with GAPDH used as an internal control. Histograms represent mean ± S.D. *p < 0.05 versus control, **p < 0.01 versus control, ***p < 0.001 versus control, ##p < 0.01 versus Gö6976 (ANOVA test). Three independent experiments were performed. (e) CSC frequency estimates and p values calculated by using the ELDA software are shown.
Figure 7
Figure 7
Bioinformatic analysis of PKCα (PRKCA) and RARα (RARA) mRNA expression. (a) Kaplan–Meier plots for PRKCA in negative estrogen receptor breast cancer cohorts. (b) Kaplan–Meier plots for RARA in negative estrogen receptor breast cancer cohorts. (c) Kaplan–Meier plots for the mean expression of RARA and PRKCA in negative estrogen receptor breast cancer cohorts. Log-rank p values and hazard ratios (HRs; 95% confidence interval in parentheses) are shown.

Similar articles

Cited by

References

    1. Bray F, Ferlay J, Soerjomataram I, Siegel RL, Torre LA, Jemal A. Global cancer statistics 2018: GLOBOCAN estimates of incidence and mortality worldwide for 36 cancers in 185 countries. CA Cancer J. Clin. 2018;68:394–424. doi: 10.3322/caac.21492. - DOI - PubMed
    1. Phi LTH, Sari IN, Yang YG, Lee SH, Jun N, Kim KS, Lee YK, Kwon HY. Cancer stem cells (CSCs) in drug resistance and their therapeutic implications in cancer treatment. Stem Cells Int. 2018;2018:5416923. doi: 10.1155/2018/5416923. - DOI - PMC - PubMed
    1. Colak S, Medema JP. Cancer stem cells–important players in tumor therapy resistance. FEBS J. 2014;281:4779–4791. doi: 10.1111/febs.13023. - DOI - PubMed
    1. Scioli MG, Storti G, D'Amico F, Gentile P, Fabbri G, Cervelli V, Orlandi A. The role of breast cancer stem cells as a prognostic marker and a target to improve the efficacy of breast cancer therapy. Cancers (Basel) 2019;11:1021. doi: 10.3390/cancers11071021. - DOI - PMC - PubMed
    1. Ono M, Kosaka N, Tominaga N, Yoshioka Y, Takeshita F, Takahashi RU, Yoshida M, Tsuda H, Tamura K, Ochiya T. Exosomes from bone marrow mesenchymal stem cells contain a microRNA that promotes dormancy in metastatic breast cancer cells. Sci. Signal. 2014;7:ra63. doi: 10.1126/scisignal.2005231. - DOI - PubMed

Publication types

MeSH terms