. 2021 Mar;5(3):219-228.
doi: 10.1038/s41551-021-00697-x. Epub 2021 Mar 15.

Transcranial ultrafast ultrasound localization microscopy of brain vasculature in patients

Affiliations

Transcranial ultrafast ultrasound localization microscopy of brain vasculature in patients

Charlie Demené et al. Nat Biomed Eng. 2021 Mar.

Abstract

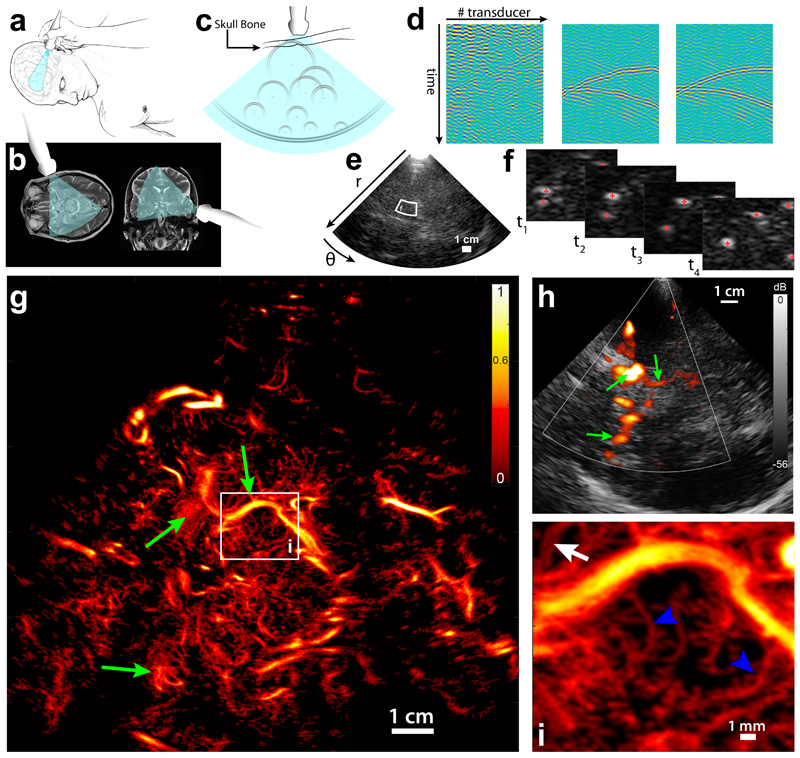
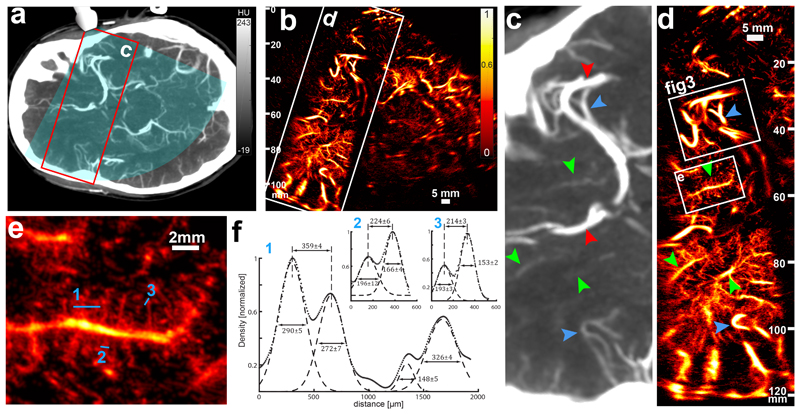
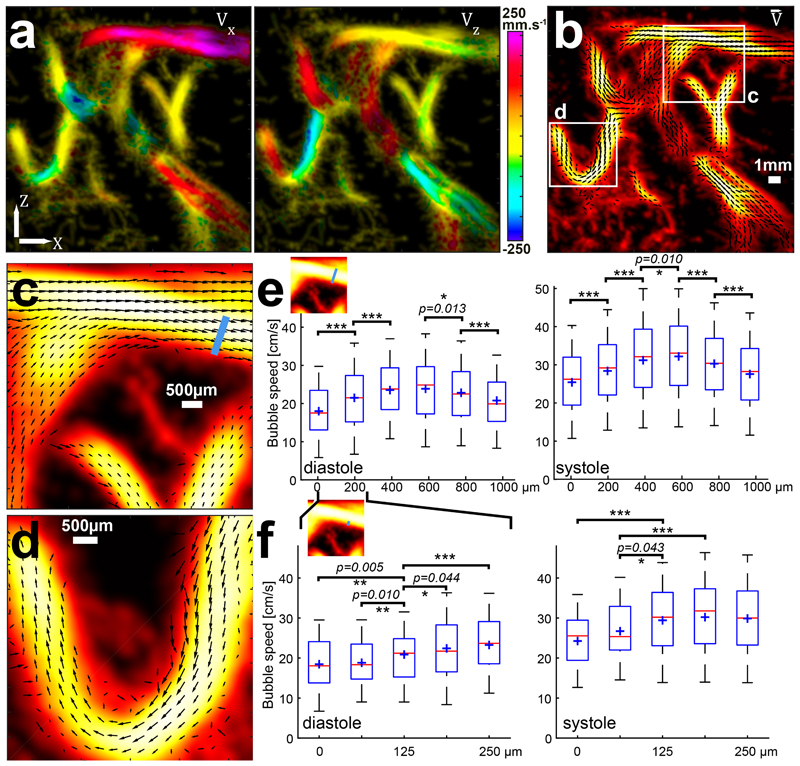
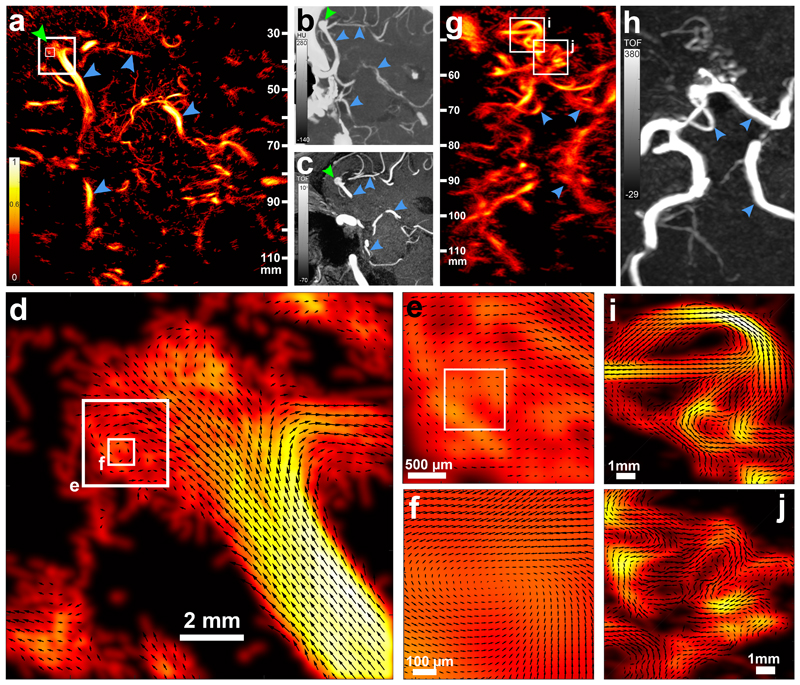
Changes in cerebral blood flow are associated with stroke, aneurysms, vascular cognitive impairment, neurodegenerative diseases and other pathologies. Brain angiograms, typically performed via computed tomography or magnetic resonance imaging, are limited to millimetre-scale resolution and are insensitive to blood-flow dynamics. Here we show that ultrafast ultrasound localization microscopy of intravenously injected microbubbles enables transcranial imaging of deep vasculature in the adult human brain at microscopic resolution and the quantification of haemodynamic parameters. Adaptive speckle tracking to correct for micrometric brain-motion artefacts and ultrasonic-wave aberrations induced during transcranial propagation allowed us to map the vascular network of tangled arteries to functionally characterize blood-flow dynamics at a resolution of up to 25 μm and to detect blood vortices in a small deep-seated aneurysm in a patient. Ultrafast ultrasound localization microscopy may facilitate the understanding of brain haemodynamics and of how vascular abnormalities in the brain are related to neurological pathologies.


Conflict of interest statement

Competing interests

M.P. and M.T. are co-founders and shareholders of Iconeus company commercializing ultrasound neuroimaging scanners. M.T. is co-inventor of the patent WO2012080614A1 filled on 2010-12-16 and licenced to Iconeus company. All other authors declare no competing interests.

Figures

Figure 1
Figure 1. Transcranial Ultrasound Localization Microscopy of deep brain vessels in patients
a. Positioning of the ultrasound transducer (Phased array XP 5-1, Supersonic Imagine) on the bone temporal window for brain imaging. b. Typical field of view in transverse and coronal brain sections. c. Diverging waves cover a wide field of view. Isolated microbubbles backscatter circular wave fronts toward the transducer array, which are distorted by the skull bone. d. Schematics of the aberration correction: (left) each transducer records the echoes backscattered from the brain, (middle) after singular value decomposition (SVD) filtering wave fronts from individual bubbles are visible and aberration law can be determined, (right) after time reversal of estimated aberration delays, bubbles echo returns to an expected hyperbola profile. e. After aberration correction, image reconstruction is performed on a polar (r,θ) grid. White box depicts zoomed area in f. f. After SVD filtering individual bubbles are localized, geometric centers are estimated and tracking of trajectories is realized. g. After the tracking of all bubbles in the field of view, a density map is reconstructed (using here 45 s of acquisition). White box depicts the zoomed panel i. Green arrows are landmarks to compare with h. Single micrograph. Scale Bar 1cm. h. Conventional Doppler image obtained in the same imaging plane as g. Green arrows are landmarks to compare with g. i. Zoom on a 15 × 17 mm area: small penetrating vessels of the mesencephalon are visible (blue arrowheads), and two very close vessels (350 μm apart) can be observed.
Figure 2
Figure 2. Estimation of the ULM resolution in a standard imaging case.
a. Patient brain axial CT scan section (6mm-thick slab) depicting the ultrasonic field of view (blue overlay) and the ROI in c and d (red rectangle). b. ULM image (2 min 15 s of acquisition) obtained in the same section, with the ROI in c and d. Replicates in 2c-e are only technical. Single micrograph. Scale Bar 5 mm c. The CT scan shows the distal part of the middle cerebral artery (red arrow, top) and a segment of the anterior cerebral artery (red arrow, bottom). Very visible vessels (blue arrowheads) are also depicted as landmarks for visual comparison with ULM image d. Some structures are faintly observable (green arrowheads) d. ULM brain imaging in the same ROI (up to 120 mm depth). Blue and green arrowheads are the same landmarks than in c. Two ROIs (white boxes) are represented for further quantification in e and f and in figure 3. e. ROI (15 × 16 mm) delineating a small penetrating vessel and its radial ramifications. Numbered blue lines are used for cross section profiling in f. f. Cross sections of a wide set of vessels (1) and two pairs of close vessels (2 and 3). Dots represent the image data (see Density and Velocity display in M&M) (arbitrary unit) and dashed lines the Gaussian fit of the vessel cross sections. Inter-peak distance and full width at half maximum are given in μm with 95% confidence intervals.
Figure 3
Figure 3. ULM characterizes hemodynamics and discrimates diastolic and systolic flow.
a. X and Z component of the speed vector extracted from the bubble trajectories overlaid on the density map. Single Micrograph. Scale Bar 1mm. b. Combination of these two components enable quantitative representation of the flow vector fields inside those 1 mm wide cerebral vessels. Two ROIs are drawn for further zoom in c and d. c. A 6 × 6 mm ROI of the speed vector representation shows two superimposed vessels (top) (crossing without junction). The two bottom vessels, with lower flow speeds, are joining veins. Black arrows quantify the local flow speed (Arrow direction corresponds to the flow direction and arrow amplitude corresponds to the blood flow amplitude) d. A 5 × 5 mm ROI showing a sharp turn in an artery. The velocity profile across the vessel is very asymmetric due to the tortuosity of the vessel. e. Quantitative assessment of the velocity profile across the whole 1 mm section of the artery of c. (blue line in the thumbnail). Bubble velocities are gathered in 188 μm wide bins (λ/4≡ diffraction-limited lateral resolution/8 at this depth); red central line indicates the median; boxes, 25th and 75th percentile; whiskers are ± 1.26 σ corresponding to 80% coverage in the Gaussian hypothesis (blue cross represents mean value). Significant differences in the mean value have been tested with p < 0.05 (*), p < 0.01 (**) and p < 0.001 (***), Analysis of variance (ANOVA) with post hoc t-test with Bonferroni correction. This quantitative velocity assessment has been done during diastole (left panel) and systole (right panel), showing largely increased bubble speeds during systole. Mean and variance (in mm/s) and samples number (bubble positions) corresponding from left to right bins (188 μm): 180+/− 78 (N=714); 215+/− 86 (N=2162); 235+/− 83 (N=2593); 239+/− 90 (N=2081); 228+/− 83 (N=1194); 208+/− 79 (N=670) during diastole (p-values are 1.1.10−19, 7.0.10−15, 0.013 and 1.3.10−5). and 254+/− 95 (N=579); 284+/− 103 (N=1575); 312+/− 106 (N= 2619); 322+/− 100 (N=2410); 303+/− 92 (N=1206); 276+/−99 (N=547) during systole (p-values are 6,6.10−8, 2,3.10−16, 0.010, 3,7.10−6 and 5,7.10−6). f. The same quantitative assessment, on the extreme border of the vessel, on a 250 μm wide cross section (see thumbnail). Bins are now 62.5 μm wide (λ/12≡ diffraction-limited lateral resolution/24 at this depth) and still show significant speed differences where the speed changes are the sharpest. Mean, variance and samples number (bubble positions) correspond from left to right bins with 65 μm: 185+/− 70 (N=213); 188+/− 71 (N=301); 209+/− 76 (N=401); 225+/− 88 (N=510); 233+/− 87 (N=525) during diastole (displayed p-values are 1-3 5.10−3, 2-3 0.010, 3-4 0.044, 3-5 9,5.10−5) and 243+/−90 (N=173); 267+/− 88 (N=206); 294+/− 95 (N=230); 302+/− 102 (N=364); 299+/− 101 (N=528) during systole (displayed p-values are (1-3) 2.1.10−6, (2-3) 0.04, (2-4) 5.10−4, (2-5) 0.01).
Figure 4
Figure 4. Clinical relevance of transcranial ULM is illustrated for a deep seated aneurysm.
a. ULM (24 s of acquisition) tilted axial brain section of a patient diagnosed with an aneurysm (green arrow) in the right MCA. Blue arrow depicts vascular landmarks visible on CT and MR images for the reader’s sake. The three white boxes correspond to the enlarged images of d–f. Representative micrograph, out of 3 images obtained. b. Maximum intensity projection of a 6 mm thick CTA slab corresponding to the ULM imaging plane. c. Maximum intensity projection of a 7 mm thick MRA slab corresponding to the ULM imaging plane. d. A 12 × 12 mm ROI on the MCA aneurysm depicting the local flow vector field. The longest arrow corresponds to a 20 cm/s speed, values above 20 cm/s are clipped. e. A 2.5 × 2.5 mm ROI on a flow vortex inside the aneurysm. f. Further zoom on an 800 × 800 μm ROI centered on the vortex, showing almost null velocity at the center. Longest arrow corresponds to a 5 cm/s speed, values above 5 cm/s are clipped g. ULM (24 s of acquisition) brain section of a patient presenting with an occlusion of the right MCA, resulting in the abnormal development of a large number of collateral arteries (white boxes). Contralateral side is visible for visual comparison. Single micrograph. h. Maximum intensity projection of a 10 mm thick CTA slab corresponding to the ULM imaging plane, where these collateral arteries are faintly observed and without functional information (flow). i. and j. ROIs (10 × 10 mm) on these collateral arteries depicting the direction and magnitude of the flow, stop points and bifurcations, enabling functional quantification. Longest arrow corresponds to a 20cm/s speed.

Comment in

  • Device downsizing via signal enhancement.
    [No authors listed] [No authors listed] Nat Biomed Eng. 2021 Mar;5(3):195-196. doi: 10.1038/s41551-021-00708-x. Nat Biomed Eng. 2021. PMID: 33727712 No abstract available.

Similar articles

Cited by

References

    1. Liesz A. The vascular side of Alzheimer’s disease. Science. 2019;365:223–224. - PubMed
    1. O’Brien JT, Thomas A. Vascular dementia. The Lancet. 2015;386:1698–1706. - PubMed
    1. Betzig E, et al. Imaging Intracellular Fluorescent Proteins at Nanometer Resolution. Science. 2006;313:1642–1645. - PubMed
    1. Rust MJ, Bates M, Zhuang X. Sub-diffraction-limit imaging by stochastic optical reconstruction microscopy (STORM) Nat Methods. 2006;3:793–796. - PMC - PubMed
    1. Errico C, et al. Ultrafast ultrasound localization microscopy for deep super-resolution vascular imaging. Nature. 2015;527:499–502. - PubMed

Publication types