. 2021 May;7(5):579-586.
doi: 10.1038/s41477-021-00874-5. Epub 2021 Mar 15.

The transcriptional landscape of Arabidopsis thaliana pattern-triggered immunity

Affiliations

The transcriptional landscape of Arabidopsis thaliana pattern-triggered immunity

Marta Bjornson et al. Nat Plants. 2021 May.

Abstract

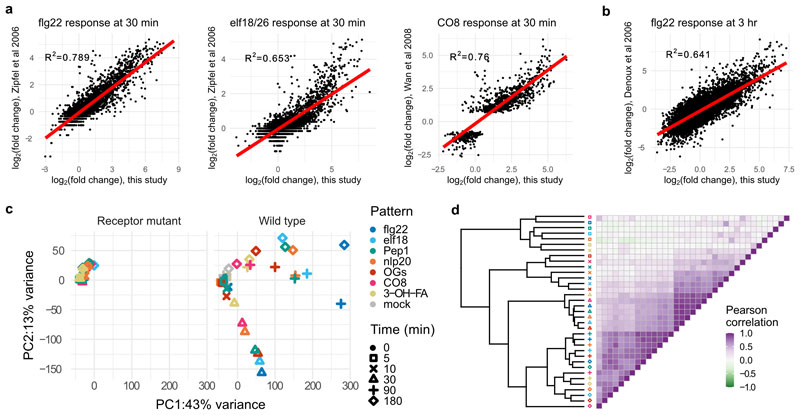
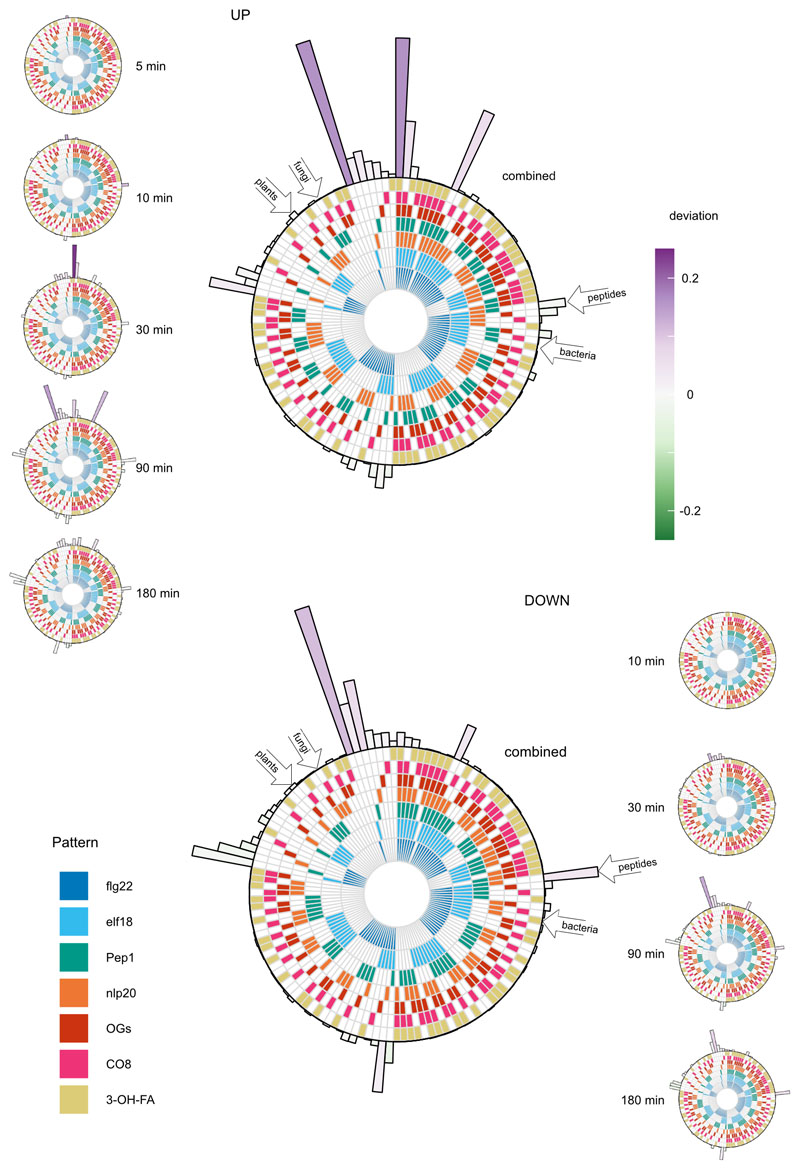
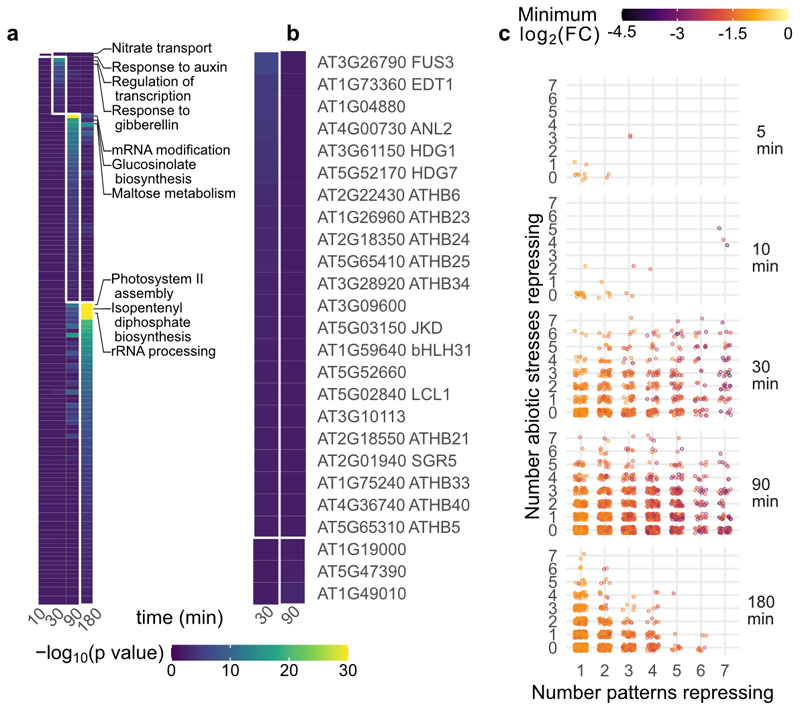
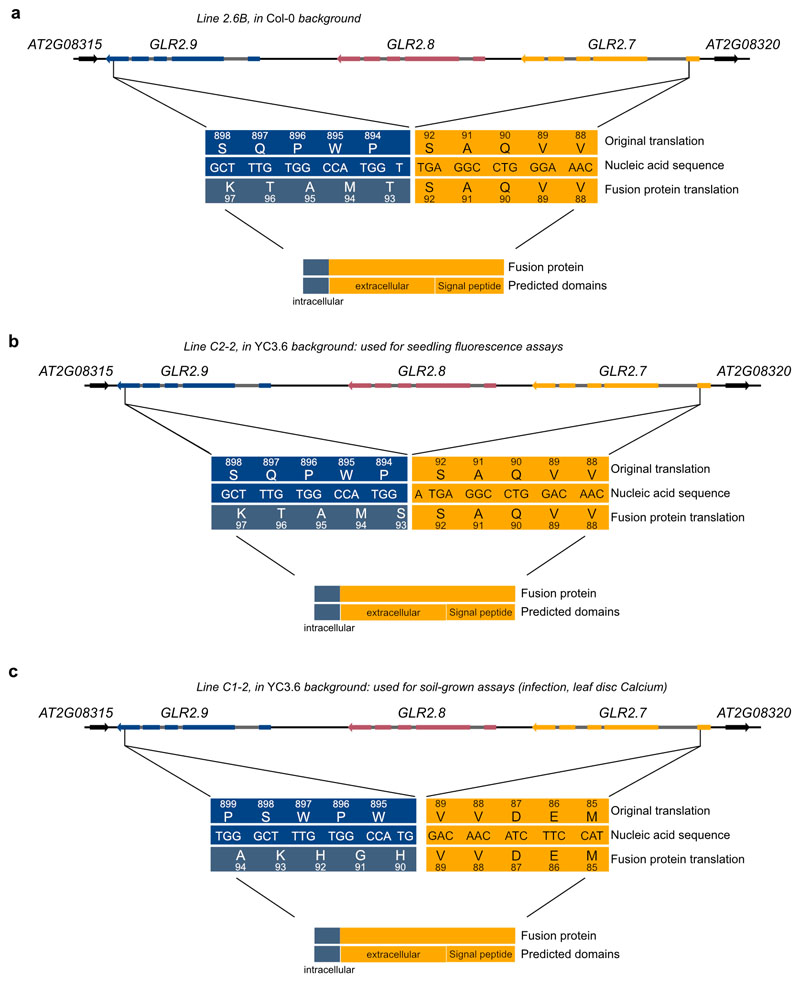
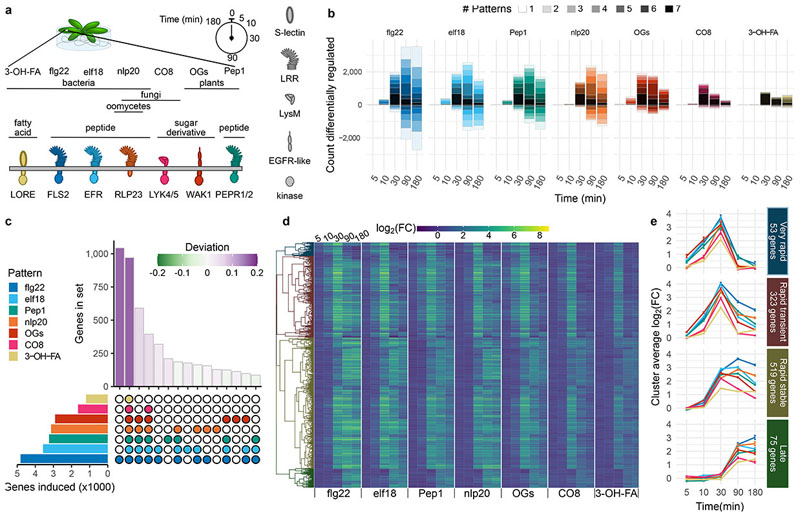
Plants tailor their metabolism to environmental conditions, in part through the recognition of a wide array of self and non-self molecules. In particular, the perception of microbial or plant-derived molecular patterns by cell-surface-localized pattern recognition receptors (PRRs) induces pattern-triggered immunity, which includes massive transcriptional reprogramming1. An increasing number of plant PRRs and corresponding ligands are known, but whether plants tune their immune outputs to patterns of different biological origins or of different biochemical natures remains mostly unclear. Here, we performed a detailed transcriptomic analysis in an early time series focused to study rapid-signalling transcriptional outputs induced by well-characterized patterns in the model plant Arabidopsis thaliana. This revealed that the transcriptional responses to diverse patterns (independent of their origin, biochemical nature or type of PRR) are remarkably congruent. Moreover, many of the genes most rapidly and commonly upregulated by patterns are also induced by abiotic stresses, suggesting that the early transcriptional response to patterns is part of the plant general stress response (GSR). As such, plant cells' response is in the first instance mostly to danger. Notably, the genetic impairment of the GSR reduces pattern-induced antibacterial immunity, confirming the biological relevance of this initial danger response. Importantly, the definition of a small subset of 'core immunity response' genes common and specific to pattern response revealed the function of previously uncharacterized GLUTAMATE RECEPTOR-LIKE (GLR) calcium-permeable channels in immunity. This study thus illustrates general and unique properties of early immune transcriptional reprogramming and uncovers important components of plant immunity.


Conflict of interest statement

Competing interests

The authors declare no competing interests.

Figures

Extended Data Fig. 1
Extended Data Fig. 1. Quality control and exploratory analysis of RNA-seq data.
Expression changes in this study at a, 30 min and b, 3 h are plotted against previously published results for flg22, elf18/26, and chitooctaose (CO8). Linear correlation shown in red, with R2 (linear regression) shown on each plot. c, PCA analysis of log2(FC) of differentially expressed genes, showing (left) minimal changes in receptor-mutant treated plants, mostly corresponding with later time points, and rays of response (right) corresponding with plants at 30, 90, or 180 min post-treatment. d, Pearson correlation heatmap of DESeq2-calculated log2(FC) showing clustering largely by time point, with the strongest correlations at 30 min.
Extended Data Fig. 2
Extended Data Fig. 2. There is little specificity in pattern-induced genes.
Among induced genes, for each pattern a specificity measure 2 (expression in response to pattern/total expression in experiment) was calculated, and genes with at least one SPM>0.33 (one pattern treatment responsible for approximately 1/3 total expression in study, n=412) were gathered. flg22 is the only pattern treatment with a large number of pattern-selective genes expressed (flg22: 332, elf18: 8, Pep1: 33, nlp20:31, OGs: 8, CO8 and 3-OH-FA:0).
Extended Data Fig. 3
Extended Data Fig. 3. Complete complement of set sizes among collapsed pattern-induced and pattern-repressed gene sets.
Each circular ‘track’ represents one pattern treatment; when filled the pattern in question alters the expression of the gene set shown at the perimeter. Gene set size is shown via bar height of bars surrounding pattern tracks, and bar color shows deviation: indicating whether the set size is larger or smaller than would be expected by chance. Large diagrams show the overall set complement of genes induced or repressed by patterns taking all time points into account, whereas smaller diagrams to the left and right are specific for the complement of genes induced or repressed at the indicated time point. No genes were significantly repressed at five minutes post-treatment. Selected pattern subset of a priori interest are highlighted through open arrows on large combined plots; none has deviation far from 0.
Extended Data Fig. 4
Extended Data Fig. 4. Pattern-responsive genes tend to be repressed by single patterns, though there does exist a core set of 93 genes repressed by all tested patterns.
A single set of genes repressed [log2(FC)<-1, p<0.05] by each pattern treatment was found through combining the lists genes repressed at each time. a, UpSet diagram showing the size of ‘collapsed’ gene sets repressed by each pattern (left) and the top 15 intersections (bottom right) by size (top right), colored by deviation from set size predicted by random mixing. b, Heat map of expression of the 93 genes repressed by all tested patterns. Genes are hierarchically clustered according to their behavior across all pattern/time combinations, and cut into three clusters. c, Visualization of average log2(FC) patterns of the three clusters identified in b, showing different patterns of expression. Error bars represent standard error of the mean.
Extended Data Fig. 5
Extended Data Fig. 5. Pattern-triggered transcriptional repression acts in time-resolved waves.
a, GO term and b, cis-element enrichment analysis of repressed genes, categorized according to the time point at which they first passed significance threshold, regardless of which pattern caused repression. The top three GO terms for each time point are indicated. c, Distribution of repressed genes. Each gene repressed in this study was plotted according to the time it is first repressed (panels from top to bottom), the number of tested patterns which repress it (x axis) and the number of abiotic stresses in the AtGenExpress dataset which also repress it within the first 3 h (y axis). The color of each dot indicates the most negative log2(FC) observed in this study.
Extended Data Fig. 6
Extended Data Fig. 6. CRISPR deletes the majority of the GLR2.7/2.8/2.9 genomic region in assayed lines.
Schematic of the GLR2.7/2.8/2.9 genomic region, with deletions in a Col-0, b and c YC3.6 background. In each case, a ‘fusion protein’ may be transcribed, consisting of approximately 90 (92, 92, 89) amino acids of GLR2.7, fused to approximately 12 (12, 13, 12) nonsense amino acids from the GLR2.9 genomic region. The potential fusion protein does not encode any transmembrane domains. GLR exons are represented by colored boxes, introns by grey boxes, and intergenic regions by black lines. Neighboring genes shown in black. Arrows represent direction of transcription.
Extended Data Fig. 7
Extended Data Fig. 7. Characterization of glr2.7/2.8/2.9 lines.
a, b, c, Increase in intracellular Ca2+ concentration in response to treatment in seedlings (a, c) or leaf discs (b). Shown are mean corrected YFP/CFP ratio within 25 min (a, b), 1 min, or 5 min (c) post-treatment (timepoint 0) +/1 standard error of the mean. Data were collected every 30 s (a, b), 5 s, or 12 s (c). For a and c corresponding peak values are shown in Figure 3, for b peak values are shown to the right of response curve. In (b), each point represents peak ratio of YFP to CFP (proportional to Ca2+ concentration) for a single seedling, normalized to initial ratio. Different shapes represent 2 independent experiments, n=11-62 for each experiment/line/treatment combination. Statistical tests were performed in R, two-way ANOVA blocking by experiment. d, Stomatal aperture of WT, glr2.7/2.8/2.9, or flg22-hyporesponsive bak1-5 plants treated with water, 5 μM flg22, or 10 μM ABA. Each point represents one stoma, and plot represents stomata from a total of 12 plants assayed over 5 experiments (n=36-178 stomata per genotype/treatment/experiment). Statistical tests were performed in R, two-way ANOVA blocking by experiment. Post-hoc tests were performed using the emmeans package in R: within each genotype, stomatal aperture was compared with mock treatment with dunnettx multiple testing correction. In spray infection assays glr2.7/2.8/2.9 are not more susceptible to e WT Pto DC3000, or f Pto COR-, deficient in the stomata-opening toxin coronatine. Bacteria were harvested from leaf discs two days post-inoculation; each point represents one plant, and shapes represent three independent experiments (n=6 plants per genotype/treatment/experiment). Statistics were performed in R: one-way ANOVA blocking by experiment followed by dunnettx multiple comparison to Col-0 performed using the emmeans package. Box plots center on the median, with box extending to the first and third quartile, and whiskers extending to the lesser value of the furthest point or 1.5x the inter-quartile range.
Extended Data Fig. 8
Extended Data Fig. 8. Leaf tissue expression patterns of genes encoding calcium-permeable channels implicated in PTI.
Data collected from Genevestigator, and scaled by each experiment.
Extended Data Fig. 9
Extended Data Fig. 9. AT3G32090 is likely miscalled as expressed in response to patterns.
AT3G032090 is among the CIR set, (a), but all reads assigned to this gene map to a single exon (b, image from integrated genomics viewer), not the pattern expected from poly-A purification of mRNA. c, The top BLAST hit for each exon of AT3G032090 are shown, with strong similarity to WRKY40 (AT1G80840) in the ‘expressed’ exon of AT3G032090. d, WRKY40 is strongly expressed (note y axis) and strongly pattern-induced. A small fraction of mis-aligned reads likely account for the observed pattern AT3G032090.
Fig. 1
Fig. 1. Rapid pattern-triggered transcriptional responses are largely common, with characteristic kinetics.
a, Arabidopsis seedlings were treated with a panel of patterns, and tissue harvested for RNA extraction at indicated times. b, Genes up- or down-regulated (|log2(FC)|>1 and padj c, UpSet diagram showing the size of gene sets induced by each pattern (left, single gene list from all times combined) and the top 15 intersections (bottom right) by size (top right). Bars for set sizes are colored by deviation from size predicted by random mixing. d, Heat map of expression of the genes commonly induced by all tested patterns. Genes are hierarchically clustered according to their behavior across all pattern/time combinations, and cut into four clusters. e, Visualization of average log2(FC) patterns of the four clusters identified in d, showing different approximate patterns of expression (time points spaced evenly to visualize early times). Error bars represent standard error of the mean.
Fig. 2
Fig. 2. Pattern-triggered transcriptional responses act in time-resolved waves, with the first wave constituting a general stress response important for immune activation.
a, GO term and b cis-element enrichment analysis of induced genes, categorized according the time point at which they first passed induction threshold, regardless of which pattern caused induction. The top three GO terms for each time point are indicated. c, Distribution of up-regulated genes. Each gene induced in this study was plotted according to the time it is first induced (panels from top to bottom), the number of tested patterns which induce it (x axis) and the number of abiotic stresses in the AtGenExpress dataset which also induce it within the first three hours (y axis). The color of each dot indicates the maximum log2(FC) observed in this study. d, Box-and-beeswarm plots of flg22-induced resistance to Pto infection. Box plots center on the median, with box extending to the first and third quartile, and whiskers extending to the lesser value of the furthest point or 1.5x the inter-quartile range. Data were obtained from three independent experiments (point shapes), n=4 per genotype/treatment combination in each experiment. Data were analyzed in R: Two-way ANOVA with experiment as a blocking factor, and p value reports the interaction between treatment and genotype.
Fig. 3
Fig. 3. A glr2.7/2.8/2.9 triple mutant is compromised in pattern-induced Ca2+ influx and bacterial disease resistance.
a, b, Parent (darker shades) or glr2.7/2.8/2.9 (lighter shades) YC3.6 reporter lines were assayed for response to a variety of patterns, salt (NaCl) or cold (4 °C) treatment; peak Ca2+ signal reported by YC3.6 within 25 min (patterns), 1 min (salt), or 5 min (cold) is shown. Each point represents peak ratio of YFP to CFP (proportional to Ca2+ concentration) for a single seedling, normalized to initial ratio.Different shapes represent 3-4 independent experiments, n=10-20 for each experiment/line/treatment combination. c, Parent and glr2.7/2.8/2.9 mutants in Col-0 and YC3.6 background were assayed for bacterial susceptibility, alongside the hypersusceptible bak1-5 mutant. Colony forming units (CFU) were counted two days post infiltration. Each point represents one infected plant and different shapes represent 3 independent experiments, n=5-7 for each experiment/line/treatment combination. Box plots center on the median, with box extending to the first and third quartile, and whiskers extending to the lesser value of the furthest point or 1.5x the inter-quartile range. Statistical tests were performed in R: ANOVA with experiment as a blocking factor, on square root of peak normalized Ca2+ response or log10(CFU). Post-hoc tests were performed using the emmeans package in R: In a and b glr2.7/2.8/2.9 was compared to parent under each treatment, and in c (left), each genotype was compared to Col-0 (dunnettx method) and (right) YC3.6 glr2.7/2.8/2.9 was compared to YC3.6.

Comment in

  • Different threats, same response.
    Cole BJ, Tringe SG. Cole BJ, et al. Nat Plants. 2021 May;7(5):544-545. doi: 10.1038/s41477-021-00915-z. Nat Plants. 2021. PMID: 34007034 No abstract available.

References

    1. Yu X, Feng B, He P, Shan L. From Chaos to Harmony: Responses and Signaling upon Microbial Pattern Recognition. Annu Rev Phytopathol. 2017;55:109–137. - PMC - PubMed
    1. Albert I, Hua C, NÜrnberger T, Pruitt RN, Zhang L. Surface sensor systems in plant immunity. Plant Physiol. 2020;182:1582–1596. - PMC - PubMed
    1. Saijo Y, Loo EP-I, Yasuda S. Pattern recognition receptors and signaling in plant-microbe interactions. Plant J. 2018;93:592–613. - PubMed
    1. Denoux C, et al. Activation of defense response pathways by OGs and Flg22 elicitors in Arabidopsis seedlings. Mol Plant. 2008;1:423–445. - PMC - PubMed
    1. Wan W-L, et al. Comparing Arabidopsis receptor kinase and receptor protein-mediated immune signaling reveals BIK1-dependent differences. New Phytol. 2019;221:2080–2095. - PMC - PubMed

MeSH terms

Substances